

Abstract
In addition to their key role in protein biosynthesis, aminoacyl-tRNA synthetases have other biological functions that appeared during their long evolutionary development. In mammalian cells, specific members of this family of enzymes are also procytokines that, upon conversion, are active cytokines in pathways for angiogenesis, and thereby connect translation to control of blood vessel development. Here we describe an in vitro assay for tube formation by tumor endothelial cells on a matrigel substrate. In contrast to normal endothelial cells, tumor endothelial cells have strong angiogenic capabilities and the ability to form vessel-like tubes on a solid substrate. In particular, we found that a SV40-immortalized mouse lymphoid endothelial cell line was robust in this assay and yielded data that could be quantified with high precision. Consequently, this specific tube formation model provides an opportunity to discover and analyze potent agents that specifically affect angiogenesis. It has proven effective for studying the angiogenic functions of tRNA synthetase cytokines.
1. Introduction
Increasing numbers of studies have showed that, from bacteria to mammals, aminoacyl-tRNA synthetases have expanded functions. These include transcriptional and translational control in prokaryotes, and specific roles in eukaryotes in RNA splicing, translational regulation, and cell signaling pathways including apoptosis, angiogenesis, cell proliferation, and the inflammatory response. These expanded roles provide a specific mechanism to link translation to broader pathways in the eukaryotic cell and are, therefore, critical to the assembly of biological systems (1–4). Tryptophanyl-tRNA synthetase (TrpRS) is a prime example of a synthetase procytokine. Through alternative splicing or natural proteolysis, fragments known as mini-TrpRS (alternative splicing), or the closely similar T2-TrpRS (natural proteolysis), are potent anti-angiogenic factors that, after exocytosis, bind to cell surface VE-cadherin and trigger arrest of neo-angiogenesis through the Akt signaling pathway (5–13).
While angiogenesis, the formation of new blood vessels from an existing vasculature, is essential for normal development in higher organisms, abnormal angiogenesis is associated with a variety of pathologies, including tumor growth and metastases, psoriasis, and diabetic retinopathy. Angiogenesis is generally essential for tumor progression and metastasis, with tumor cells producing extra amounts of growth factors (such as VEGF and bFGF) that stimulate normal endothelial cell proliferation and migration. Tumor cells also secrete many proteins and factors that stimulate overexpression of angiogenic receptors and transform normal endothelial cells into tumor endothelial cells or tumor-associated endothelial cells. Thus, abnormally high angiogenesis is found around tumor cells and tissues, so that intervention with agents that promote anti-angiogenesis is a key strategy for cancer therapy (14, 15).
Here we describe a robust assay for measuring the anti-angiogenic activity of T2-TrpRS. Our work was motivated by a need for an assay that is straightforward and relatively rapid, on the one hand and, on the other hand, can yield quantitative information about tube formation. The chick chorioallantoic membrane (CAM) assay is one of the most popular assays for angiogenesis functions (16). And yet this assay is laborious, difficult to quantify, and requires a large number of samples to obtain statistical significance. Alternatively, a cell migration assay can be used (17). This assay is also somewhat difficult to quantify and requires a large sample number for statistical significance. With the limitations of these assays in mind, we sought to establish an assay that overcame the technical difficulties of being laborious, and of being challenging for quantitation and for obtaining statistical reliability.
Taking advantage of a mouse tumor endothelial cell line (3 B11) that expresses several specific tumor endothelial cell markers, and is able to form capillary-like vascular structures in the presence of a matrigel matrix (18, 19), we established with this cell line a new endothelial cell tube formation model. This model, which is described below, has been utilized to test the angiostatic function of T2-TrpRS, alone and in combination with other potential therapeutic agents. The results obtained with this assay are amenable to quantification and, therefore, can be used to obtain dose-response information and to compare closely the effectiveness of T2-TrpRS as used in a variety of different circumstances. While the work presented here is illustrative and demonstrates the power of the assay, it has also been used more broadly to test other anti- or pro-angiogenic factors.
2. Materials
-
2.1
Human umbilical vein endothelial cells (HUVEC) from Cambrex (Charles city, IA).
-
2.2
Murine tumor endothelial cell line, 3B11, from ATCC #CRL-2160 (Manassas, VA).
-
2.3
Dulbecco’s modified Eagle Medium (DMEM), fetal bovine serum (FBS), 1× trypsin, PBS, penicillin, streptomycin and rhodamine phalloidin from Invitrogen (Carlsbad, CA).
-
2.4
EGM (complete endothelial growth medium) from Lonza (Walkersville, MD).
-
2.5
Matrigel matrix (basement membrane) from BD Biosciences (#354234) (Bedford, MA).
-
2.6
Formaldehyde from Polysciences (Warrington, PA).
-
2.7
48-well and 24-well plates, T75 flask from Corning (Corning, NY).
-
2.8
4-well chamber slides from Nunc (Rochester, NY).
-
2.9
Inverted phase microscope from Leica (Wetzlar, Germany).
-
2.10
4, 6-diaamidino-2-phenylindole, dihydrochioride (DAPI) (Eugene, Oregon).
-
2.11
Rainbow Radiance 2100 Laser Scanning Confocal system attached to a Nikon TE2000-U inverted microscope from BioRad-Zeiss (Thornwood, NY).
-
2.12
DMEM complete medium: DMEM supplemented with 10% FBS, 1× penicillin/streptomycin.
3. Methods
3.1. Endothelial cell culture and maintenance
Murine tumor endothelial cells, 3B11, were cultured in a humidified incubator with 5% CO2, DMEM supplemented with 10% FBS, and 1× penicillin/streptomycin. Two days before performing the tube formation assay, 6 × 10⁵ 3B11 cells were cultured in a T75 flask. The cells reached 80 to 95% confluence on the day of tube formation assay.
3.2. Endothelial cell tube formation assay
The day before performing the tube formation assay, a matrigel matrix was incubated on ice overnight. On the day of the assay, 0.15 ml matrigel matrix was transferred to 48-well plate (0.25 ml to 24-well plate or 0.3 ml to 4-well chamber slides). The plates or slides were incubated at 37 °C, 5% CO2 for 30 min.
During the incubation time, endothelial cells in T75 flasks were washed with PBS and digested with 1× trypsin solution for about 3 min, and suspended in 8 ml DMEM complete medium. The cells were counted and diluted to 4 × 10⁵/ml in DMEM complete medium.
To set up the tube formation assay, diluted testing agent (120 μl), such as T2-TrpRS, was transferred to a 1.5 ml tube and mixed with equal volume of endothelial cells. The mixture (200 μl) was transferred to each well containing the matrigel matrix. The plates or slides were incubated at 37 °C, 5% CO2 for 4 to 16 hours according to the size of the tube.
3.3. Endothelial cell tube image and quantification
3.3.1. EC Tube Image by Phase Contrast Microscopy
During endothelial cell tube formation, the tubes, without fixation and staining, can be continuously monitored and imaged under a phase contrast inverted microscope at 5× objective magnification (or 2.5× and 10× objectives) using computer-controlled ProMax software (Bio-TEC Instruments Inc., Winooski, VT) (Fig 1). For quantitative analysis, the cell culture medium in the well was carefully removed without disturbance of the tubes or matrigel. The tubes were fixed with 1 ml 3.6% formaldehyde for 30 min at room temperature, washed 3× with PBS, permeated by incubation with 1 ml 0.1% Triton X-100-PBS for 5 min, washed twice by PBS and blocked with 1 ml 1% BSA-PBS for 30 min at room temperature. The tubes were stained with rhodamine phalloidin (200 μl) in 1% BSA-PBS for 30 min and washed twice with PBS. Nuclei of the cells were stained with DAPI-PBS (10 μg/ml) for 30 min and washed 3× with PBS. Tubes were imaged by 2D widefield fluorescence or 3D confocal fluorescence microscopy as described below.
Fig. 1.
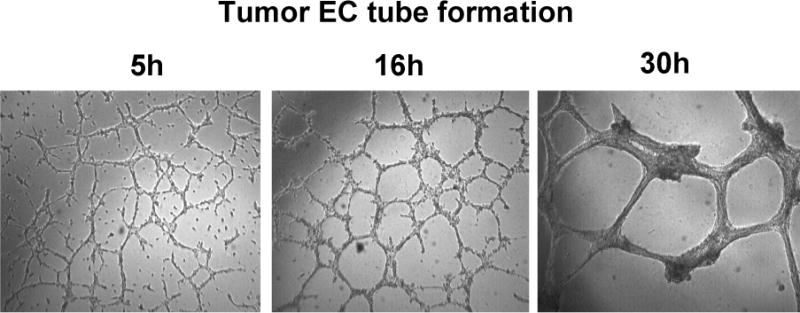
Time course of tumor endothelial cell tube formation.
Tumor endothelial cells (3B11, 2× 10⁵/ml) were incubated with matrigel and the tubes were imaged at 5, 16, and 30h, respectively, under an inverted phase microscope with a Leica DC350F CCD camera at 5× objective magnification using computer-controlled ProMax software.
3.3.2. Angiogenesis Quantitation Assay: 2D Widefield Fluorescence
Wide-field fluorescence images (2D) were acquired with a Leica DC350F CCD camera attached to an inverted Leica DMIL microscope and captured using Pro-Max software. Images were then converted to high resolution tif files that were used for analysis. Rhodamine phalloidin was used to fluorescently label the actin cytoskeleton that is abundant in the EC cytoplasm and this was ideal for monitoring EC tube formation under various conditions (as an example, see Figure 2a).
Figure 2.
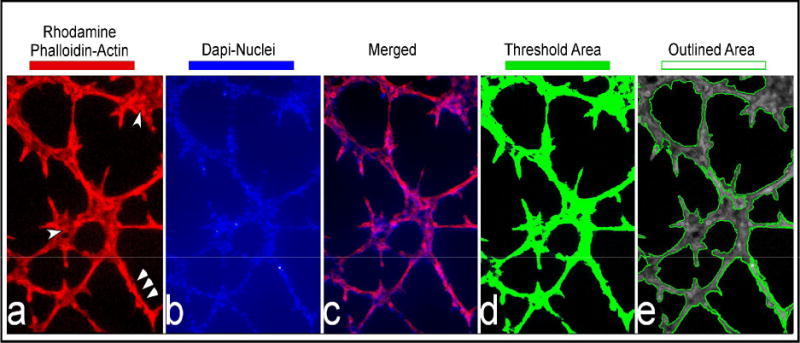
2D image and quantitation of fluorescence-stained tubes.
Rhodamine phalloidin and DAPI-stained tubes were imaged using a widefield fluorescence microscope. This figure shows a typical representation of endothelial cell tubes stained for F-actin (2a), the nucleus (2b), and the merged image (2c). The last two panels show the tubes thresholded (2d) and outlined (2e) by the Image Pro Plus Software
Figure 2 (a–e) demonstrates a typical growth pattern of ECs after 8h, where a tubal network has formed in a matrigel that consists of clustered regions (single arrow heads in Figure 2a) and branches (triple arrow heads in Figure 2a). Thus, the fluorescent rhodamine signal (that was deemed a real signal above background fluorescence) was used to define the spatial location of the branched and clustered ECs in the matrigel. Because these were single widefield fluorescent images, the analysis was 2 dimensional (2D). To account for the 2D feature of the images, area calculations assumed a uniform height parameter.
Image Pro Plus software (Media Cybernetics Inc, Bethesda MD) was used to trace the fluorescent signal in each 2D image using the threshold tool (typically a signal between 50–256 (fluorescent intensity) was considered a real signal in these 8 bit images) This threshold is pseudo-colored in green by the software and is displayed as a layer over the 8 bit grey scale original image that showed what had been traced, i.e., the spatial area of interest (as shown in Figure 2d). Once traced, the area in green is outlined by the software and then these outlined regions (see Figure 2e) were used to calculate 2D parameters such as area (assuming a uniform height), perimeter, and average length of each connected vessel. These parameters were then imported into Excel for statistical analysis and graphing. This analytical method was an adaptation of one of our previous assays that defined the extent of angiogensis in HMECS (20).
Because our samples were also counter stained with DAPI to label the nuclei of the ECs (Figure 2b), we could easily distinguish individual cells and even note those that were expiring. We defined a minimum area cut-off, to account for potentially dead ECs in clusters that would not grow and thus misrepresent our analysis. Specifically, very small cell clusters (less than 20 μm in diameter and less than 5–7 cells per cluster) that consisted of rounded cells with very picnotic nuclei were omitted from the final analysis.
3.3.3. Angiogenesis Quantitation Assay: 3D Confocal Fluorescence
In an addition to the 2D analysis described previously, a more involved analysis, using 3 dimensional (3D) images was utilized. Images were acquired using a Rainbow Radiance 2100 Laser Scanning Confocal system attached to a Nikon TE2000-U inverted microscope (BioRad-Carl Zeiss Inc., Thornwood, NY). Optical image slices (8-bit) were obtained using a 4× objective to capture as much area as possible (10 micron interval step slices). Images were acquired using Laser Sharp 2000 software and then imported and further analyzed for detailed quantitative 3D analysis using the Imaris software (BitPlane Inc, Saint Paul, MN). Once imported into the Imaris software, the macro “filament tracker” was used to generate a 3D solid mask of the original fluorescence signal (see Figures 3a, b). As described above, the rhodamine phalloidin fluorescent signal was used to define the spatial location of the clusters and branches of ECs in the matrigel, but in this instance it was done as a 3D image (Figure 3a). A threshold between 70 and 256 was considered a true signal in these 8 bit images. The filament tracker tool in IMARIS automatically traced the threshold signal and created a 3D cylindrical outline of the EC network (macro designed for this purpose in IMARIS) (see Figure 3b & merged with nuclei count (Figure 3c and d).
Figure 3.
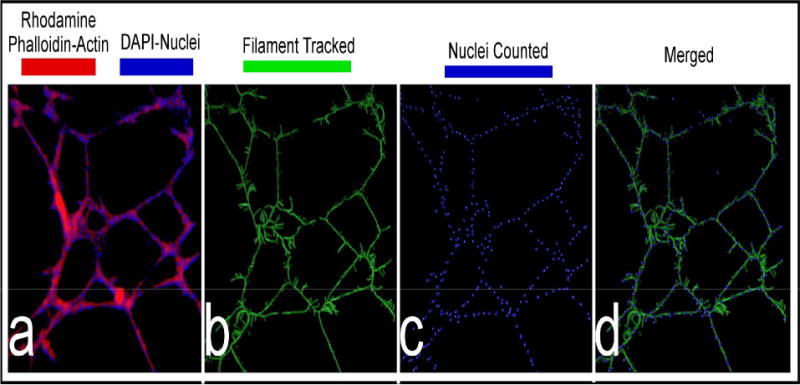
Three dimensional images of tubes by confocal microscope.
Tumor endothelial cells were incubated in a matrigel and then fixed and stained with rhodamine phalloidin (red) and DAPI (blue), for visualizing the actin cytoskeleton and nuclei, respectively (3a). Panel (3b) displays the IMARIS filament-tracked image of the F-actin cytoskeleton, while panel (3c) displays the nuclei that were counted by marking them with a sphere. Panel (3d) is the merged image between (3b) and (3c).
When the outline of the filament track (which has dimensions that are based on the original signal) is created, the software can extract parameters such as average vessel length, area, volume, number of free unassociated termination points, and number of branch points. In addition, based on the numbers of DAPI-stained nuclei in tubes, the number of ECs per branch or per tube could be automatically counted. The “spot tracking” tool in IMARIS was used to automatically locate the DAPI-stained nuclear fluorescence signal and then mark the center of each nucleus with a solid sphere (macro designed for this purpose in IMARIS) (Figure 3c). The IMARIS software could then display parameters such as the number of nuclei per branch, per tube, or per field, and their fluorescent intensities and locations. After the software calculated a various parameters described above, it displayed the data in Excel, where it could be further analyzed for statistics and graphing. Each experiment was repeated in triplicate. Five to seven fields per sample per experiment were usually captured and analyzed as indicated above.
4. Notes
-
4.1
Endothelial cell quality is critical to tube length and shape. The 3B11 cells should be less than 30 days in culture. Long term culture of the cells results in either a tube shape change or poor tube formation capability. For maintenance, these endothelial cells should be split before they reached confluence.
-
4.2
Endothelial cell concentration also affects the ability for tube formation. We routinely used 2× 10⁵ cells/ml at final concentration. Tubes will be poorly formed if the cell concentration is too low. In contrast, the cells become confluent on the top of the matrigel and there is no regular tube-like structure formation if the cell concentration is too high.
-
4.3
DMEM complete medium should be used within two weeks after preparation and exposed to the air for as short a time as possible. Long time of storage, or exposure of the complete medium to air, will turn the medium to a pink color that is correlated with a decrease in endothelial cell tubes that form.
-
4.4
The matrigel matrix is a liquid solution on ice or at 4 °C, but turns to a semisolid at 37 °C. The residual matrigel matrix that is not used can be frozen at −20 °C and used later.
-
4.5
Because matrigel is fragile, after tube formation, care must be taken during the steps of fixation, washing, and fluorescence dye staining to avoid disruption of the tubes.
-
4.6
After fluorescence dye staining, the tubes may be imaged right away or stored at 4 °C for a couple of days. Long term storage of the fluorescence-stained tubes will result in loss of fluorescence signal. However, formaldehyde-fixed tubes can be stored at 4 °C for several weeks. Thus, several batches of fixed tube samples at 4 °C can be saved and used together for fluorescence staining.
-
4.7
Acidic or alkaline pH will affect endothelial cell tube formation. Testing agents used in tube formation assay should be kept around pH 7.4.
-
4.8
All of the materials and reagents in tube formation assays should be sterile and tested in cell culture. Bacterial contamination and cell toxic agents will induce endothelial cell apoptosis, death, and tube disruption.
5. Discussion
In the last 4 decades, more than ten different assays for measuring angiogenesis, or anti-angiogenesis, have been reported. These include in vitro assays for endothelial cell proliferation, migration, tube formation, aortic ring formation, and vessel outgrowth from organ culture (21). In addition to the widely used chick chorioallantoic membrane (CAM) assay, in vivo assays include sponge implantation, chamber, corneal, zebrafish, and tumor angiogenesis models (22). In spite of this long history and the variety of assays, a reliable and technically straightforward method for assaying angiogenesis is still a challenge, especially when large numbers of compounds need to be screened and verified.
While the above-described endothelial tube formation assay has many advantages over other in vitro angiogenesis assays, it has been limited by the large variation of tube forming capability among different endothelial cell resources, the effects of cell passages, and the ability to quantify the tubes. Our work sought to address these limitations. In particular, HUVECs, BAECs, and several HMVECs from normal tissues have been historically used in the tube formation assays. These are primary cells with a variety of characteristics and morphologies, can have limited passage times, and usually go to senescence after 10 to 12 passages in culture.
In this paper, we used tumor endothelial cell line 3B11 in the tube formation assay. This cell line was chosen because of their relative ease of use for the assay, and for the ability to obtain good quantitation. To our knowledge, although its tube formation capability was described earlier in the literature (19), this work is the first to quantitatively develop and exploit the 3B11 line for the tube formation assay. The 3B11 line is derived from SV40-immortalized mouse lymphoid endothelial cell line SVEC4-10, which retained much of the normal endothelial cell identities, but acquired tumor endothelial cell characteristics, including tumor endothelial cell markers (TEM)-1, TEM-5, TEM-7, and TEM-8. The growth behavior, like other tumor cells, is growth-factor independent, and has robust proliferation and tube formation capability (18, 19). These characteristics of 3B11 are shared with human tumor endothelial cells from metastatic tumors. Altogether, seven endothelial cell lines, 3B11, 2H11, SEVC4-10, SEVC4-10-EHR1, HUVEC, BAEC, and HMVEC, were tested by us. Of the seven tested cell lines, the 3B11 cell line gave by far the best results. Using the 3B11 cell line, we observed that the shapes of the tubes are relatively homogenous and suitable for quantitative analysis, and that there is only a small variation in tube formation from batch to batch. For example, statistical analysis showed that, with three different batches of tumor endothelial cells, the average area occupied by the tube-forming network per acquired field was 70,152 μm2 ± 2,210 μm2, and the average tube length was 262 ± 4 μm. Thus, the variation among the three batches of assays was less than 4%. In addition to the ability to obtain accurate data, when compared to our previous angiogenesis assay to define the extent of vascularity (21), this method, with these particular cells, is less laborious and provides more parameters (such as volume and area, average vessel length, number of free unassociated termination points, number of branch points, and number of nuclei associated with the various vessels).
We compared the anti-angiogenic activity of T2-TrpRS in our tumor endothelial cell 3B11 model with the activity in the normal endothelial cell HUVEC model. We found that T2-TrpRS only inhibited and disrupted 3B11 tumor endothelial cell tube formation, but did not interfere with HUVEC tube formation (unpublished observation). This difference may be due to a tumor-cell-directed specificity for T2-TrpRS or that 3B11 line may be inherently more robust or sensitive in this assay. But regardless of the explanation, this result highlights the importance of testing agents against more than one endothelial cell type.
Although the endothelial cell tube formation assay described in this paper has many attractive features, especially for ease of use and quantitation, it also has a potential pitfall when considering applications for human therapies. Specifically, tumor endothelial cell 3B11 was derived from mouse lymph endothelial cells. Thus, these cells might have important differences when compared with human tumor endothelial cells. For drug screening, human tumor endothelial cells are the natural choice for studying human tumor cell angiogenesis and for searching for anti-angiogenic drugs for human cancer therapies. However, a human tumor endothelial cell line is not available at present and for that reason the 3B11 tube formation model described here is an important alternative.
Acknowledgments
This study was supported by grant number CA 92577 from the NCI and by a fellowship from the National Foundation for Cancer Research.
Footnotes
Publisher's Disclaimer: This is a PDF file of an unedited manuscript that has been accepted for publication. As a service to our customers we are providing this early version of the manuscript. The manuscript will undergo copyediting, typesetting, and review of the resulting proof before it is published in its final citable form. Please note that during the production process errors may be discovered which could affect the content, and all legal disclaimers that apply to the journal pertain.
References
- 1.Schimmel P. Aminoacyl-tRNA synthetases: General scheme of structure-functional relationships in the polypeptides and recognition of transfer RNAs. Annu Rev Biochem. 1987;56:125–158. doi: 10.1146/annurev.bi.56.070187.001013. [DOI] [PubMed] [Google Scholar]
- 2.Park SG, Ewalt KL, Kim S. Functional expansion of aminoacyl-tRNA synthetases and their interacting factors: new perspectives on housekeepers. Trends Biochem Sci. 2005;30:569–574. doi: 10.1016/j.tibs.2005.08.004. [DOI] [PubMed] [Google Scholar]
- 3.Ivakhno SS, Kornelyuk AI. Cytokine-like activities of some aminoacyl-tRNA synthetases and auxiliary p43 cofactor of aminoacylation reaction and their role in oncogenesis. Exp Oncol. 2004;26:250–255. [PubMed] [Google Scholar]
- 4.Giege R. The early history of tRNA recognition by aminoacyl-tRNA synthetases. J Biosci. 2006;31:477–488. doi: 10.1007/BF02705187. [DOI] [PubMed] [Google Scholar]
- 5.Tzima E, Schimmel P. Inhibition of tumor angiogenesis by a natural fragment of a tRNA synthetase. Trends Biochem Sci. 2006;31:7–10. doi: 10.1016/j.tibs.2005.11.002. [DOI] [PubMed] [Google Scholar]
- 6.Wakasugi K, Schimmel P. Two distinct cytokines released from a human aminoacyltRNA synthetase. Science. 1999;284:147–151. doi: 10.1126/science.284.5411.147. [DOI] [PubMed] [Google Scholar]
- 7.Otani A, Slike BM, Dorrell MI, Hood J, Kinder K, Ewalt KL, Cheresh D, Schimmel P, Friedlander M. A fragment of human TrpRS as a potent antagonist of ocular angiogenesis. Proc Natl Acad Sci USA. 2002;99:178–183. doi: 10.1073/pnas.012601899. [DOI] [PMC free article] [PubMed] [Google Scholar]
- 8.Wakasugi K, Slike BM, Hood J, Ewalt KL, Cheresh DA, Schimmel P. Induction of angiogenesis by a fragment of human tyrosyl-tRNA synthetase. J Biol Chem. 2002;277:20124–20126. doi: 10.1074/jbc.C200126200. [DOI] [PubMed] [Google Scholar]
- 9.Wakasugi K, Slike BM, Hood J, Otani A, Ewalt KL, Friedlander M, Cheresh DA, Schimmel P. A human aminoacyl-tRNA synthetase as a regulator of angiogenesis. Proc Natl Acad Sci USA. 2002;99:173–177. doi: 10.1073/pnas.012602099. [DOI] [PMC free article] [PubMed] [Google Scholar]
- 10.Kise Y, Lee SW, Park SG, Fukai S, Sengoku T, Ishii R, Yokoyama S, Kim S, Nureki O. A short peptide insertion crucial for angiostatic activity of human tryptophanyl-tRNA synthetase. Nat Struct Mol Biol. 2004;11:149–156. doi: 10.1038/nsmb722. [DOI] [PubMed] [Google Scholar]
- 11.Yang X-L, Schimmel P, Ewalt KL. Relationship of two human tRNA synthetases used in cell signaling. Trends Biochem Sci. 2004;29:250–256. doi: 10.1016/j.tibs.2004.03.002. [DOI] [PubMed] [Google Scholar]
- 12.Tzima E, Reader JS, Irani-Tehrani M, Ewalt KL, Schwartz MA, Schimmel P. VE-cadherin links tRNA synthetase cytokine to anti-angiogenic function. J Biol Chem. 2005;280:2405–2408. doi: 10.1074/jbc.C400431200. [DOI] [PubMed] [Google Scholar]
- 13.Banin E, Dorrell MI, Aguilar E, Ritter MR, Aderman CM, Smith AC, Friedlander J, Friedlander M. T2-TrpRS inhibits preretinal neovascularization and enhances physiological vascular regrowth in OIR as assessed by a new method of quantification. Invest Ophthalmol Vis Sci. 2006;47:2125–2134. doi: 10.1167/iovs.05-1096. [DOI] [PubMed] [Google Scholar]
- 14.Folkman J. Angiogenesis. Annu Rev Med. 2006;57:1–18. doi: 10.1146/annurev.med.57.121304.131306. [DOI] [PubMed] [Google Scholar]
- 15.Jubb AM, Oates AJ, Holden S, Koeppen H. Predicting benefit from antiangiogenic agents in malignancy. Nat Rev Cancer. 2006;6:626–631. doi: 10.1038/nrc1946. [DOI] [PubMed] [Google Scholar]
- 16.Nguyen M, Shing Y, Folkman J. Quantitation of angiogenesis and antiangiogenesis in the chick embryo chorioallantoic membrane. Microvasc Res. 1994;47:31–40. doi: 10.1006/mvre.1994.1003. [DOI] [PubMed] [Google Scholar]
- 17.Alessandri G, Raju K, Gullino PM. Mobilization of capillary endothelium in vitro induced by effectors of angiogenesis in vivo. Cancer Res. 1983;43:1790–1797. [PubMed] [Google Scholar]
- 18.O’connell KA, Edidin M. A mouse lymphoid endothelial cell line immortalized by simian virus 40 binds lymphocytes and retains functional characteristics of normal endothelial cells. J Immun. 1990;144:521–525. [PubMed] [Google Scholar]
- 19.Walter-Yohrling J, Morgenbesser S, Rouleau C, Bagley R, Callahan M, Weber W, Teicher BA. Murine endothelial cell lines as models of tumor endothelial cells. Clin Cancer Res. 2004;10:2179–2189. doi: 10.1158/1078-0432.ccr-03-1013. [DOI] [PubMed] [Google Scholar]
- 20.Kiosses WB, Hood J, Yang S, Gerritsen ME, Cheresh DA, Alderson N, Schwartz MA. Dominant negative p65 peptide inhibits Angiogenesis. Circ Res. 2002;90:697–702. doi: 10.1161/01.res.0000014227.76102.5d. [DOI] [PubMed] [Google Scholar]
- 21.Nicosia RF, Lin YJ, Hazelton D, Qian X. Endogenous regulation of angiogenesis in the rat aorta model. Role of vascular endothelial growth factor. Am J Pathol. 1997;151:1379–1386. [PMC free article] [PubMed] [Google Scholar]
- 22.Staton CA, Stribbling SM, Tazzyman S, Russell H, Brown NJ, Lewis CE. Current methods for assaying angiogenesis in vitro and in vivo. Int J Exp Path. 2004;85:233–248. doi: 10.1111/j.0959-9673.2004.00396.x. [DOI] [PMC free article] [PubMed] [Google Scholar]