Abstract
MicroRNAs (miRNAs) are small noncoding RNAs capable of inhibiting gene expression post-transcriptionally and expression profiling can provide therapeutic targets and tools for cancer diagnosis. Chondrosarcoma is a mesenchymal tumor with unknown cause and differentiation status. Here, we profiled miRNA expression of chondrosarcoma, namely clinical samples from human conventional chondrosarcoma tissue, established chondrosarcoma cell lines, and primary non-tumorous adult articular chondrocytes, by miRNA array and quantitative real-time PCR. A wide variety of miRNAs were differently downregulated in chondrosarcoma compared to non-tumorous articular chondrocytes; 27 miRNAs: miR-10b, 23b, 24-1*, 27b, 100, 134, 136, 136*, 138, 181d, 186, 193b, 221*, 222, 335, 337-5p, 376a, 376a*, 376b, 376c, 377, 454, 495, 497, 505, 574-3p, and 660, were significantly downregulated in chondrosarcoma and only 2: miR-96 and 183, were upregulated. We further validated the expression levels of miRNAs by quantitative real-time PCR for miR-181a, let-7a, 100, 222, 136, 376a, and 335 in extended number of chondrosarcoma clinical samples. Among them, all except miR-181a were found to be significantly downregulated in chondrosarcoma derived samples. The findings provide potential diagnostic value and new molecular understanding of chondrosarcoma.
Keywords: microRNA, chondrosarcoma, cartilage, sarcoma, malignancy
Introduction
MicroRNAs (miRNAs) are a class of short noncoding RNA with length of 20-24 nucleotides. They function by binding to multiple target mRNAs, preferentially to their 3′ UTR with partial complementarity, thereby inhibiting the expression by destabilizing the mRNAs and/or disturbing translation. The expression of miRNAs is regulated tightly in a cell type, differentiation and activation-dependent manner. Growing lines of evidence indicate miRNAs play important roles both in physiological development and pathogenesis.1 Chondrosarcoma is the second most common primary malignant tumor of bone.2 Chondrosarcomas are histologically subtyped into conventional (80-90 %), dedifferentiated (10 %), mesenchymal (3-10 %), and clear cell chondrosarcomas (approximately 2 % of all chondrosarcomas),2 however, molecular pathophysiology of the disease has not been fully understood.
In the current study, we focused on the expression profile of miRNAs in conventional chondrosarcoma, and identified differently expressed miRNAs compared to other types of cells including primary non-tumorous human articular chondrocytes by miRNA array and quantitative real-time PCR.
Methods
Patients and tissue samples
A total of 20 tissue samples from conventional chondrosarcoma patients along with 2 chondrosarcoma cell lines, namely SW1353 and OUMS-27 cell lines, and 3 primary non-tumorous chondrocyte preparations (PNC) derived from normal human articular cartilage were analyzed as cartilaginous samples. Normal skeletal muscle (NSM) derived RNA sample, NRS-1 rhabdomyosarcoma cells, and HEK293T cells were used as non-cartilaginous samples. NSM derived RNA and NRS-1 cell line were used as muscle related samples as chondrocyte free negative controls. HEK293T cells, deriving from human embryonic kidney and being one of the most intensively characterized cell lines, were also used as a negative control. All 20 chondrosarcoma samples were obtained at the time of biopsy or surgery with informed consent from patients who were treated at National Cancer Center Hospital (Tokyo, Japan). The ethical review board approved the project. All cases were reviewed and histopathologically diagnosed by a certified pathologist. Clinical staging was determined based on the criteria according to the Musculoskeletal Tumor Society Surgical Staging System.3 The tumor tissues were snap-frozen immediately after excision and stored at -80 °c until total RNA extraction.
Cell culture and other RNA sources
SW1353 grade II conventional chondrosarcoma cells (ATCC no. HTB-94), OUMS-27 grade III conventional chondrosarcoma cells (JCRB no. IFO50488) NRS-1 human rhabdomyosarcoma cells (Riken BioResource Center, permission from Dr. Motoyama, no. RCB1188), and HEK293T cells were cultured according to providers’ instruction. PNC were obtained from normal articular cartilages of the knee at autopsy from 3 donors: 45-, 50-, and 60-year-old males, and prepared according to the method described previously.4 In brief, excised cartilages were finely chopped into fine pieces, followed by enzymatic digestion of associated extracellular matrix component, and then, separated chondrocytes were washed several times in Hams-F12, counted the cell number, and checked for viability using trypan blue staining. The isolated chondrocytes were cultured in DMEM supplemented with 10% FBS, 100 μ g/ml penicillin/streptomycin solution (Gibco/Invitrogen). These primary chondrocytes within 4 passages were cultured until 60-80 % confluent, and subjected to total RNA extraction. The expression levels of chondrocytic gene markers were assessed by RT-PCR. The primer sets used were as follows: COL1A15′-AGGGTCACCGTGGCTTCT-3′, CAGGAGCACCAGCAGAGC; COL2A1 5′-GGCAATAGCAGGTTCACGTACA-3′, 5′-CGATAACAGTCTTGCCCCACTT-3′; COL10A1 5′-GGCAGAGGAAGCTTCAGAAA-3′, 5′-AAGGGTATTTGTGGCAGCATA-3′; GAPDH 5′-CCTGGTCACCAGGGCTGC-3′, 5′-CGCTCCTGGAAGATGGTGATG-3′. Total RNA extracted from NSM was purchased from Clontech (CA, USA).
MiRNA microarray assay
The assays were performed with Agilent miRNA array system (CA, USA), including probe sets for 723 miRNAs. A 100 ng total RNA sample was used according to the manufacturer's instruction. Following digitization of the primary scanned images, the data were further analyzed using NIA array analysis software.5 The criteria for extracting differently expressed miRNAs were set to a condition: fold change was > 10 in the digitized fluorescent intensity, and false discovery rate was < 0.3. Heat map analysis and hierarchical clustering were carried out by TIGR-MEV ver. 4.4.6
Quantitative real-time PCR (qPCR)
TaqMan miRNA assay kits were purchased from Applied Biosystems (CA, USA): hsa-miR-181a (4373117), hsa-miR-let-7a (catalog no. 4373169), hsa-miR-100 (4373160), hsa-miR-222 (4395387), hsa-miR-136 (4373173), hsa-miR-376a (4373026), hsa-miR-335 (4373035), and RNU6B (4373381). A total of 0.6 ng of complementary DNA templates per sample were used for the reaction. Each sample was assayed in duplicate, and the data with more than 1.0 of difference in Ct values were excluded from further analysis. Fold change expression of each miRNA was calculated by ΔΔ-CT method compared to the mean expression level of PNC. RNU6B was used as an internal control.
Statistical analysis
The data from miRNA microarray were analyzed by ANOVA on NIA array analysis. The statistical significance was calculated by the false discovery rate method. The actual criteria for extracting particular miRNAs have been described above. Statistically significant differences in qPCR were assessed by ANOVA followed by pairwise t-test with Bonferroni's correction. P values < 0.05 were considered as significant. Statistical calculations in qPCR analysis were performed using StatView ver. 5.0 (SAS Institute, NC, USA).
Results
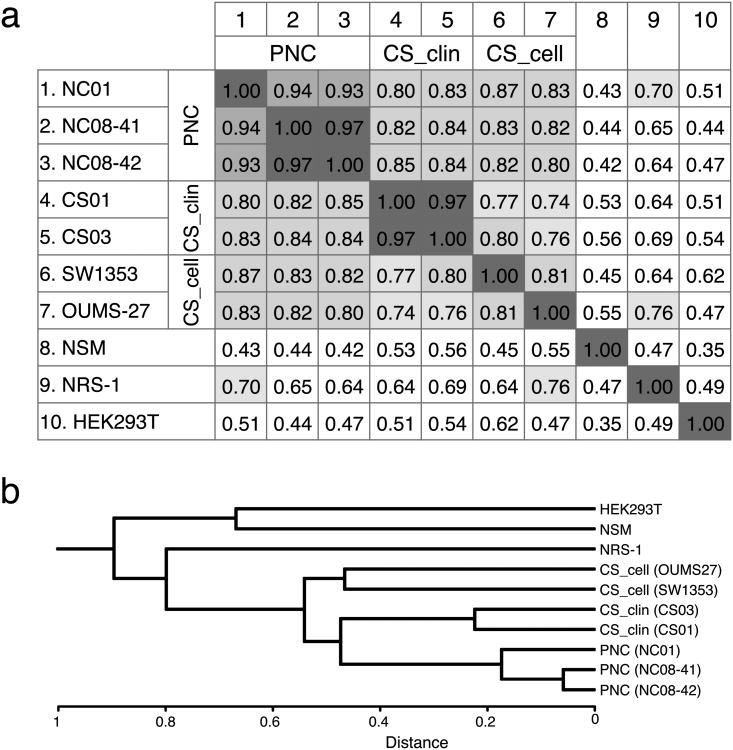
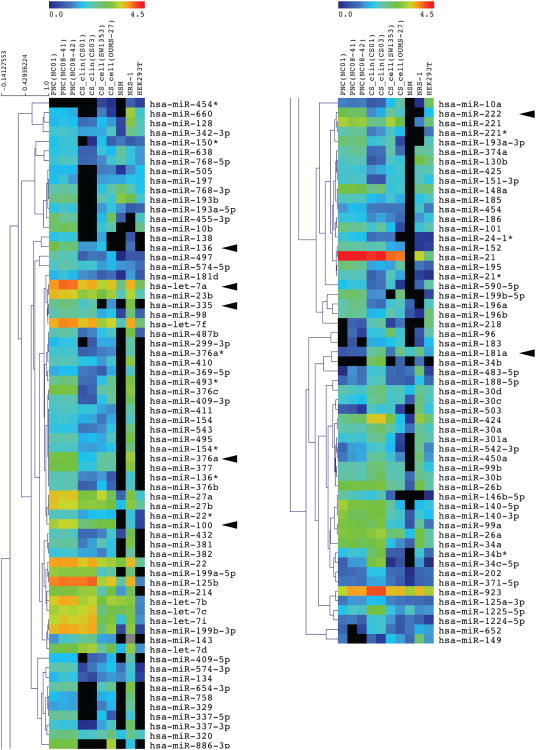
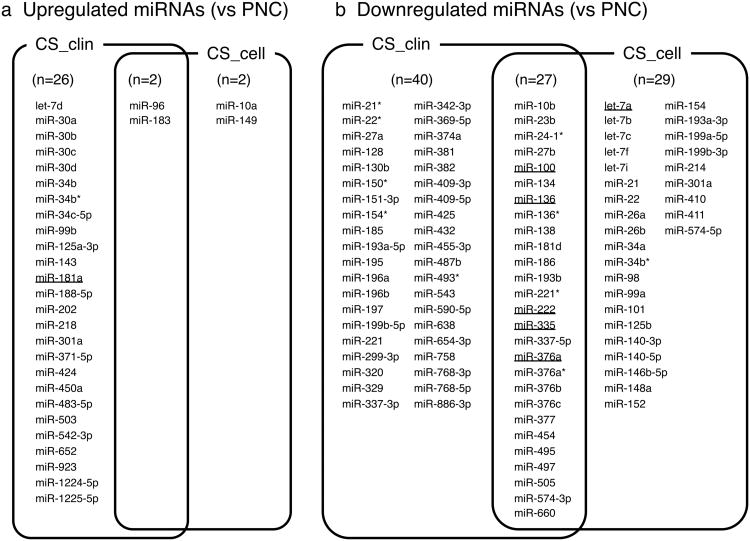
The samples for miRNA microarray assay included: 2 conventional chondrosarcomas (case no. CS01 and CS03, clinicopathological features including other chondrosarcoma patients in Table 1), SW1353 cells, and OUMS-27 cells, 3 PNC samples, NSM, NRS-1 cells, and HEK293T cells. All PNCs expressed articular chondrocyte marker COL2A1 mRNA and the semi quantitative ratios of COL2A1/COL1A1 were as follows: NC01, 1.47; NC08-41, 0.80; and NC08-42, 0.81, respectively (S- Fig. 1). The Hypertrophic chondrocyte marker COL10A1 was not detected in all primary articular chondrocytes. These data suggest that all PNCs kept hyaluronic cartilage status. Gene expression profiles of the above samples compared to PNC01 are shown as a scatter plots in S- Fig. 2. Overall miRNA expression profiles of primary chondrocytes and chondrogenic tumor samples were significantly different (S- Fig. 2). The correlation matrix (Fig. 1a) shows significant correlations within each sample group; i.e. PNC group for PNC01, PNC08-41, and PNC08-42; chondrosarcoma clinical samples (CS_clin) for CS01 and CS03; and chondrosarcoma cell lines (CS_cell) for SW1353, and OUMS-27. Hierarchical clustering of these samples using dendrogram (Fig. 1b) revealed that chondrosarcoma samples have a similar expression profile compared to other type of samples. To characterize differently expressed miRNAs between chondrosarcoma samples and PNC more accurately, we carried out supervised hierarchical clustering analysis using 117 probe sets, which were chosen with satisfactory criteria by ANOVA (Fig. 2). We further subdivided these 117 probe sets into 6 groups according to the expression profile focused on chondrosarcoma related samples compared with PNC (Fig. 3a, b and S- Table 1a, b). CS_clin showed 28 differently upregulated and 67 downregulated miRNAs vs PNC. CS_cell had 4 upregulated and 56 downregulated miRNAs. Among them, 2 and 27 miRNAs were differently upregulated and downregulated, respectively in both CS_clin and CS_cell. Commonly up-/down-regulated miRNAs in chondrosarcoma samples are: miR-96 and 183 as upregulated; miR-10b, 23b, 24-1*, 27b, 100, 134, 136, 136*, 138, 181d, 186, 193b, 221*, 222, 335, 337-5p, 376a, 376a*, 376b, 376c, 377, 454, 495, 497, 505, 574-3p, and 660 as downregulated.
Table 1. Clinicopathological Features of Conventional Chondrosarcoma Patients.
| Case No. | Age (y) Sex | Primary Site | Grade | Follow-up Status |
|---|---|---|---|---|
| CS01# | 33 M | Pelvis | 1 | NED |
| CS02 | 29 M | Scapula | 1 | NED |
| CS03# | 58 M | Pelvis | 1 | NED |
| CS04 | 29 F | Femur | 1 | NED |
| CS05 | 47 M | Scapula | 1 | NED |
| CS06 | 44 M | Pelvis | 1 | NED |
| CS07 | 57 M | Vertebra | 1 | NED |
| CS08 | 60 M | Hand | 1 | NED |
| CS09 | 67 M | Rib | 1 | Meta.(+) |
| CS10 | 61 M | Femur | 2 | AWD |
| CS11 | 86 M | Knee | 2 | NED |
| CS12 | 51 F | Rib | 2 | NED |
| CS13 | 55 M | Tibia | 2 | NED |
| CS14 | 65 M | Humerus | 2 | AWD |
| CS15 | 59 F | Pelvis | 2 | NED |
| CS16 | 66 M | Hand | 2 | AWD |
| CS17 | 86 F | Knee | 2 | NED |
| CS18 | 75 F | Femur | 2 | NED |
| CS19 | 63 F | Humerus | 3 | NED |
| CS20 | 59 M | Pelvis | 3 | DOD |
indicates the cases whose sample was applied to the miRNA array screening. NED = no evidence of disease; Meta.
= with metastasis at the final assessment; AWD = alive with disease; DOD = dead of disease.
Figure 1.
Correlations between samples on the miRNA arrays. (a) Correlation matrix for log-intensity among samples. (b) Hierarchical clustering of the arrays. The dendrogram shows the degree of similarity of miRNA expression pattern among samples. The chondrogenic samples, including both chondrosarcoma clinical samples and chondrosarcoma derived cell lines, showed a distinct expression pattern in miRNA from primary non-tumorous chondrocyte derived samples. CS_clin = chondrosarcoma clinical sample; CS_cell = chondrosarcoma derived cell line; PNC = primary non-tumorous articular chondrocytes.
Figure 2.
Expression pattern of the selected 117 miRNAs. The closed triangles show the miRNAs that were subjected to the further verification by quantitative real-time PCR.
Figure 3.
Differentially expressed miRNAs in chondrogenic samples. The expression levels of miRNAs in clinical chondrosarcoma samples and chondrosarcoma cell line samples were compared to primary non-tumorous articular chondrocytes. (a) The list of upregulated miRNAs in chondrosarcomas vs PNC (b) The list of downregulated miRNAs in chondrosarcomas vs PNC. The underlined miRNAs represent those used for verification by quantitative real-time PCR. CS_clin = chondrosarcoma clinical sample; CS_cell = chondrosarcoma derived cell line; PNC = primary non-tumorous articular chondrocytes.
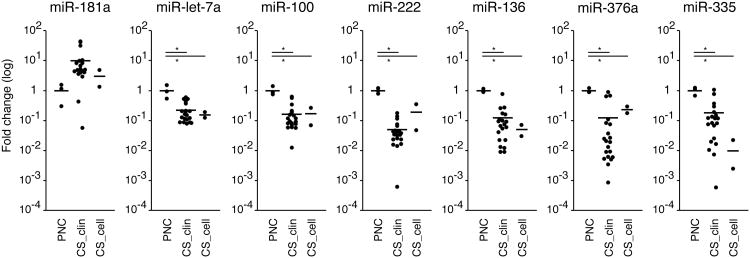
Next we validated the miRNA array data with some miRNAs differently expressed in CS_clin and/or CS_cell compared to PNC in a larger group of patients with chondrosarcoma by qPCR. Due to the limitation of total RNA quantity, we further examined the following miRNAs expression level by qPCR; miR-181a, let-7a, 100, 222, 136, 376a, and 335. MiR-181a was chosen because it is of interest as a rare upregulated miRNA and a potential regulator of, silent information regulator 1 (SIRT1). MiR-100, 222, 136, 376a, and 335 were included because they showed commonly decreased expressions in CS_clin and CS_cell. We also examined the expression of miR-let-7a, which was downregulated in chondrosarcoma samples, as a representative of let-7 group. In our miRNA array study, most of let-7 group miRNAs including let-7a, b, c and i were downregulated in CS_cell. In addition, the downregulation of let-7 group miRNAs has been reported in various other types of tumors. The results from qPCR experiments are shown in Fig. 4 (detailed qPCR data in S-Table 2). Overall results from qPCR had the same tendency as miRNA array data. The expression of miR-let-7a, 100, 222, 136, 376a and 335 were significantly decreased in both CS_cell and CS_clin samples vs PNC. Neither CS_cell nor CS_clin samples showed significant differences compared to PNC concerning the expression of miR-181a, though CS_clin samples had an increased expression pattern vs PNC.
Figure 4.
Expression of miRNAs in chondrosarcoma clinical samples in quantitative real-time PCR assay. All data are given as fold change expression levels compared to PNC. The expression level of each miRNA was normalized to RNU6B as an internal control. CS_clin = chondrosarcoma clinical sample; CS_cell = chondrosarcoma derived cell line; PNC = primary non-tumorous articular chondrocytes. The bar represents the mean. *p < .05 by ANOVA and pairwise t-test with Bonferroni's correction.
Discussion
Using the PNC as controls, the miRNA profiling analysis of CS samples has been performed and we found that some specific miRNAs expressions are different between CS and PMC (Fig. 1 and S-Fig. 2).
A total of 106 miRNAs were downregulated in either CS_clin or CS_cell compared to PNC, and 27 miRNAs were commonly downregulated in the array study. Further validation by qPCR analysis with expanded sample size proved the significant downregulation of miR-let-7a, 100, 222, 136, 376a, and 335 in CS_clin or CS_cell (Table 1). MiR-96 and -183 were upregulated in chondrosarcoma samples (Fig. 3, Table 2). Down regulation of these miRNA expression has also been observed in other solid tumors.7 MiR-34 and miR-181a members have been reported to target SIRT1 and control cell survival under various stress condition.8,9 In our array study, the expression of miR-34b, 34c-5p and 181a were differently upregulated in CS_clin compared to PNC. These miRNAs may contribute to protecting host cells from tumor progression.
Table 2. Differentially Expressed miRNAs and Characteristcs.
| Expression (CS vs PNC) | |||
|---|---|---|---|
|
|
|||
| miRNAs | Chromosome Locations | Array | qPCR |
| miR-181a | 1q32.1, 9q33.3 | Up | Not significant |
| miR-let7a | 9q22.3, 11q24.1, 22q13.31 | Down | Down |
| miR-100 | 11q24.1 | Down | Down |
| miR-222 | Xp11.3 | Down | Down |
| miR-136 | 14q32.2 | Down | Down |
| miR-376a | 14q32.31, 14q32.31 | Down | Down |
| miR-335 | 7q32.2 | Down | Down |
|
| |||
| Target Genes (Reported) | Functions | references | |
|
| |||
| SIRT1 | cell survival, defense against oxidative stress | 8, 9 | |
| Ras, HMGA2 | carcinogenesis | 10, 11 | |
| Myc | carcinogenesis | 12 | |
| PTEN | carcinogenesis | 13 | |
| Rb1, Versican | carcinogenesis | 14, 15 | |
| PIK3R1 | cell proliferation | 14, 18 | |
| SOX4, TNC | tumor metastasis | 19 | |
MiR-let-7 group (let-7s) is one of the most intensively studied miRNAs in carcinogenesis, generally functioning as tumor suppressors, and down regulated in various tumors. Let-7s directly target oncogenic genes Ras and HMGA2, and their loss of expression can lead to oncogenic transformation.10,11 In the current study, chondrosarcoma derived samples (CS_clin and CS_cell) also showed downregulation of let-7s compared to PNC. In addition, miR-100, let-7a-2 and miR-125b-1 form one gene cluster, and this cluster has been reported to exert antagonistic effects on cell proliferation and carcinogenesis by regulating Myc activity.12 In both miRNA array and qPCR experiments, miR-100 expression was shown to be downregulated in chondrosarcoma samples (CS_clin and CS_cell). Downregulation of let-7s and miR-100 would play a distinct role in tumor progression in chondrosarcoma. MiR-221/222 has been reported to target tumor suppressor gene PTEN and enhance carcinogenesis by activating the AKT/PKB signaling pathway in lung and liver cancers.13 Liu et al. found miR-136, 376a, and 31 were overexpressed in murine and human lung cancers.14 Lee et al. have shown that miR-136, 199a-3p, and 144 function as regulators of Rb1 and the versican-PTEN pathway.15 Versican is a relatively minor extracellular matrix protein in mature cartilage, but is highly expressed in chondrocyte lineage progenitor cells,16,17 suggesting a role maintaining the immature status of chondrocyte lineage cells. Decreased expression of miRNA-376a has been reported to induce cell proliferation in hepatocellular carcinoma cell lines by targeting PKI3R1.18 It has been reported that decreased expression of miR-335 is functionally associated with poor distal metastasis-free survival in breast cancer, and miR-335 inhibits metastasis in breast cancer by targeting SOX4 and TNC.19 The decreased expressions of miR-222, 136, 376a, and 335 would also play a specific role in malignant chondrogenic carcinogenesis.
It has been demonstrated that chromosomal amplification of 8q24,20 12p11, 12p13, and 12q13 loci21 and a loss of 8q24,22 and 11p11 locus22 are associated with chondrosarcoma. Some miRNAs are located in these genomic regions, namely has-miR-5692a-2, 3926-1, and 3926-2 in 8q24; miR-613, 614, 141, 1244-3, 3649 and 200c in 12p13; miR-4698, 4494, 1291, 4701, 1293, 196a-2, 615, 3198-2, 148b, 1228, and 616 in 12q13, respectively. Dysregulation of miRNAs’ expressions, whichever they are up- or down-regulated, may disorganize the homeostasis in normal chondrocytes and contribute to the malignant transformation. Further study with larger sized probe sets may elucidate the closer relationship between miRNAs and chromosomal abnormalities in chondrosarcoma.
It has been proposed that miRNA profiling in cancer could be used not only as diagnostic or prognostic indicator23, but also as therapeutic target for cancer therapy.24 The information about miRNA profiling in the current study may provide a basis for future chondrosarcoma diagnosis and therapy.
Supplementary Material
Acknowledgments
This study was partly supported by NIH AR050631, AR056120, AG007996, Health and Labour Sciences Research Grants, Grants-in Aid for Scientific Research (MEXT) and JST, CREST. We would like to thank Hirohito Shimizu, Satoshi Yamashita, Atsushi Inoue, and Yoriko Takahashi for technical assistance and helpful discussions.
Footnotes
Conflict of Interest Statement: There is no conflict of interest in the current study.
References
- 1.Chang TC, Mendell JT. microRNAs in vertebrate physiology and human disease. Annu Rev Genomics Hum Genet. 2007;8:215–239. doi: 10.1146/annurev.genom.8.080706.092351. [DOI] [PubMed] [Google Scholar]
- 2.Rozeman LB, Cleton-Jansen AM, Hogendoorn PC. Pathology of primary malignant bone and cartilage tumours. Int Orthop. 2006;30:437–444. doi: 10.1007/s00264-006-0212-x. [DOI] [PMC free article] [PubMed] [Google Scholar]
- 3.Wolf RE, Enneking WF. The staging and surgery of musculoskeletal neoplasms. Orthop Clin North Am. 1996;27:473–481. [PubMed] [Google Scholar]
- 4.Blanco FJ, Ochs RL, Schwarz H, Lotz M. Chondrocyte apoptosis induced by nitric oxide. Am J Pathol. 1995;146:75–85. [PMC free article] [PubMed] [Google Scholar]
- 5.Sharov AA, Dudekula DB, Ko MS. A web-based tool for principal component and significance analysis of microarray data. Bioinformatics. 2005;21:2548–2549. doi: 10.1093/bioinformatics/bti343. [DOI] [PubMed] [Google Scholar]
- 6.Saeed AI, Sharov V, White J, et al. TM4: a free, open-source system for microarray data management and analysis. Biotechniques. 2003;34:374–378. doi: 10.2144/03342mt01. [DOI] [PubMed] [Google Scholar]
- 7.Lu J, Getz G, Miska EA, et al. MicroRNA expression profiles classify human cancers. Nature. 2005;435:834–838. doi: 10.1038/nature03702. [DOI] [PubMed] [Google Scholar]
- 8.Saunders LR, Sharma AD, Tawney J, et al. miRNAs regulate SIRT1 expression during mouse embryonic stem cell differentiation and in adult mouse tissues. Aging (Albany NY) 2010;2:415–431. doi: 10.18632/aging.100176. [DOI] [PMC free article] [PubMed] [Google Scholar]
- 9.Yamakuchi M, Ferlito M, Lowenstein CJ. miR-34a repression of SIRT1 regulates apoptosis. Proc Natl Acad Sci U S A. 2008;105:13421–13426. doi: 10.1073/pnas.0801613105. [DOI] [PMC free article] [PubMed] [Google Scholar]
- 10.Johnson SM, Grosshans H, Shingara J, et al. RAS is regulated by the let-7 microRNA family. Cell. 2005;120:635–647. doi: 10.1016/j.cell.2005.01.014. [DOI] [PubMed] [Google Scholar]
- 11.Mayr C, Hemann MT, Bartel DP. Disrupting the pairing between let-7 and Hmga2 enhances oncogenic transformation. Science. 2007;315:1576–1579. doi: 10.1126/science.1137999. [DOI] [PMC free article] [PubMed] [Google Scholar]
- 12.Cairo S, Wang Y, de Reynies A, et al. Stem cell-like micro-RNA signature driven by Myc in aggressive liver cancer. Proc Natl Acad Sci U S A. 2010;107:20471–20476. doi: 10.1073/pnas.1009009107. [DOI] [PMC free article] [PubMed] [Google Scholar]
- 13.Garofalo M, Di Leva G, Romano G, et al. miR-221&222 regulate TRAIL resistance and enhance tumorigenicity through PTEN and TIMP3 downregulation. Cancer Cell. 2009;16:498–509. doi: 10.1016/j.ccr.2009.10.014. [DOI] [PMC free article] [PubMed] [Google Scholar] [Retracted]
- 14.Liu X, Sempere LF, Ouyang H, et al. MicroRNA-31 functions as an oncogenic microRNA in mouse and human lung cancer cells by repressing specific tumor suppressors. J Clin Invest. 2010;120:1298–1309. doi: 10.1172/JCI39566. [DOI] [PMC free article] [PubMed] [Google Scholar]
- 15.Lee DY, Jeyapalan Z, Fang L, et al. Expression of versican 3′-untranslated region modulates endogenous microRNA functions. PLoS One. 2010;5:e13599. doi: 10.1371/journal.pone.0013599. [DOI] [PMC free article] [PubMed] [Google Scholar]
- 16.Barry F, Boynton RE, Liu B, Murphy JM. Chondrogenic differentiation of mesenchymal stem cells from bone marrow: differentiation-dependent gene expression of matrix components. Exp Cell Res. 2001;268:189–200. doi: 10.1006/excr.2001.5278. [DOI] [PubMed] [Google Scholar]
- 17.Kamiya N, Watanabe H, Habuchi H, et al. Versican/PG-M regulates chondrogenesis as an extracellular matrix molecule crucial for mesenchymal condensation. J Biol Chem. 2006;281:2390–2400. doi: 10.1074/jbc.M509341200. [DOI] [PubMed] [Google Scholar]
- 18.Zheng Y, Yin L, Chen H, et al. miR-376a suppresses proliferation and induces apoptosis in hepatocellular carcinoma. FEBS Lett. 2012;586:2396–2403. doi: 10.1016/j.febslet.2012.05.054. [DOI] [PubMed] [Google Scholar]
- 19.Tavazoie SF, Alarcon C, Oskarsson T, et al. Endogenous human microRNAs that suppress breast cancer metastasis. Nature. 2008;451:147–152. doi: 10.1038/nature06487. [DOI] [PMC free article] [PubMed] [Google Scholar]
- 20.Morrison C, Radmacher M, Mohammed N, et al. MYC amplification and polysomy 8 in chondrosarcoma: array comparative genomic hybridization, fluorescent in situ hybridization, and association with outcome. J Clin Oncol. 2005;23:9369–9376. doi: 10.1200/JCO.2005.03.7127. [DOI] [PubMed] [Google Scholar]
- 21.Rozeman LB, Szuhai K, Schrage YM, et al. Array-comparative genomic hybridization of central chondrosarcoma: identification of ribosomal protein S6 and cyclin-dependent kinase 4 as candidate target genes for genomic aberrations. Cancer. 2006;107:380–388. doi: 10.1002/cncr.22001. [DOI] [PubMed] [Google Scholar]
- 22.Hecht JT, Hogue D, Strong LC, et al. Hereditary multiple exostosis and chondrosarcoma: linkage to chromosome II and loss of heterozygosity for EXT-linked markers on chromosomes II and 8. Am J Hum Genet. 1995;56:1125–1131. [PMC free article] [PubMed] [Google Scholar]
- 23.Calin GA, Croce CM. MicroRNA signatures in human cancers. Nat Rev Cancer. 2006;6:857–866. doi: 10.1038/nrc1997. [DOI] [PubMed] [Google Scholar]
- 24.Erson AE, Petty EM. MicroRNAs in development and disease. Clin Genet. 2008;74:296–306. doi: 10.1111/j.1399-0004.2008.01076.x. [DOI] [PubMed] [Google Scholar]
Associated Data
This section collects any data citations, data availability statements, or supplementary materials included in this article.


