

Abstract
Background
Vascular calcification is a common feature in patients with chronic kidney disease (CKD). CKD increases serum levels of tumor necrosis factor‐α (TNFα), a critical mediator of vascular calcification. However, the molecular mechanism by which TNFα promotes CKD‐dependent vascular calcification remains obscure. The purpose of the present study was to investigate whether TNFα‐induced vascular calcification in CKD is caused by the endoplasmic reticulum response involving protein kinase RNA‐like endoplasmic reticulum kinase (PERK), eukaryotic initiation factor 2α (eIF2α), activating transcription factor 4 (ATF4), and C/EBP homologous protein (CHOP).
Methods and Results
We examined the effects of TNFα on the endoplasmic reticulum (ER) stress response of vascular smooth muscle cells (VSMCs). TNFα treatment drastically induced the PERK‐eIF2α‐ATF4‐CHOP axis of the ER stress response in VSMCs. PERK, ATF4, and CHOP shRNA‐mediated knockdowns drastically inhibited mineralization and osteogenesis of VSMCs induced by TNFα. CKD induced by 5/6 nephrectomies activated the PERK‐eIF2α‐ATF4‐CHOP axis of the ER stress response in the aortas of ApoE−/− mice with increased aortic TNFα expression and vascular calcification. Treatment of 5/6 nephrectomized ApoE−/− mice with the TNFα neutralizing antibody or chemical Chaperones reduced aortic PERK‐eIF2α‐ATF4‐CHOP signaling of the ER stress increased by CKD. This resulted in the inhibition of CKD‐dependent vascular calcification.
Conclusions
These results suggest that TNFα induces the PERK‐eIF2α‐ATF4‐CHOP axis of the ER stress response, leading to CKD‐dependent vascular calcification.
Keywords: ATF4, CHOP, endoplasmic reticulum stress, TNFα, vascular calcification
Introduction
Cardiovascular diseases, such as vascular calcification, are the major cause of morbidity and mortality in patients with chronic kidney disease (CKD).1–2 CKD is represented by states of low‐grade chronic inflammation characterized by increased levels of inflammatory markers such as tumor necrosis factor‐α (TNFα).3–5 Several clinical studies show that CKD patients have significantly higher serum TNFα levels,6–8 implying that TNFα may play an important role in the pathogenesis of vascular calcification in CKD.
TNFα is a pleiotropic cytokine produced by many different types of cells in the body. Previous studies have shown that TNFα signaling participates in vascular calcification.9–11 Tintut and Demer first reported that TNFα induced mineralization and osteogenic differentiation of bovine calcifying vascular cells through a phosphate kinase A (PKA)‐dependent mechanism.10 Later, Towler's group reported that (1) low‐density lipoprotein receptor (LDLR)‐deficient (−/−) diabetic mice had increased serum TNFα levels, resulting in vascular calcification, and (2) treatment of LDLR−/− diabetic mice with infliximab, a TNFα monoclonal antibody, reduced the extent of vascular calcification.11 However, the precise molecular mechanism by which TNFα promotes CKD‐dependent vascular calcification remains unclear.
The endoplasmic reticulum (ER) is a major signal transducing organelle that senses and responds to changes in homeostasis. ER stress is caused by disturbances in the structure and function of the ER, accumulated by misfolded proteins and altered calcium homeostasis.12–14 In response to ER stress, the unfolded protein response (UPR) is initiated by the activation of 3 molecules: PKR‐like ER kinase (PERK), inositol‐requiring enzyme 1 (IRE1), and activating transcription factor 6 (ATF6). PERK activation leads to phosphorylation of the α subunit of eukaryotic initiation factor 2 (eIF2α), which inhibits protein synthesis.12–14 In contrast to most proteins, activating transcription factor 4 (ATF4) is not affected by the translational attenuation of eIF2α phosphorylation. Phosphorylation leads to the induction of C/EBP‐homologous protein (CHOP), which promotes ER stress–induced apoptosis.15 ATF4 is a pivotal transcription factor that mediates not only ER stress but also osteoblastic differentiation‐related genes such as osteocalcin and osterix.16–17 ATF4 is regulated through posttranslational phosphorylation by ribosomal S6 kinase 2 (RSK2) and PKA.17–18 To increase the transcriptional activity of ATF4, RSK2 and PKA phosphorylate ATF4 at Ser251 and Ser254, respectively. Recent reports from our group and others suggest that the ER stress caused by saturated fatty acids and BMP‐2 induces ER stress, leading to the development of vascular calcification.19–20 We previously reported that stearate treatment leads to ATF4 activation through ER stress, resulting in mineralization and osteogenic differentiation.19 We therefore hypothesize that TNFα also induces vascular calcification by activating the PERK‐eIF1α‐ATF4‐CHOP branch of the ER stress signaling pathway.
In this study, we evaluate the following 5 points: whether (1) TNFα induces ER stress in VSMCs, (2) TNFα induces the phosphorylation of ATF4 by PKA and RSK2, resulting in the induction of mineralization and osteoblast differentiation of VSMCs, (3) the PERK‐eIF2α‐ATF4‐CHOP branch contributes to vascular calcification induced by TNFα, (4) CKD induces aortic TNFα, ATF4, and CHOP expression, and (5) inhibition of TNFα attenuates CKD‐dependent vascular calcification in ApoE−/− mice with 5/6 nephrectomies by reducing aortic PERK‐eIF2α‐ATF4‐CHOP signaling of the ER stress response.
Methods
Cell Culture Studies
MOVAS‐1 cells were kindly provided by Dr Mansoor Husain at the University of Toronto. Calcifying vascular cells were kindly provided by Drs Yin Tintut and Linda Demer at the University of California, Los Angeles. These cells were cultured in DMEM containing phosphate 1 to 3 mmol/L, 10% FBS, and TNFα 1 to 10 ng/mL.10,21–22 The medium was changed every 2 to 3 days. All cell culture experiments were performed independently at least 2 times.
Animal Studies
Eight‐week‐old male ApoE−/− mice (C57Bl6/J background) were purchased from the Jackson Laboratory and subjected to either 5/6 nephrectomy or sham operation. These operations were performed as we previously described.23 Animals were fed a high‐fat/high‐cholesterol diet (TD10364; Harlan Teklad) after the operations. Treatment groups consisted of 6 to 17 animals each. Animals were given intraperitoneal injections of the TNFα‐neutralizing antibody infliximab (Janssen, 10 mg/kg) 3 times weekly for 10 weeks. A dose of sodium 4‐phenylbutyric acid (4‐PBA, 250 mg/kg) or tauroursodeoxycholic acid (TUDCA, 250 mg/kg) was injected intraperitoneally once daily for 8 weeks. Animal experiments were approved by the Institutional Animal Care and Research Advisory Committee of the University of Colorado at Denver.
Histological Analysis
Calcified lesions of the aortic valve were analyzed as we previously described.23–24 The upper portions of the heart and proximal aorta were obtained, embedded in OCT compound, and stored at −80°C. Ten‐micrometer sections were analyzed for a distance of 800 μm. Sections were stained with von Kossa. The calcified areas on 25 sections were determined in a blinded fashion by the use of light microscopy. For each section, the mean value of lesion area of aortic wall per section was calculated.
Calcium Content in Cultured Cells
Calcium deposition in the plates was quantified as previously described.19,25 Cells were decalcified using an HCl 0.6 mol/L solution. After collection of the supernatant, the cells were washed with PBS and solubilized with an NaOH 0.1 N/SDS 0.1% solution for protein quantification. Calcium content was quantified calorimetrically using the o‐cresolphthalein method. Protein content was measured using a BCA protein assay kit.
RNA Analysis
Total RNA was isolated using TRI Reagent (Molecular Research Center Inc) in conjunction with an RNeasy kit (Qiagen). Real‐time quantitative PCR assays were performed using an Applied Biosystems StepOne qPCR instrument as we previously described.19 Using the Ct (cycle threshold) method, quantification of gene expression was calculated as the mRNA level normalized to a ribosomal housekeeping gene (18S or 36B4). Primer sequences are available on request. The spliced form of X‐box binding protein‐1 (XBP‐1) was analyzed by RT‐PCR coupled with PstI digestion, as described previously.19,26
Generation of ATF4‐Knockdown, PERK‐Knockdown, CHOP‐Knockdown, and CHOP‐Overexpressed MOVAS‐1 Cells
ATF4‐knockdown and PERK‐knockdown MOVAS‐1 cells were generated as we previously described.19 For CHOP‐knockdown and ‐overexpressed cells, MOVAS‐1 cells were infected with recombinant lentiviruses containing 4 different CHOP shRNAs (Open Biosystems Clone IDs: V2LMM_3897, V2LMM_16424, V2LMM_45204, V2LMM_45208) or mouse CHOP cDNA. Colonies were selected by treatment with puromycin 5 μg/mL for 7 days. A single colony was isolated from MOVAS‐1 cells infected with each lentivirus. MOVAS‐1 cells treated with CHOP shRNA (V2LMM_16424) which most strongly reduced CHOP expression, were used as CHOP‐knockdown VSMCs.
Adenoviral Transduction for MOVAS‐1 Cells
MOVAS‐1 cells were infected with recombinant adenoviruses at a multiplicity of infection (MOI) of 40. An adenovirus expressing wild‐type ATF4 and an ATF4 mutant with Ser251Ala and Ser254Ala was generated using the ViraPower Adenovirus Expression System (Invitrogen). MOVAS‐1 cells were infected with the adenovirus in DMEM with 10% FBS. After 6 hours, the infected cells were treated with fresh media for 7 days.
Inorganic Phosphate Uptake Measurement
Sodium‐dependent uptake of phosphate was measured in MOVAS‐1 cells grown to confluency on plastic dishes (12 wells). Uptake solution (400 μL) consisted of (in mmol/L) NaCl 137, KCl 5.4, CaCl2 2.8, MgSO4 1.2, HEPES/Tris 10, pH 7.4, and KH232PO4 0.1. Routine uptake was performed at room temperature for 4 minutes and then stopped by washing the cells 3 times with cold stop solution (NaCl 137 mmol/L, Tris/HCl 10 mmol/L, pH 7.2). Cells were solubilized with NaOH 0.1 N, and the signals of 32P were counted by using liquid scintillation. Protein content was determined with a BCA assay kit (Pierce).27
Western Blotting
Cell and tissue lysates were prepared using RIPA buffer (Cell Signaling). The samples were separated by SDS‐PAGE, transferred to a nitrocellulose membrane, and immunoblotted with the following antibodies: ATF4 (Santa Cruz Biotechnology), CHOP (Santa Cruz Biotechnology), GAPDH (Santa Cruz Biotechnology), p‐CREB (Cell Signaling), p‐ERK (Cell Signaling), p‐RSK2 (Cell Signaling), PERK (Cell Signaling), p‐PERK (Cell Signaling), p‐eIF2α (Cell Signaling), and phospho‐serine (Millipore). Nuclear extracts were isolated using a nuclear extract kit (Active Motif) as previously described.23 Samples were visualized using horseradish peroxidase coupled to an antimouse secondary antibody, with enhancement from an ECL detection kit.
Statistical Analysis
Data were collected from >2 independent experiments and were reported as the mean±SE. Statistical analysis for 2‐group comparison was performed using the Student t test or 1‐way ANOVA with a Student‐Newman post hoc test for multigroup comparison. Statistical analysis of the survival time data was performed by the log‐rank and nonparametric Wilcoxon signed rank method using the computer program JMP 3.0 (StatisticMade Visual; SAS Institute). Significance was accepted at P<0.05.
Results
TNFα Induces ATF4 Expression and/or Phosphorylation in VSMCs Accompanied by the Induction of Mineralization and Osteoblastic Differentiation
First, we determined whether TNFα contributes to vascular calcification and osteoblast differentiation of calcifying vascular cells.10 In the mouse VSMC line MOVAS‐1, we found that TNFα treatment significantly increased calcium content and alkaline phosphatase (ALP) activity, consistent with previous studies (Figure 1A and 1B).10 Recently, we reported that stearate induces ATF4 activation and contributes to vascular calcification.19 To determine whether TNFα likewise induces and activates ATF4, the expression and phosphorylation of ATF were analyzed by immunoblotting. Both p‐ATF4 and total ATF4 protein expressions were increased after 1 hour of the treatment with TNFα 10 ng/mL (Figure 1C). TNFα treatment also increased the levels of phosphorylated RSK2 (p‐RSK2) and p‐CREB, which are protein kinases that phosphorylate ATF4.
Figure 1.

TNFα induces ATF4 expression and/or phosphorylation in MOVAS‐1 cells. A, Mineralization and B, ALP activity of MOVAS‐1 cells treated with TNFα (10 ng/mL) for 7 days. C, MOVAS‐1 cells were treated with TNFα (10 ng/mL). The time course of phosphorylated ATF4 (p‐ATF4), total ATF4 (ATF4), phosphorylated RSK2 (p‐RSK2), phosphorylated PERK (p‐PERK), phosphorylated eIF2α (p‐eIF2α), and phosphorylated CREB (p‐CREB) protein were detected by immunoblot analysis with specific antibodies. GAPDH was used as a loading control. D, Dose‐dependent effect of TNFα. MOVAS‐1 cells were treated with different concentrations of TNFα: 0.5 hour for p‐ATF4, 3 hours for ATF4 expression, and 16 hours for CHOP expression. E, TNFα dose‐dependently increases nuclear p‐ATF4 and total ATF4. Histone H3 was used as a loading control. F, Time‐dependent effect of RT‐PCR analysis of XBP‐1 in MOVAS‐1 cells treated with TNFα. The upper band is the expression of unspliced forms of XBP‐1 mRNA (uXBP‐1) and the lower is the expression of spliced forms of XBP‐1 mRNA (sXBP‐1). ***P<0.001. ALP indicates alkaline phosphatase; ATF4, activating transcription factor 4; CHOP, C/EBP homologous protein; CREB, cAMP response element‐binding protein; eIF2α, eukaryotic initiation factor 2α; GAPDH, glyceraldehyde 3‐phosphate dehydrogenase; MOVAS‐1, mouse aorta‐derived immortalized vascular smooth muscle cell line‐1; PCR, polymerase chain reaction; PERK, protein kinase RNA‐like endoplasmic reticulum kinase; RSK2, ribosomal S6 kinase 2; RT, reverse transcriptase; TNFα, tumor necrosis factor‐α; XBP, X‐box binding protein‐1.
Next, we also examined whether this TNFα induction of ATF4 expression occurs through the PERK‐eIF2α signaling branch of the UPR. TNFα treatment transiently induced phosphorylation of PERK (p‐PERK) and eIF2α (p‐eIF2α) protein expression with maximum induction at 30 minutes (Figure 1C). The expression of CHOP mRNA increased in MOVAS‐1 cells treated with TNFα at 24 to 48 hours (data not shown). The effects of TNFα on CHOP expression, ATF4 expression, and ATF4 phosphorylation were dose dependent (Figure 1D). Nuclear p‐ATF4 and total ATF4 protein levels also increased in a dose‐dependent manner in response to TNFα treatment (Figure 1E). TNFα treatment caused a 3.7‐fold increase in the mRNA levels of the spliced form of XBP‐1 (sXBP‐1), another common marker of ER stress (Figure 1F). We also confirmed that TNFα induced ER stress in bovine calcifying vascular cells (Figure S1) similar to MOVAS‐1 cells. These data suggest that TNFα activates ATF4 though the ER stress response.
Since TNFα has been shown to induce vascular calcification through a PKA‐dependent pathway and ATF4 has a PKA‐dependent phosphorylation site,10,18 we tested whether PKA activation increases phosphorylated ATF4 (p‐ATF4). VSMCs were treated with 10 μmol/L of PKA activator forskolin (Fsk). In addition to inducing mineralization and ALP activity, Fsk treatment increased p‐ATF4 protein levels without affecting total ATF4 protein levels (data not shown). Phosphorylated CREB (p‐CREB) protein levels increased in response to Fsk treatment, as expected. In our time‐course experiments, the phosphorylation of ATF4 quickly and transiently increased with Fsk treatment (data not shown). Levels of p‐ATF4 were maximally increased by 2.2‐fold after 30 minutes of treatment.
To define which kinases activate ATF4 and mediate TNFα regulation of vascular calcification, VSMCs were pretreated with several protein kinase inhibitors (PKA inhibitor H89, MEK inhibitor U0129, RSK inhibitor SL0101‐01, p38MAP kinase inhibitor SB203580, and JNK inhibitor SP600125). Consistent with previous reports,10,28 the 1‐hour pretreatment of H89, U0129, or SL0101‐01 inhibited mineralization of VSMCs induced by TNFα treatment. Dual treatment with H89 and SL0101‐01 inhibited TNFα‐induced mineralization. SB203580 and SP600125 augmented vascular calcification induced by TNFα treatment (Figure 2A). Combined treatment with H89 and SL0101‐01 most strongly inhibited TNFα‐induced mineralization (Figure 2C). Next we examined whether H89, U0129, and SL0101‐01 block ATF4 phosphorylation induced by TNFα treatment. Increased p‐ATF4 from TNFα treatment was attenuated in cells pretreated with H89, U0129, or SL0101‐01 by 63% (P<0.01), 41% (P<0.01), and 58% (P<0.01), respectively (Figure 2B and 2D). Co‐treatment with H89 and SL0101‐01 further reduced protein levels of p‐ATF4 and CHOP induced by TNFα. As expected, pretreatment with H89 completely reduced levels of p‐CREB induced by TNFα, whereas U0129 treatment reduced both p‐ERK and p‐RSK2 levels (Figure 2B).
Figure 2.

PKA and MEK‐ERK‐PSK2 pathways mediate the phosphorylations of ATF4 in MOVAS‐1 cells. A and B, Mineralization of MOVAS‐1 cells treated with TNFα (10 ng/mL) for 7 days in the presence of various kinase inhibitors H89 (PKA inhibitor, 10 μmol/L), U0129 (MEK inhibitor, 10 μmol/L), SB203580 (P38MAPK inhibitor, 10 μmol/L), SP600125 (JNK inhibitor, 10 μmol/L), and SL0101‐01 (RSK inhibitor 10 μmol/L). #P<0.01 vs no treatment. *P<0.01 vs TNFα treatment without kinase inhibitors. Six samples per group were analyzed. C and D, MOVAS‐1 cells were treated with TNFα (10 ng/mL) for 30 minutes in the presence of a 1 hour pretreatment of H89, U0129, and SL0101‐01. The expression of phosphorylated ATF4 (p‐ATF4), total ATF4 (ATF4), phosphorylated RSK2 (p‐RSK2), phosphorylated PERK (p‐PERK), phosphorylated CREB (p‐CREB), and CHOP protein were detected by immunoblot analysis with specific antibodies. Total CREB was used as a loading control. #P<0.01 vs no treatment. *P<0.01 vs TNFα treatment without kinase inhibitors. Six samples per group were analyzed. ALP indicates alkaline phosphatase; ATF4, activating transcription factor 4; CHOP, C/EBP homologous protein; eIF2α, eukaryotic initiation factor 2α; JNK, c‐jun N‐terminal kinase; MAPK, mitogen‐activated protein kinase; MEK, mitogen‐activated protein kinase; PERK, protein kinase RNA‐like endoplasmic reticulum kinase; PKA, protein kinase A; RSK2, ribosomal S6 kinase 2; TNFα, tumor necrosis factor‐α.
Knockdown of the PERK‐eIF2α‐ATF4‐CHOP Pathway Blocks Mineralization and Osteoblastic Differentiation Induced by TNFα in VSMCs
To confirm whether TNFα induces vascular calcification through the PERK‐eIF2α‐ATF4 pathway of UPR, we first treated PERK knockdown MOVAS‐1 cells with TNFα.21 PERK knockdown notably diminished mineralization, ALP activity, and downstream ER stress‐related proteins (p‐ATF4, total ATF4, and CHOP) induced by TNFα. As expected, PERK knockdown reduced protein levels of PERK and its downstream target, p‐eIF2α. TNFα‐induced sXBP‐1 expression was not affected, suggesting the IRE1α‐sXBP‐1 pathway of the ER stress response (Figure 3) was intact in the PERK knockdown cells.
Figure 3.
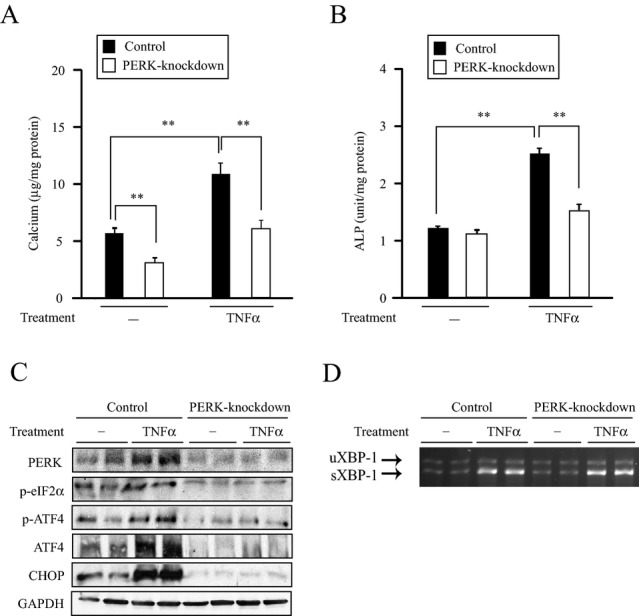
PERK knockdown alters mineralization and osteoblastic differentiation of MOVAS‐1 cells induced by TNFα. A, Mineralization and B, ALP activity of PERK knockdown MOVAS‐1 cells treated with TNFα (10 ng/mL) for 7 days. C, PERK, phosphorylated eIF2α (p‐eIF2α), phosphorylated ATF4 (p‐ATF4), total ATF4 (ATF4), and CHOP protein expression in PERK knockdown MOVAS‐1 cells treated with TNFα (30 minutes for p‐eIF2α and p‐ATF4 expression, 3 hours for ATF4 expression, and 16 hours for CHOP expression). D, RT‐PCR analysis of XBP‐1 in PERK knockdown MOVAS‐1 cells treated with TNFα for 16 hours. The upper band is the expression of uXBP‐1 and the lower is the expression of sXBP‐1. **P<0.01. ALP indicates alkaline phosphatase; ATF4, activating transcription factor 4; CHOP, C/EBP homologous protein; eIF2α, eukaryotic initiation factor 2α; PERK, protein kinase RNA‐like endoplasmic reticulum kinase; RSK2, ribosomal S6 kinase 2; TNFα, tumor necrosis factor‐α; XBP, X‐box binding protein‐1.
ATF4 knockdown significantly attenuated TNFα‐induced mineralization and ALP activity (Figure 4A and 4B), similar to stearate‐induced vascular calcification. ATF4 knockdown decreased p‐ATF4 and total ATF4 protein expression induced by TNFα treatment, resulting in the reduction of TNFα‐induced CHOP expression (Figure 4C). As expected, the induction of p‐eIF2α levels and sXBP‐1 levels by TNFα was not altered by ATF4 knockdown (Figure 4D). To confirm whether the phosphorylation of ATF4 by PKA and RSK2 is an important event in the mineralization of VSMCs, wild‐type ATF4 and the ATF4 double mutant (Ser251Ala and Ser254Ala) were overexpressed in MOVAS‐1 cells (Figure 4E). Overexpression of wild‐type ATF4 stimulated mineralization of VSMCs, whereas double mutations of both ATF4 phosphorylation sites significantly reduced the procalcific effect of ATF4 (Figure 4F). These data suggest that serine phosphorylations by PKA and RSK2 are important for the ATF4 activity. Consistent with the immunoblot analysis, qPCR analysis showed that ATF4 knockdown alleviated the expression of TNFα‐induced ER stress markers including CHOP, ATF3, asparagine synthetase (ASNS), growth arrest and DNA damage‐inducible 34 (GADD34), and glucose‐regulated protein 78 (GRP78). In addition, ATF4 knockdown rescued the expression of several osteogenic markers including sodium‐dependent phosphate transporter 1 (PiT1), osteocalcin (OCN), osteoprotegerin (OPG), Osterix, Runx2, and ALP (Table S1). Similarly, PERK knockdown reduced TNFα‐induced ER stress markers and osteogenic markers (Table S1).
Figure 4.

ATF4 knockdown alters mineralization and osteoblastic differentiation of MOVAS‐1 cells induced by TNFα. A, Mineralization and (B) ALP activity of ATF4 knockdown MOVAS‐1 cells treated with TNFα (10 ng/mL) for 7 days. C, Phosphorylated eIF2α (p‐eIF2α), phosphorylated ATF4 (p‐ATF4), total ATF4 (ATF4), and CHOP protein expression in ATF4 knockdown MOVAS‐1 cells treated with TNFα (30 minutes for p‐eIF2α and p‐ATF4 expression, 3 hours for ATF4 expression, and 16 hours for CHOP expression). D, RT‐PCR analysis of XBP‐1 in ATF4 knockdown MOVAS‐1 cells treated with TNFα for 16 hours. The upper band is the expression of uXBP‐1. The lower band is the expression of sXBP‐1. E, ATF4 mRNA expression in MOVAS‐1 cells treated with adenoviruses containing wild‐type ATF4 (Ad‐ATF4), ATF4 mutant with S251A, and S254A (Ad‐ATF4 mutant) or empty (Ad‐empty) at a MOI of 40 for 6 hours. ***P<0.001 vs wild‐type ATF4. Four samples per group were analyzed. F, Mineralization of VSMCs overexpressing ATF4 mutant. MOVAS‐1 cells were treated with either Ad‐ATF4, Ad‐ATF4 mutant or Ad‐empty for 6 hours and then incubated for 7 days. **P<0.01 and ***P<0.001 vs wild‐type ATF4. Four samples per group were analyzed. ALP indicates alkaline phosphatase; ATF4, activating transcription factor 4; CHOP, C/EBP homologous protein; eIF2α, eukaryotic initiation factor 2α; PCR, polymerase chain reaction; PERK, protein kinase RNA‐like endoplasmic reticulum kinase; RSK2, ribosomal S6 kinase 2; TNFα, tumor necrosis factor‐α; XBP, X‐box binding protein‐1.
Because CHOP is a major mediator of downstream signaling of ATF4, we next examined whether CHOP knockdown affects TNFα‐induced vascular calcification in MOVAS‐1 cells. Similar to ATF4 knockdown and PERK knockdown, CHOP knockdown diminished TNFα‐induced mineralization and ALP activity (Figure 5A, 5B and 5C). CHOP knockdown blocked CHOP protein levels elevated by TNFα but had no effect on the upstream components such as p‐ATF4, total ATF4, and p‐eIF2α increased by TNFα (Figure 5D). CHOP knockdown decreased mRNA expression of CHOP, GADD34, and osteogenic markers (PiT1, OCN, OPG, Osterix, Runx2, and ALP) induced by TNFα. However, ATF4, ATF3, GRP78, and ASNS mRNA levels did not change (Table S1). TNFα‐induced sXBP‐1 expression also did not change in CHOP knockdown MOVAS‐1 cells (Figure 5E). Because CHOP is a downstream target of the PERK‐eIF2α‐ATF4 axis, the expression of upstream components, including p‐eIF2α and ATF4, was not affected (Figure 5C).
Figure 5.

CHOP knockdown alters mineralization and osteoblastic differentiation of MOVAS‐1 cells induced by TNFα. A, Mineralization and B, alizarin staining and C, ALP activity of CHOP knockdown MOVAS‐1 cells treated with TNFα (10 ng/mL) for 7 days. D, Phosphorylated eIF2α (p‐eIF2α), phosphorylated ATF4 (p‐ATF4), total ATF4 (ATF4), and CHOP protein expression in CHOP knockdown MOVAS‐1 cells. Cells were treated with TNFα (30 minutes for p‐eIF2α and p‐ATF4 expression, 3 hours for ATF4 expression, and 16 hours for CHOP expression). E, RT‐PCR analysis of XBP‐1 in CHOP knockdown MOVAS‐1 cells treated with TNFα for 16 hours. The upper band is the expression of uXBP‐1 and the lower band is the expression of sXBP‐1. F, Western blot and RT‐PCR analyses of CHOP in CHOP overexpressing MOVAS‐1 cells. G, Mineralization of MOVAS‐1 cells overexpressing CHOP. CHOP‐overexpressed MOVAS‐1 cells were treated with either 1.0 mmol/L or 3.0 mmol/L phosphate for 7 days. H, Pit‐1 mRNA levels in CHOP‐overexpressed MOVAS‐1 cells. I, Inorganic phosphate (Pi) uptake in CHOP‐overexpressed MOVAS‐1 cells. **P<0.01. ALP indicates alkaline phosphatase; ATF4, activating transcription factor 4; CHOP, C/EBP homologous protein; eIF2α, eukaryotic initiation factor 2α; PERK, protein kinase RNA‐like endoplasmic reticulum kinase; Pit‐1, sodium‐dependent phosphate transporter 1; RSK2, ribosomal S6 kinase 2; TNFα, tumor necrosis factor‐α; XBP, X‐box binding protein‐1.
Finally, we determined whether CHOP overexpression induces vascular calcification. Calcium content increased by 3.7‐fold in MOVAS‐1 cells overexpressing CHOP compared with control MOVAS‐1 cells in both the absence and presence of TNFα (Figure 5G). To determine the mechanism by which CHOP induces vascular calcification, we analyzed phosphate uptake and PiT‐1 expression in MOVAS‐1 cells overexpressing CHOP. CHOP overexpression induced PiT‐1 expression, resulting in a significant increase in phosphate uptake of MOVAS‐1 cells (Figure 5I and 5H).
ATF4 Expression and Phosphorylation Increased in Murine Models of Atherosclerotic Calcification
To determine whether the PERK‐eIF2α‐ATF4‐CHOP signaling axis contributes to CKD‐dependent vascular calcification in vivo, we analyzed aortic protein expression of ATF4 and CHOP in 5/6 nephrectomized (nx) ApoE−/− mice.23,29 Nephrectomy increased serum creatinine, urea nitrogen, phosphorus, and cholesterol levels in ApoE−/− mice compared with sham‐operated mice (data not shown). Histological analysis with von Kossa staining revealed 2.8‐fold larger atherosclerotic calcified lesions in the aortic roots of 5/6 nx ApoE−/− mice compared with sham‐operated controls (Figure 6A). Aortic calcium content was 2.3‐fold higher in 5/6 nx ApoE−/− mice than in sham‐operated ApoE−/− mice (Figure 6B). To determine whether TNFα is involved in vascular calcification of this murine model, we analyzed aortic mRNA levels of TNFα. Analysis with qPCR revealed that CKD induced aortic TNFα mRNA expression by 3.3‐fold (Figure 6C). To determine whether ATF4 protein expression and phosphorylation increase in atherosclerotic vascular calcification, we performed immunoblot analyses of the aorta. Both p‐ATF4 and total ATF4 protein expressions increased in the aorta of 5/6 nx ApoE−/− mice by 3.4‐fold and 2.0‐fold, respectively, compared with sham‐operated ApoE−/− mice (Figure 6D, 6E and 6F). Aortic CHOP protein levels were also 2.4‐fold higher in 5/6 nx ApoE−/− mice (Figure 6D and 6G).
Figure 6.
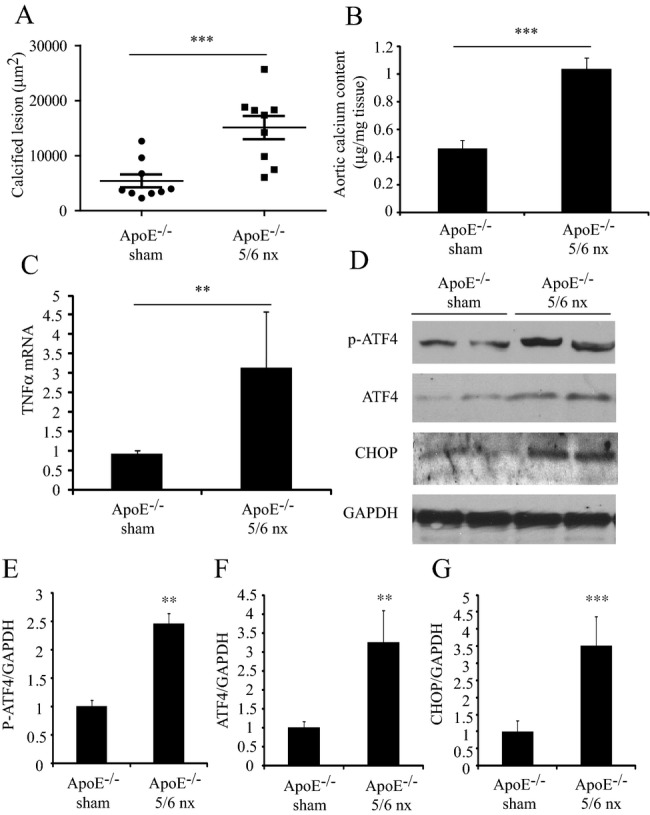
Increased phospho (p)‐ and total ATF4, and CHOP proteins in the aorta of 5/6 nephrectomized (nx) ApoE−/− mice. A and B, Calcified lesions and aortic calcium content in 5/6 nx or sham‐operated ApoE−/− mice fed a Western diet for 8 weeks. C, Aortic TNFα mRNA levels in 5/6 nx or sham‐operated ApoE−/− mice fed a Western diet for 8 weeks. D, Aortic (p)‐ and total ATF4, and CHOP protein expression in 5/6 nx or sham‐operated ApoE−/− mice fed a Western diet for 8 weeks. E through G, quantification of Western blot densitometry. ***P<0.001, **P<0.01. ALP indicates alkaline phosphatase; ApoE, apoprotein E; ATF4, activating transcription factor 4; CHOP, C/EBP homologous protein; eIF2α, eukaryotic initiation factor 2α; nx, nephrectomized; TNFα, tumor necrosis factor‐α.
Inhibition of TNFα reduces PERK‐ATF4‐CHOP Signaling, Resulting in a Significant Reduction of Vascular Calcification in ApoE−/− Mice
To confirm whether TNFα‐induced PERK‐eIF2α‐ATF4‐CHOP signaling contributes to CKD‐dependent vascular calcification, we treated 5/6 nx ApoE−/− mice with the TNFα inhibitor infliximab for 8 weeks. Infliximab treatment increased the survival rate of 5/6 nx ApoE−/− mice compared with vehicle treatment (Figure 7A). Levels of serum urea nitrogen, cholesterol, and phosphorus increased by CKD did not change by infliximab treatment (Table S2). Nephrectomy induced aortic calcified lesions by 4.1‐fold, which were completely attenuated by infliximab treatment (Figure 7B and 7C).
Figure 7.

TNFα inhibition inhibits CKD‐dependent vascular calcification by inhibiting aortic PERK‐eIF2α‐ATF4‐CHOP signaling. A, Survival rate of 5/6 nx ApoE−/− mice treated with either vehicle (saline) or 10 mg/kg infliximab. 17 animals per group were analyzed for survival analysis. B, Calcified area stained by von Kossa in aortic sinus of sham‐operated ApoE−/− mice (left), 5/6 nephrectomized ApoE−/− mice treated with vehicle (middle) or infliximab (right). Arrow indicates calcified lesion. C, Calcified lesions in 5/6 nx or sham‐operated ApoE−/− mice treated with either infliximab or vehicle for 10 weeks. ***P<0.001 vs sham‐operated ApoE−/− mice treated with vehicle. ###P<0.001 vs 5/6 nx ApoE−/− mice treated with vehicle. Six samples per group were analyzed. D, Aortic mRNA levels in 5/6 nx or sham‐operated ApoE−/− mice treated with either infliximab or vehicle for 10 weeks. *P<0.05 vs sham‐operated ApoE−/− mice treated with vehicle. #P<0.05 vs 5/6 nx ApoE−/− mice treated with vehicle. Six samples per group were analyzed. E, Aortic, p‐PERK, (p)‐ and total ATF4, and CHOP protein expression in 5/6 nx or sham‐operated ApoE−/− mice treated with either infliximab or vehicle. F, Immunohistochemical detection of CHOP in the aortic sinus of 5/6 nx ApoE−/− mice treated with either infliximab or vehicle. G, CHOP‐positive area in 5/6 nx or sham‐operated ApoE−/− mice treated with either infliximab or vehicle for 10 weeks. **P<0.01 vs sham‐operated ApoE−/− mice treated with vehicle. ##P<0.01 vs 5/6 nx ApoE−/− mice treated with vehicle. Six samples per group were analyzed. ALP indicates alkaline phosphatase; ApoE, apoprotein E; ATF4, activating transcription factor 4; CHOP, C/EBP homologous protein; nx, nephrectomized; OCN, osteocalcin; TNFα, tumor necrosis factor‐α.
To determine whether TNFα inhibition reduces aortic PERK‐eIF2α‐ATF4‐CHOP signaling of the ER stress induced by CKD, we performed qPCR, Western blot, and immunohistochemistry analyses. Infliximab treatment completely reduced CKD‐induced ATF4 and CHOP mRNA expression as well as the mRNA expression of their targets, ATF3 and GADD34 (Figure 7D). Western blot analysis confirmed that infliximab treatment reduced PERK‐ATF4‐CHOP signaling induced by CKD (Figure 7E). The mRNA levels of 2 osteogenic markers, ALP and osteopontin, were also reduced in the aortas of 5/6 nx ApoE−/− mice treated with infliximab (Figure 7D). Consistently, immunohistochemical analysis showed that infliximab treatment reduced aortic CHOP protein expression induced by CKD (Figure 7F and 7G).
Chemical Chaperones Ameliorate CKD‐Dependent Vascular Calcification and ER Stress
To obtain direct evidence that ER stress plays a causative role in CKD‐dependent vascular calcification, we treated 5/6 nx ApoE−/− mice with 2 chemical chaperones: 4‐PBA and TUDCA. These chemical chaperones are known to attenuate ER stress. Levels of serum urea nitrogen, cholesterol, and phosphorus increased by CKD did not change from 4‐PBA treatment (Table S3). TUDCA treatment reduced serum triglyceride and cholesterol levels but not other parameters. Both 4‐PBA and TUDCA treatments reduced mRNA expressions of ER stress markers such as ATF4 and CHOP, osteogenic markers such as ALP, Pit‐1, and OCN, and inflammatory makers such as TNFα (Figure 8A). In addition, 4‐PBA and TUDCA significantly attenuated CKD‐induced vascular calcification (Figure 8B and 8C).
Figure 8.
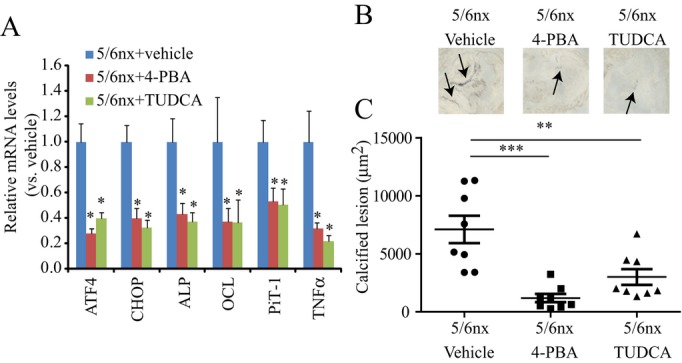
Chemical chaperones inhibit CKD‐dependent vascular calcification. Animals were treated with vehicle (saline), 250 mg/kg 4‐PBA, or 250 mg/kg TUDCA i.p. once daily for 8 weeks. Eight animals per group were tested and analyzed. A, Aortic mRNA levels in 5/6 nx or sham‐operated ApoE−/− mice treated with either chemical chaperones or vehicle *P<0.05 vs 5/6 nx ApoE−/− mice treated with vehicle. Eight samples per group were analyzed. B, Calcified area stained by von Kossa in aortic sinus of 5/6 nephrectomized ApoE−/− mice treated with vehicle (left), PBA (middle) or TUDCA (right). Arrow indicates calcified lesion. C, Calcified lesions in 5/6 nx or sham‐operated ApoE−/− mice treated with either infliximab or vehicle for 8 weeks. **P<0.01 and ***P<0.001 vs 5/6 nx ApoE−/− mice treated with vehicle. Eight samples per group were analyzed. ALP indicates alkaline phosphatase; ATF4, activating transcription factor 4; CHOP, C/EBP homologous protein; CKD, chronic kidney disease; nx, nephrectomized; PBA, phenylbutyric acid; PiT‐1, sodium‐dependent phosphate transporter 1; TNFα, tumor necrosis factor‐α; TUDCA, tauroursodeoxycholic acid.
Discussion
The mechanisms underlying the molecular pathogenesis of vascular calcification in CKD are extremely complex and are influenced by the interaction of severe inflammatory factors, lipids, minerals, and oxidative stress. TNFα, a chief inflammatory cytokine, has been shown to play a major causative role in vascular calcification in advanced atherosclerotic lesions.11 In addition to inflammation, ER stress may contribute to vascular calcification, as suggested by recent evidence from our group and others.19–20,30 In the present study, we found an important link between TNFα signaling and one of the ER stress signaling pathways, the PERK‐eIF2a‐ATF4‐CHOP axis, in the regulation of CKD‐dependent vascular calcification.
The first important conclusion of this study is that the PERK‐eIF2α‐ATF4‐CHOP axis of the ER stress response contributes to TNFα‐induced mineralization and osteogenic differentiation in VSMCs. TNFα dose‐dependently induced the PERK‐eIF2α‐ATF4‐CHOP pathway in VSMCs, correlated with mineralization of VSMCs. In addition, PERK‐, ATF4‐, and CHOP‐shRNA knockdown inhibited mineralization and osteogenic differentiation induced by TNFα, similar to stearate‐induced vascular calcification. Spliced IRE‐1 and XBP‐1 expressions were intact in these knockdown cells in response to TNFα treatment, suggesting that the IRE‐1α‐XBP‐1 axis of the ER stress response is unlikely to contribute to TNFα‐induced vascular calcification.
In addition to the ER stress response, the transcriptional activity of ATF4 is regulated through phosphorylation by PKA and RSK2.16–18 In addition to increased expression of ATF4 through ER stress, TNFα simultaneously induced the phosphorylation of ATF4 and the activation of the PKA and MEK‐ERK‐RSK2 pathways. Phosphorylation of ATF4 by PKA and RSK2 is a critical event in osteoblastic and osteoclastic differentiation for skeletal formation.16–18,31 PKA inhibitor (H89) and RSK inhibitor (SL0101‐01) reduced levels of mineralization and p‐ATF4 increased by TNFα. Combined treatment with PKA and PSK2 inhibitors further reduced mineralization of VSMCs. ATF4 with double mutations in PKA and RSK2 sites had lower activity on the mineralization of VSMCs than wild‐type ATF4. Based on our present study and the prior study of the Tintut and Demer group,10 we concluded that TNFα promotes vascular calcification by activating ATF4 via 3 pathways: (1) the PERK‐eIF2α axis of the ER stress response, (2) the PKA phosphorylation pathway, and (3) the MEK‐ERK‐RSK2 phosphorylation pathway.
While ATF4 is an essential component of osteogenic differentiation, CHOP may be the more crucial regulator of TNFα‐induced vascular calcification based on the following evidence: (1) TNFα‐induced vascular calcification was inhibited in CHOP‐knockdown VSMCs, which have normal ATF4 expression, and (2) CHOP overexpression induced vascular mineralization. However, we cannot rule out the possibility that ATF4 forms a heterodimer with CHOP32 to promote vascular calcification. It will be important to determine whether ATF4 and CHOP form a heterodimer regulating vascular calcification. The precise mechanism by which the PERK‐eIF2α‐ATF4‐CHOP signaling pathway augments TNFα‐induced vascular calcification remains unclear, but the mechanism is likely related to increased phosphate uptake. Our results suggest that increased phosphate uptake of VSMCs by the induction of Pit‐1 by CHOP contributes to the mechanism. Pit‐1 is a major type III sodium‐dependent phosphate transporter and has been proposed to be a crucial regulator in vascular calcification.33 We found that Pit‐1 is a major target of the PERK‐eIF2α‐ATF4‐CHOP signaling pathway (Table S1). In addition, CHOP significantly increased Pi uptake by increasing Pit‐1 expression (Figure 5H and 5I).
Another important observation of this study is that the activation of the PERK‐eIF2α‐ATF4‐CHOP axis of the ER stress response contributes to CKD‐dependent vascular calcification in vivo. Vascular calcification is a common feature of CKD and is associated with increased morbidity and mortality of subjects with CKD. Subjects with CKD have a higher serum TNFα level than subjects with normal kidney function.6–8 In this study, we found that CKD induced by 5/6 nephrectomies led to increased aortic expression of TNFα in ApoE−/− mice, along with increased aortic vascular calcification. Aortic ATF4 and CHOP expressions were significantly higher in 5/6 nx ApoE−/− mice compared with sham‐operated controls. The TNFα neutralizing monoclonal antibody infliximab reduced aortic PERK‐eIF2α‐ATF4‐CHOP signaling induced by CKD. This resulted in a complete inhibition of CKD‐dependent vascular calcification without affecting serum cholesterol and phosphorus levels (Table S2). In addition, attenuation of ER stress by 2 chemical chaperones, 4‐PBA and TUDCA, resulted in a significant reduction of CKD‐dependent vascular calcification. These results suggest that TNFα plays a causative role in CKD‐dependent vascular calcification through the activation of PERK‐eIF2α‐ATF4‐CHOP signaling (Figure 8).
In addition to TNFα‐induced vascular calcification, we previously reported that the PERK‐eIF2α‐ATF4 axis contributed to stearate‐induced vascular calcification.19,25 Other positive regulators such as high phosphate levels, oxidized lipids (oxysterols and oxidized phospholipids), bone morphogenetic protein‐2, and basic fibroblast growth factor strongly induce the PERK‐eIF2α‐ATF4‐CHOP axis of ER stress in VSMCs. Furthermore, we found that the PERK‐eIF2α‐ATF4‐CHOP axis was induced in other murine models of vascular calcification such as 5/6 nx DBA/2J mice and Klotho knockout mice (data not shown). In summary, the results presented here show that TNFα activates the PERK‐eIF2α‐ATF4‐CHOP axis of the ER stress signaling. In addition, TNFα activates 2 protein kinases, PKA and RSK2. As shown schematically in Figure 9, TNFα activation of protein kinases RSK2 and PKA lead to the phosphorylation of ATF4, which is increased though ER stress signaling. Activation of ATF4 induces the expression of CHOP and leads to increased inorganic phosphate uptake by inducing type III sodium‐dependent phosphate transporter, Pit‐1. Activation of the PERK‐eIF2α‐ATF4‐CHOP axis of the ER stress therefore appears to be a major event in the pathogenesis of vascular calcification and is emerging as a promising target for treatment of CKD‐dependent vascular calcification.
Figure 9.
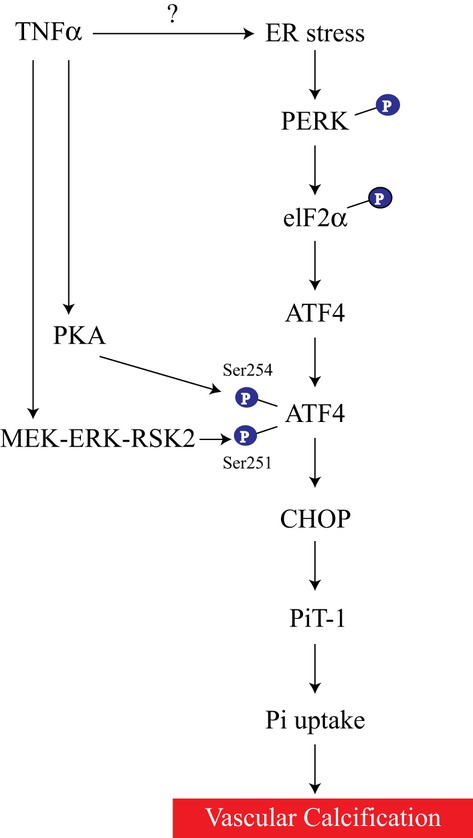
Proposed mechanism by which TNFα promotes vascular calcification. TNFα activates the PERK‐eIF2α‐ATF4‐CHOP axis of the ER stress signaling. TNFα also activates both PKA and RSK2, which in turn activate ATF4. Activation of ATF4 increases CHOP expression, leading to an increase in inorganic phosphate uptake by inducing a type III sodium‐dependent phosphate transporter, Pit‐1. Mechanism of ER stress activation by TNFα is unknown. ATF4 indicates activating transcription factor 4; CHOP, C/EBP homologous protein; ER, endoplasmic reticulum; eIF2α, eukaryotic initiation factor 2α; PERK, protein kinase RNA‐like endoplasmic reticulum kinase; Pi, inorganic phosphate; Pit‐1, sodium‐dependent phosphate transporter 1; PKA, protein kinase A; RSK2, ribosomal S6 kinase 2; Ser, serine; TNFα, tumor necrosis factor‐α.
Sources of Funding
This work was supported in part by research grants to Dr Miyazaki from the American Heart Association (10BGIA458005 and 12BGIA11380005) and the National Institute of Health (DK096030‐01). Dr Masuda received a fellowship from the American Heart Association (13POST13820008).
Disclosures
None.
References
- 1.Mizobuchi M, Towler D, Slatopolsky E. Vascular calcification: the killer of patients with chronic kidney disease. J Am Soc Nephrol. 2009; 20:1453-1464 [DOI] [PubMed] [Google Scholar]
- 2.Giachelli CM, Speer MY, Li X, Rajachar RM, Yang H. Regulation of vascular calcification: roles of phosphate and osteopontin. Circ Res. 2005; 96:717-722 [DOI] [PubMed] [Google Scholar]
- 3.Stenvinkel P, Ketteler M, Johnson RJ, Lindholm B, Pecoits‐Filho R, Riella M, Heimburger O, Cederholm T, Girndt M. IL‐10, IL‐6, and TNF‐alpha: central factors in the altered cytokine network of uremia—the good, the bad, and the ugly. Kidney Int. 2005; 67:1216-1233 [DOI] [PubMed] [Google Scholar]
- 4.Kimmel PL, Phillips TM, Simmens SJ, Peterson RA, Weihs KL, Alleyne S, Cruz I, Yanovski JA, Veis JH. Immunologic function and survival in hemodialysis patients. Kidney Int. 1998; 54:236-244 [DOI] [PMC free article] [PubMed] [Google Scholar]
- 5.Cachofeiro V, Goicochea M, de Vinuesa SG, Oubina P, Lahera V, Luno J. Oxidative stress and inflammation, a link between chronic kidney disease and cardiovascular disease. Kidney Int Suppl. 2008; 111:S4-S9 [DOI] [PubMed] [Google Scholar]
- 6.Bolton CH, Downs LG, Victory JG, Dwight JF, Tomson CR, Mackness MI, Pinkney JH. Endothelial dysfunction in chronic renal failure: roles of lipoprotein oxidation and pro‐inflammatory cytokines. Nephrol Dial Transplant. 2001; 16:1189-1197 [DOI] [PubMed] [Google Scholar]
- 7.Mezzano D, Pais EO, Aranda E, Panes O, Downey P, Ortiz M, Tagle R, Gonzalez F, Quiroga T, Caceres MS, Leighton F, Pereira J. Inflammation, not hyperhomocysteinemia, is related to oxidative stress and hemostatic and endothelial dysfunction in uremia. Kidney Int. 2001; 60:1844-1850 [DOI] [PubMed] [Google Scholar]
- 8.Yeo ES, Hwang JY, Park JE, Choi YJ, Huh KB, Kim WY. Tumor necrosis factor (TNF‐alpha) and C‐reactive protein (CRP) are positively associated with the risk of chronic kidney disease in patients with type 2 diabetes. Yonsei Med J. 2010; 51:519-525 [DOI] [PMC free article] [PubMed] [Google Scholar]
- 9.Chasseraud M, Liabeuf S, Mozar A, Mentaverri R, Brazier M, Massy ZA, Kamel S. Tumor necrosis factor‐related apoptosis‐inducing ligand and vascular calcification. Ther Apher Dial. 2011; 15:140-146 [DOI] [PubMed] [Google Scholar]
- 10.Tintut Y, Patel J, Parhami F, Demer LL. Tumor necrosis factor‐alpha promotes in vitro calcification of vascular cells via the cAMP pathway. Circulation. 2000; 102:2636-2642 [DOI] [PubMed] [Google Scholar]
- 11.Al‐Aly Z, Shao JS, Lai CF, Huang E, Cai J, Behrmann A, Cheng SL, Towler DA. Aortic Msx2‐Wnt calcification cascade is regulated by TNF‐alpha‐dependent signals in diabetic Ldlr−/− mice. Arterioscler Thromb Vasc Biol. 2007; 27:2589-2596 [DOI] [PubMed] [Google Scholar]
- 12.Lin JH, Walter P, Yen TS. Endoplasmic reticulum stress in disease pathogenesis. Annu Rev Pathol. 2008; 3:399-425 [DOI] [PMC free article] [PubMed] [Google Scholar]
- 13.Ron D, Walter P. Signal integration in the endoplasmic reticulum unfolded protein response. Nat Rev Mol Cell Biol. 2007; 8:519-529 [DOI] [PubMed] [Google Scholar]
- 14.Walter P, Ron D. The unfolded protein response: from stress pathway to homeostatic regulation. Science. 2011; 334:1081-1086 [DOI] [PubMed] [Google Scholar]
- 15.Harding HP, Novoa I, Zhang Y, Zeng H, Wek R, Schapira M, Ron D. Regulated translation initiation controls stress‐induced gene expression in mammalian cells. Mol Cell. 2000; 6:1099-1108 [DOI] [PubMed] [Google Scholar]
- 16.Karsenty G. Transcriptional control of skeletogenesis. Annu Rev Genomics Hum Genet. 2008; 9:183-196 [DOI] [PubMed] [Google Scholar]
- 17.Yang X, Matsuda K, Bialek P, Jacquot S, Masuoka HC, Schinke T, Li L, Brancorsini S, Sassone‐Corsi P, Townes TM, Hanauer A, Karsenty G. ATF4 is a substrate of RSK2 and an essential regulator of osteoblast biology: implication for Coffin‐Lowry syndrome. Cell. 2004; 117:387-398 [DOI] [PubMed] [Google Scholar]
- 18.Elefteriou F, Ahn JD, Takeda S, Starbuck M, Yang X, Liu X, Kondo H, Richards WG, Bannon TW, Noda M, Clement K, Vaisse C, Karsenty G. Leptin regulation of bone resorption by the sympathetic nervous system and cart. Nature. 2005; 434:514-520 [DOI] [PubMed] [Google Scholar]
- 19.Masuda M, Ting TC, Levi M, Saunders SJ, Miyazaki‐Anzai S, Miyazaki M. Activating transcription factor 4 regulates stearate‐induced vascular calcification. J Lipid Res. 2012; 53:1543-1552 [DOI] [PMC free article] [PubMed] [Google Scholar]
- 20.Liberman M, Johnson RC, Handy DE, Loscalzo J, Leopold JA. Bone morphogenetic protein‐2 activates NADPH oxidase to increase endoplasmic reticulum stress and human coronary artery smooth muscle cell calcification. Biochem Biophys Res Commun. 2011; 413:436-441 [DOI] [PMC free article] [PubMed] [Google Scholar]
- 21.Chalmers JA, Lin SY, Martino TA, Arab S, Liu P, Husain M, Sole MJ, Belsham DD. Diurnal profiling of neuroendocrine genes in murine heart, and shift in proopiomelanocortin gene expression with pressure‐overload cardiac hypertrophy. J Mol Endocrinol. 2008; 41:117-124 [DOI] [PubMed] [Google Scholar]
- 22.Mackenzie NC, Zhu D, Longley L, Patterson CS, Kommareddy S, MacRae VE. MOVAS‐1 cell line: a new in vitro model of vascular calcification. Int J Mol Med. 2011; 27:663-668 [DOI] [PubMed] [Google Scholar]
- 23.Miyazaki‐Anzai S, Levi M, Kratzer A, Ting TC, Lewis LB, Miyazaki M. FXR activation prevents the development of vascular calcification in ApoE−/− mice with chronic kidney disease. Circ Res. 2010; 106:1807-1817 [DOI] [PMC free article] [PubMed] [Google Scholar]
- 24.Hambruch E, Miyazaki‐Anzai S, Hahn U, Matysik S, Boettcher A, Perovic‐Ottstadt S, Schluter T, Kinzel O, Krol HD, Deuschle U, Burnet M, Levi M, Schmitz G, Miyazaki M, Kremoser C. Synthetic farnesoid X receptor agonists induce high‐density lipoprotein‐mediated transhepatic cholesterol efflux in mice and monkeys and prevent atherosclerosis in cholesteryl ester transfer protein transgenic low‐density lipoprotein receptor (−/−) mice. J Pharmacol Exp Ther. 2012; 343:556-567 [DOI] [PMC free article] [PubMed] [Google Scholar]
- 25.Ting TC, Miyazaki‐Anzai S, Masuda M, Levi M, Demer LL, Tintut Y, Miyazaki M. Increased lipogenesis and stearate accelerate vascular calcification in calcifying vascular cells. J Biol Chem. 2011; 286:23938-23948 [DOI] [PMC free article] [PubMed] [Google Scholar]
- 26.Flowers MT, Keller MP, Choi Y, Lan H, Kendziorski C, Ntambi JM, Attie AD. Liver gene expression analysis reveals endoplasmic reticulum stress and metabolic dysfunction in SCD1‐deficient mice fed a very low‐fat diet. Physiol Genomics. 2008; 33:361-372 [DOI] [PubMed] [Google Scholar]
- 27.Masuda M, Yamamoto H, Kozai M, Tanaka S, Ishiguro M, Takei Y, Nakahashi O, Ikeda S, Uebanso T, Taketani Y, Segawa H, Miyamoto K, Takeda E. Regulation of renal sodium‐dependent phosphate co‐transporter genes (Npt2a and Npt2c) by all‐trans‐retinoic acid and its receptors. Biochem J. 2010; 429:583-592 [DOI] [PubMed] [Google Scholar]
- 28.Tintut Y, Parhami F, Bostrom K, Jackson SM, Demer LL. cAMP stimulates osteoblast‐like differentiation of calcifying vascular cells. Potential signaling pathway for vascular calcification. J Biol Chem. 1998; 273:7547-7553 [DOI] [PubMed] [Google Scholar]
- 29.Aikawa E, Aikawa M, Libby P, Figueiredo JL, Rusanescu G, Iwamoto Y, Fukuda D, Kohler RH, Shi GP, Jaffer FA, Weissleder R. Arterial and aortic valve calcification abolished by elastolytic cathepsin S deficiency in chronic renal disease. Circulation. 2009; 119:1785-1794 [DOI] [PMC free article] [PubMed] [Google Scholar]
- 30.Duan X, Zhou Y, Teng X, Tang C, Qi Y. Endoplasmic reticulum stress‐mediated apoptosis is activated in vascular calcification. Biochem Biophys Res Commun. 2009; 387:694-699 [DOI] [PubMed] [Google Scholar]
- 31.Cao H, Yu S, Yao Z, Galson DL, Jiang Y, Zhang X, Fan J, Lu B, Guan Y, Luo M, Lai Y, Zhu Y, Kurihara N, Patrene K, Roodman GD, Xiao G. Activating transcription factor 4 regulates osteoclast differentiation in mice. J Clin Invest. 2010; 120:2755-2766 [DOI] [PMC free article] [PubMed] [Google Scholar]
- 32.Su N, Kilberg MS. C/EBP homology protein (CHOP) interacts with activating transcription factor 4 (ATF4) and negatively regulates the stress‐dependent induction of the asparagine synthetase gene. J Biol Chem. 2008; 283:35106-35117 [DOI] [PMC free article] [PubMed] [Google Scholar]
- 33.Li X, Yang HY, Giachelli CM. Role of the sodium‐dependent phosphate cotransporter, Pit‐1, in vascular smooth muscle cell calcification. Circ Res. 2006; 98:905-912 [DOI] [PubMed] [Google Scholar]