

Abstract
Background
Human mesenchymal stromal cells (hMSCs) from adipose cardiac tissue have attracted considerable interest in regard to cell‐based therapies. We aimed to test the hypothesis that hMSCs from the heart and epicardial fat would be better cells for infarct repair.
Methods and Results
We isolated and grew hMSCs from patients with ischemic heart disease from 4 locations: epicardial fat, pericardial fat, subcutaneous fat, and the right atrium. Significantly, hMSCs from the right atrium and epicardial fat secreted the highest amounts of trophic and inflammatory cytokines, while hMSCs from pericardial and subcutaneous fat secreted the lowest. Relative expression of inflammation‐ and fibrosis‐related genes was considerably higher in hMSCs from the right atrium and epicardial fat than in subcutaneous fat hMSCs. To determine the functional effects of hMSCs, we allocated rats to hMSC transplantation 7 days after myocardial infarction. Atrial hMSCs induced greatest infarct vascularization as well as highest inflammation score 27 days after transplantation. Surprisingly, cardiac dysfunction was worst after transplantation of hMSCs from atrium and epicardial fat and minimal after transplantation of hMSCs from subcutaneous fat. These findings were confirmed by using hMSC transplantation in immunocompromised mice after myocardial infarction. Notably, there was a correlation between tumor necrosis factor‐α secretion from hMSCs and posttransplantation left ventricular remodeling and dysfunction.
Conclusions
Because of their proinflammatory properties, hMSCs from the right atrium and epicardial fat of cardiac patients could impair heart function after myocardial infarction. Our findings might be relevant to autologous mesenchymal stromal cell therapy and development and progression of ischemic heart disease.
Keywords: adipose tissue, epicardial fat, heart regeneration, inflammation, macrophages, mesenchymal stromal/stem cells, myocardial infarction
Introduction
One of the major challenges in the translation of cell therapy into viable clinical therapy for cardiovascular diseases is to select the best cell type for the treatment of a specific disease. Adipose tissue is now recognized as an accessible, abundant, and reliable source for stem/progenitor cells.1 Particularly, human mesenchymal stem/stromal cells (hMSCs), derived from adipose tissue, have shown the potential to proliferate and differentiate into multiple cell lineages and to secrete protective factors, which could reduce cell death, fibrosis, and inflammation.2–3 Large numbers of hMSCs can be harvested from adult adipose tissue and redelivered to the patient in sufficient quantities for regeneration and repair.
Although it has been assumed that all MSCs, from different adipose tissues, are similar and homogeneous, this notion ignores important differences in biology and therapeutic potential among various MSCs.4 For example, gene expression, surface epitopes, clonogenicity, potential to differentiate, and therapeutic potential vary between bone marrow (BM) and adipose tissue MSCs.5 Importantly, the variability among MSCs from different adipose tissues is yet unknown.
In the human heart, the subepicardial space contains fat depots, mostly localized next to the epicardial coronary arteries, the atrioventricular groove, and the origin of the aorta. We hypothesized that epicardial fat could provide hMSCs with better reparative potential because of their proximity to the human heart and the direct and paracrine role of epicardial cells in myocardial regeneration and repair.6–8 In fact, cardiac fat has been proposed as a source of progenitor cells and biological matrix for salvaging injured myocardium.9–10 Thus, the aim of the present study was to test this hypothesis in hMSCs derived from epicardial fat, compared with hMSCs from pericardial and subcutaneous fat, BM, and atrial tissue. Understanding the differences in MSC characteristics from various locations would not only enhance our understanding of adipose tissue MSC therapeutic potential but also extend our knowledge regarding the involvement of adipose tissue MSCs in the pathogenesis and progression of various cardiovascular diseases.
Materials and Methods
Patients, Sample Collection, and Cell Isolation
Patients signed a written consent form according to a protocol approved by the Internal Review Committee of the Sheba Medical Center. All animal experiments complied with the standards stated in the “Guide for the Care and Use of Laboratory Animals” (Institute of Laboratory Animal Resources, National Academy of Sciences, Bethesda, MD) and were approved by the Sheba Medical Center Institutional Animal Care and Use Committee.
Samples of human cardiac fat, sternal subcutaneous fat, and right atrium were obtained from patients undergoing open heart surgery (age 66±1.6 years). We excised small samples with a surgical scalpel to avoid thermal injury to the tissue. Myocardial tissues were taken from the right atrium, pericardial fat from the adipose tissue that surrounds the heart, and epicardial fat from the fat pad covering the aortic root. In addition, we collected subcutaneous fat samples from adult patients (age 52±3.5 years) undergoing liposuction procedures and BM biopsy samples that were donated from healthy young volunteers from Copenhagen University Hospital (age 25.2±0.6 years). All cells, except BM cells, were extracted with an enzymatic digestion mixture,11 and expanded. Adhered cells were grown as previously described.11 BM aspirate was obtained from the iliac crest of healthy donors via needle aspiration under local anaesthesia. The marrow sample was diluted 1:2 with PBS minus Ca2+ and Mg2+ (GIBCO, Life Technologies).
BM cells were harvested via gradient centrifugation (Lymphoprep; Medinor; density 1077 g/cm3) at 800g for 20 minutes, and then primary cell cultures were seeded onto DMEM low glucose (1 g/L) with 25 mmol/L HEPES and l‐glutamine, 1% penicillin/streptomycin, and 10% FBS (PAA Laboratories).
Cells were incubated at 37°C in humid air with 5% CO2. The medium was changed 5 days after plating and subsequently every 3 or 4 days. Cells were harvested and passaged or used for further analysis when they reached 80% confluence. We isolated cells from 112 tissue samples collected from 52 patients.
Flow Cytometry
To determine the phenotype of the human cells, isolated cells were separated by their ability to attach to the bottom of a plastic culture dish. After the third passage, the immune phenotype of the cultured cells was analyzed by flow cytometry, using the following fluorescence antihuman antibodies: CD105‐APC (eBioscience), CD73‐PE (BD Pharmingen), CD90‐PE (BioLegend), and CD34‐PE, CD45‐PE, and C‐kit‐APC (Dako). Labeled cells (0.5×10⁶) from each sample were acquired and analyzed using FACS Calibur Cytofluorimeter (Cyteck Development) with Flowjo software (Tree Star).
Proliferation Assay
The hMSCs at passage 3 were cultured at 37°C in 96‐well plates at a concentration of 3000 cells/well. The proliferation level was then measured in triplicate wells for each MSC population by cell proliferation kit XTT–based colorimetric assay (Biological Industries) for 5 consecutive days. The number of cells in each well was calculated based on the measured optical density and initial plating concentration. Doubling time (DT) of each MSC population was calculated using the formula DT=(t initial−t final)×[log2/log(N final/N initial)]. (t = time, N = number of cells). Each assay was performed on 2 or 3 primary cell cultures from each MSC population.
In Vitro and In Vivo Differentiation Assays
To examine the multipotential differentiation capabilities of the different cells, we used in vitro assays for differentiation into osteoblasts and adipocytes and toward cardiomyogenic lineage as previously described12. For osteogenic differentiation, cells were cultured in DMEM (Gibco‐Invitrogen) containing 50 μg/mL l‐ascorbic acid‐2 phosphate, 10 mmol/L glycerol 2‐phosphate disodium salt, and 1×10⁻⁷ mol/L dexamethasone (all from Sigma‐Aldrich). Cultures were stained using Alizarin red for identification of differentiated cells. For adipogenic differentiation, cells were cultured in DMEM (Gibco‐Invitrogen) containing 10% horse serum (Biological Industries), 10 mg/mL insulin, 0.5 mmol/L IBMX, 1×10⁻⁵ mol/L dexamethasone (Sigma‐Aldrich), and 100 mmol/L indomethacin (Sigma‐Aldrich). Lipid depositions were examined using Oil‐red‐O staining (Sigma‐Aldrich). For cardiomyogenic differentiation, cells were treated with 10 μmol/L 5‐azacytidine (Sigma‐Aldrich) in DMEM (Gibco‐Invitrogen) containing 10% FBS (Biological Industries) for 24 hours once a week for 2 weeks. Following this procedure, cells were maintained in 2% FBS medium without 5‐azacytidine for 2 weeks. After each incubation, cells were maintained in DMEM (Gibco‐Invitrogen) containing 2% FBS (Biological Industries) without 5‐azacytidine for the remainder of the week. Cultures were fixed and stained for human α‐actinin (Sigma‐Aldrich) and cardiac troponin I (Thermo Fisher Scientific) for assessment of cardiomyogenic differentiation.
To examine the in vivo differentiation potential of epicardial fat hMSCs, we injected 4×10⁶ cells into the myocardium of two athymic immunocompromised nude rats (Harlan Laboratories). Seven days after cell transplantation, the hearts were harvested, perfused with 4% buffered formalin (Biolab), and sectioned into 4 transverse slices. Each slice was embedded in paraffin and sectioned into 5‐μm slices. Serial sections were stained with antihuman mitochondria antibody (Chemicon International) and hematoxylin (for nuclear staining) and with immunofluorescent staining for human α‐actinin (Sigma), cardiac troponin I (Thermo Fisher Scientific), and DAPI for nuclear staining (Vector Laboratories).
Cytokine Array
To determine the levels of cytokine secretion from hMSCs, we cultured the cells at a concentration of 1×10⁵ cells per well in a 24‐well plate and collected the culture medium after 72 hours, keeping it frozen at −80°C until use. We measured cytokine levels in triplicate using Q‐Plex Human Custom (12‐plex) array (Quansys Biosciences Multiplex ELISA). To determine the cytokine concentration in each sample, an image of the plate was taken by use of the Quasys Q‐View imaging system, which includes a high‐resolution Canon digital camera. The intensity of the chemiluminescence of each spot was compared with that of an 8‐point standard curve generated by 5‐parameter logistic regression for that particular cytokine, using Quansys Q‐view software. For all multiplex assays, samples were run in triplicate wells.
Effect of hMSCs on Macrophage Polarization
Macrophages were isolated from leukocyte blood units from healthy young donors, using Ficoll membrane tubes, as previously described.13 CD14 monocytes were positively selected from mononuclear cells (MNCs) using magnetic bead antibodies (Miltenyi Biotec). We cultured the monocytes for 5 days in RPMI (Gibco‐Invitrogen) supplemented with 10% FBS (Biological Industries) and 1% penicillin/streptomycin (Biological Industries). On the sixth day, the medium was refreshed and adherent macrophages were cultured for 3 days with the different MSCs (in passage 3, n=4 from each source) at a ratio of 1:4 MSCs/macrophages, separated by a transwell membrane (1 mm; Millipore). To characterize macrophage phenotype, we harvested cultured macrophages using a scraper and stained with antibodies against M2 markers: mouse antihuman CD206‐FITC and CD163‐APC (BioLegend).
Angiogenic Tube Formation Assay
To examine the angiogenic effect of the hMSCs, human umbilical vein endothelial cells (HUVECs) (Promocell; Biological Industries) were seeded at a concentration of 2×10⁴ cells/well onto a 96‐well plate coated with 50 μL of Matrigel matrix (BD Biosciences) and allowed to attach. Then the HUVECs were incubated with the culture media from the hMSCs from the different locations. After 8 hours, we took microscopic pictures of each well, and the number and structure of the tubes were evaluated by an independent observer who was blinded to the MSC location. Tube formation was assessed in a representative hMSC sample from each location by counting the number of tubes in each well. Results from triplicate wells were expressed as the mean number of tubes per well ±SEM. BM‐MSCs were cultured in a different expansion medium, which is why we compared BM values with control BM conditioned media.
Gene Array Analysis
To investigate differences in gene expression from different hMSCs, we collected tissue samples from a single 68‐year‐old man with diabetes, significant coronary artery disease, and severe aortic stenosis. Tissue samples were obtained from 4 locations: epicardial fat, pericardial fat, the right atrium, and subcutaneous sternal fat. Total RNA was extracted from cells at passage 3, using RNeasy Mini Kit (QIAGEN GmbH) according to the manufacturer's instructions. Total RNA was quantified by using a spectrophotometer, and quality was confirmed by using gel electrophoresis. Gene array was performed using Affymetrix HuGENE 1.0 st oligonucleotide arrays (http://www.affymetrix.com/support/technical/datasheets/gene_1_0_st_datasheet.pdf). Sample processing was performed according to the Affymetrix WT protocol as described (https://www.affymetrix.com/support/downloads/manuals/wt_sensetarget_label_manual.pdf). For raw data generation, we used a gene‐level RMA sketch algorithm (Affymetrix Expression Console and Partek Genomics Suite 6.2). Genes were filtered and analyzed using fold change calculations and unsupervised hierarchical cluster analysis (SpotfireDecisionSite for Functional Genomics). Further processing includes functional analysis and overrepresentation calculations based on Gene Ontology and publication data (DAVID: http://apps1.niaid.nih.gov/David/upload.asp). Finally, we used the database for Annotation (GO), Visualization, and Integrated Discovery. Overrepresentation calculations were made using Ease (DAVID), and data results are deposited in http://eng.sheba.co.il/genomics.
Rat Model of Myocardial Infarction and Human Cell Transplantation
All animal work was approved by the Institutional Review Board and was supervised by institutional animal protection officials. We used 61 female Sprague–Dawley rats (200 g; Harlan) for our rat model of myocardial infarction (MI). The rats were anesthetized and underwent coronary artery ligation of the left coronary artery as previously described.14 Only those animals whose left ventricular (LV) fractional shortening was <40% at the echocardiographic baseline measurement (6 days after the ligation) were included in the study (n=57). Seven days after MI induction, rats were allocated to injection into the infarcted myocardium of 2×10⁶ right atrial hMSCs (n=9), epicardial fat hMSCs (n=10), subcutaneous fat hMSCs (n=9), BM hMSCs (n=8), or Matrigel alone (n=11) or saline alone (n=10). The injected cells were pooled from 3 different patients per location and mixed with Matrigel Matrix (BD Biosciences) to improve cell retention. Animals were followed for 27 additional days after transplantation.
To assess LV remodeling and function in rats, transthoracic echocardiography was performed on days 6 and 34 after MI (hMSCs were injected on day 7). Rats were anesthetized and their chests were shaved. Echocardiograms were performed with a special small animal echocardiography system (Vevo 2100 Imaging System; VisualSonics) equipped with a 13‐ to 24‐MHz linear‐array transducer (MS250 MicroScan Transducer, VisualSonics).15
All measurements were averaged for 3 consecutive cardiac cycles, were performed by an experienced technician, and were reviewed by an experienced cardiologist and an echocardiography expert (M.S.F.) who was blinded to the treatment groups.
Immunocompromised Nude Mouse Model of MI and Human Cell Transplantation
To validate the comparison of cells from various human donors and to avoid any potential bias from immune rejection, we repeated the transplantation study in immunocompromised nude mice after MI.
To induce MI, immunocompromised female Hsd:Athymic Nude‐Foxn1nu mice (n=50, 11 weeks, 22 g; Harlan) were anesthetized with inhalation of 2% isoflurane. The chest was opened via left thoractomy through the fourth intercostal space, and the left main coronary artery was permanently occluded with an intramural 9‐0 polypropylene suture. One minute after artery occlusion, the ischemic area was identified and 4 types of MSCs (1×10⁵) or saline were injected into the ischemic border zone. For this study, we used the MSC culture used for gene expression profiling. The implanted MSCs were obtained from different locations, from the same 1 patient. One minute after coronary occlusion, the mice were allocated to injection into the infarcted myocardium of 100 000 right atrial hMSCs (n=6), epicardial fat hMSCs (n=6), pericardial fat hMSCs (n=7), sternal subcutaneous fat hMSCs (n=6), and saline (n=8). Perioperative mortality was 34% (17 of 50).
To assess LV remodeling and function after cell therapy, conventional echocardiography and speckle‐tracking–based strain imaging (1 and 28 days after MI) were performed with a special echocardiography system (Vevo 2100 Imaging System; VisualSonics) equipped with a 22–55 MHz linear‐array transducer (MS550D MicroScan Transducer, VisualSonics). We then used speckle‐tracking–based strain analysis for strain quantification in the longitudinal axis.16 Echocardiographic parasternal long‐axis images were acquired at a frame rate of 280 frames/s. Three consecutive cardiac cycles were selected, and their endocardium and epicardial borders were traced. If needed, borders were corrected to preserve as precise tracking as possible throughout each cine loop. Each LV image in long axis was divided into 6 segments for regional speckle‐tracking–based strain analysis: anterior base, anterior mid, anterior apex, posterior apex, posterior mid, and posterior base. Peak strain data were recorded from each segment for regional speckle‐tracking–based strain analysis.
Histopathological Evaluation
At the end of the study, the hearts were arrested with 15% KCl, harvested, perfused with 4% buffered formalin (Biolab), and sectioned into 3 or 2 transverse slices parallel to the atrioventricular ring, 27 and 29 days after cell transplantation in rats and mice. Each slice was embedded in paraffin and sectioned into 5‐μm slices. Serial sections were stained with hematoxylin and eosin or immunolabeled with specific antibodies.
Postmortem morphometric analysis was performed on rat and mice hearts 27 to 28 days after MSC transplantation. The hearts were perfused with 4% formaldehyde (15 mm Hg) for 20 minutes, and measurements were performed on slices obtained ~5 mm from the apex of the heart. The slides were stained with hematoxylin and eosin or with Masson's trichrome, photographed, and analyzed with the use of planimetry software (Sigma Scan Pro version 5). We measured average wall thickness from 3 measurements of septum thickness, average scar thickness from 3 measurements of scar thickness (mm), LV muscle area (including the septum), LV cavity area, and the whole LV area (mm2). Relative scar thickness was calculated as average scar thickness divided by average wall thickness. Expansion index was calculated as follows: expansion index=[LV cavity area/whole LV area]/relative scar thickness. Muscle area (mm2) was determined by reduction of LV cavity area from whole LV area. Relative scar area was determined by average scar area divided by average muscle area.
To determine the survival of implanted hMSCs in the infarcted myocardium, we stained the heart sections with antihuman mitochondria antibodies (Chemicon International) and hematoxylin (for nuclear staining).
To determine the effect of hMSCs on infarct vascularization, we harvested the hearts 27 days after injection and sections were immunolabeled with antibodies against α–smooth muscle actin isoform (Sigma). Three adjacent fields of each section were recorded (at ×400 magnification) and examined for stained vessels with a diameter of 1 to 100 μm at the infarct site. All quantitative evaluations were performed with CellSens imaging software (Olympus America Inc) by a researcher who was blinded to the treatment groups. Results were expressed as the mean±SEM number of vessel/mm2.
To reveal the influence of the transplanted hMSCs on the severity of inflammation, sections were stained with hematoxylin and eosin and 3 adjacent fields at the infarct site of each section were recorded (at ×100 magnification) and examined for the degree of infiltration of inflammatory cells. Microscopic findings were graded: 1 indicated infiltrate of inflammatory cells not exceeding 1%; 2, not exceeding 10%; 3, not exceeding 50%; and 4, exceeding 50%.17 The mean score of 3 fields was recorded as the microscopic score for each heart.
To assess the effect of hMSCs on the percentage of macrophages in the infarct site, sections (1 per heart) were immunolabeled with antibodies against anti‐rat ED1 (AbD Serotec). Three adjacent fields of each section were recorded (at ×200 magnification) and examined for positive staining. All quantitative evaluations were performed with NIS elements BR 3.0 imaging software (Nikon Instruments Inc). Results were expressed as mean±SEM percentage of positive‐stained area/total tissue area.
Statistical Analysis
Statistical analysis was performed with GraphPad Prism version 5.00 for Windows (GraphPad Software). All variables are expressed as mean±SEM. Normality was tested with the Shapiro‐Wilk test. If normally distributed, differences in LV function between baseline and 34 days were assessed with 2‐tail paired t tests. To test the hypothesis that changes in measures of hMSC proliferation in vitro and rat LV remodeling and function over time vary among the experimental groups, we used general linear model 2‐way repeated‐measures ANOVA. In the rat MI experiments, echocardiography measures of LV remodeling and function at day 6 (before cell therapy) and at day 34 after MI were analyzed, and the Bonferroni correction was used to assess the significance of predefined comparisons at specific time points. Differences among groups in cytokine secretion, histology measures, and changes in LV function were compared by use of ANOVA or Kruskal‐Wallis test (if data were not normally distributed) with Bonferroni's or Dunn's multiple comparison post‐test. Percent of change from baseline measurement was calculated for each animal as follows: [(follow‐up parameter−baseline parameter)/baseline parameter]×100. Gene expression profiles among various MSC sources were compared by using Pearson correlation coefficient. Spearman rank correlation was used to estimate the relationship between the levels of secreted cytokines in vitro and changes in echocardiography LV measures in vivo.
All authors had full access to and take full responsibility for the integrity of the data. All authors have read and agree to the manuscript as written.
Results
To grow hMSCs from different locations, we obtained 112 tissue samples from 52 patients (Table 1). Right atrium myocardial tissue, epicardial fat, and pericardial fat specimens were donated from patients undergoing open heart surgery (n=37). Of the patients undergoing open heart surgery, 20 patients donated 3 specimens each (right atrium, epicardial fat, and pericardial fat). This allowed us to compare differences among hMSC locations, independent of interpatient variability. Subcutaneous fat specimens were obtained through liposuction procedures (n=11) and from sternal subcutaneous fat (n=1). BM specimens were donated from healthy donors (n=4) (Table 1).
Table 1.
Location of Tissue Samples and Patient Properties
| Procedure | No. of Patients | Age, y | Gender | Tissue Type | No. of Tissues | Diagnosis | |
|---|---|---|---|---|---|---|---|
| Male | Female | ||||||
| Open heart surgery | 37 | 66±1.5 | 22 | 15 | Right atrium Epicardial fat Pericardial fat Sternal fat |
31 33 32 1 |
Cytokine array (n=6) AVR CABG CABG+MV repair CABG+MV repair MVR AVR Transplantation in rats (n=4) CABG AVR MVR CABG Transplantation in nude mice and gene array CABG+AVR |
| Liposuction procedure | 11 | 52±3.5 | 2 | 9 | Subcutaneous fat | 11 | Cytokine array (n=6) Breast reconstruction after mastectomy Cosmetic surgery Cosmetic surgery Cosmetic surgery Breast reconstruction after mastectomy Breast reconstruction after mastectomy Transplantation in rats (n=3) Breast reconstruction after mastectomy Breast reconstruction after mastectomy Cosmetic surgery |
| Bone marrow biopsy | 4 | 25.2±0.6 | 4 | 0 | Bone marrow | 4 | Healthy (n=4) |
| Total | 52 | 28 | 24 | 112 | |||
AVR indicates aortic valve replacement; CABG, coronary artery bypass graft surgery; MVR, mitral valve replacement.
Characteristics of hMSCs
The hMSCs were plastic adherent and displayed a mesenchymal spindle shape (Figure 1A through 1E). Right atrium–derived cells appeared to be rounder and had a heterogeneous morphology including mesenchymal spindle and cobblestone shapes (Figure 1A). To further characterize the phenotype of the different hMSCs, we analyzed hMSCs at passages 3 to 5 by using a flow cytometer (Table 2). Cultured cells from all locations expressed high levels of hMSC markers (CD105, CD73, and CD90), and were negative for the hematopoietic lineage markers (CD45 and CD34). Interestingly, the cardiac progenitor marker c‐kit was expressed exclusively (>40%) in hMSCs from the right atrium (P=0.04).
Figure 1.
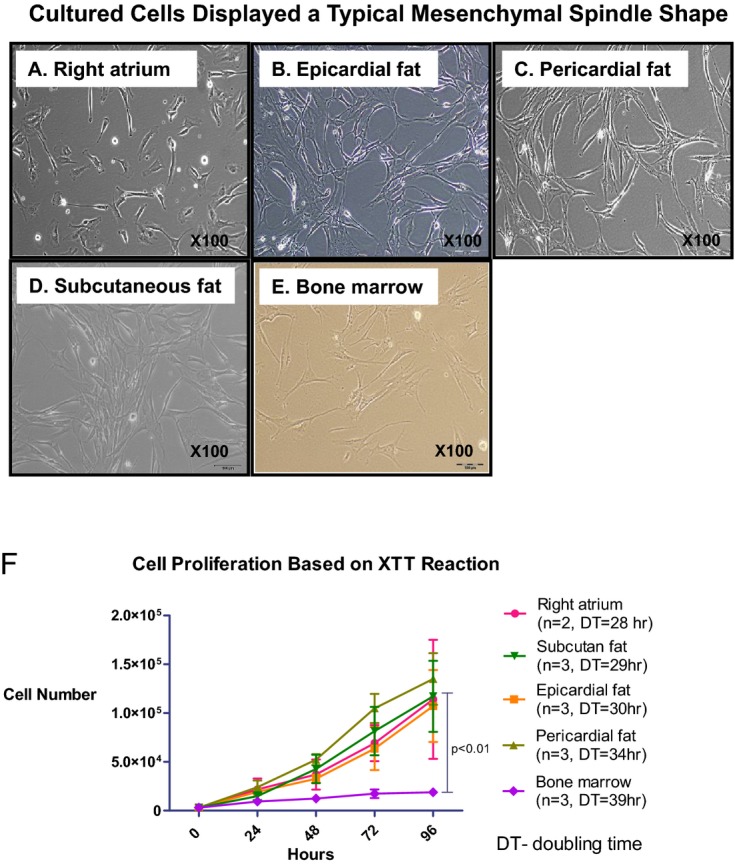
Different growth rates of hMSCs from different locations. A through E, Morphology of adherent cells isolated from different locations. Cells were plastic‐adherent and displayed a mesenchymal spindle shape. Representative pictures of cells at passage 3 from the different locations: right atrium (A), epicardial fat (B), pericardial fat (C), subcutaneous fat (D), and bone marrow (E). Note that right atrium–derived cells appear to be rounder. F, Cells were isolated and cultured up to the third passage, and then the number of cells was calculated based on optical density measurement by XTT reaction for 5 consecutive days in each location. The graph displays growth curves of hMSCs and doubling time. BM hMSCs display the slowest growth rate. Results are expressed as the mean±SEM number of cells per hMSC location. Measures of cell proliferation over time and among groups were analyzed by a 2‐way repeated‐measures ANOVA. BM indicates bone marrow; DT, doubling time; hMSCs, human mesenchymal stromal cells.
Table 2.
Immune Phenotype Analysis Shows High Level of hMSC Markers in Cultured Cells From Different Locations
| Marker, % | Right Atrium (n=4) | Epicardial Fat (n=3) | Pericardial Fat (n=4) | Subcutaneous Fat (n=4) | Bone Marrow (n=4) |
|---|---|---|---|---|---|
| CD105 | 95.9±2.3 | 96.8±2.3 | 98.2±0.4 | 95.2±2.5 | 97.7±0.1 |
| CD73 | 93.8±1.3 | 98.1±1.4 | 96.7±0.5 | 91.3±4.2 | 85.7±3.8 |
| CD90 | 29.9±6.9* | 93.6±1.3 | 78.1±6.2 | 94.6±2.3 | 86.9±1 |
| CD45 | 0.2±0.2 | 0 | 0.03±0 | 0.2±0.1 | 0.8±0.5 |
| CD34 | 1.8±0.6 | 4±4 | 3.3±2.2 | 2.8±1.4 | 0.9±0.5 |
| C‐kit | 41.7±1.3* | 0 | 0.3±0.2 | 0.1±0.1 | 0.6±0.5 |
Values are represented as mean±SE percentage of positive cells of the total number of cells analyzed. hMSCs indicate human mesenchymal stromal cells.
Right atrium vs all groups (P=0.02).
Right atrium vs all groups (P=0.04).
Proliferation rate was assessed by using an XTT cell proliferation kit. Surprisingly, the slowest proliferation rate was measured in BM hMSCs from healthy young donors with a doubling time of 39±2 hours. Compared with the other hMSCs, the number of cells after 96 hours was 3.7 to 5.2 times higher in epicardial fat, right atrium, subcutaneous fat, and pericardial fat hMSCs (Figure 1F, P<0.01).
Differentiation capability into osteoblast and adipocyte lineages was confirmed in representative hMSC samples from epicardial fat, pericardial fat, and right atrial tissue (Figure 2). Additionally, hMSCs from epicardial fat, pericardial fat, and right atrium were incubated with demethylating agent 5‐azacytidine and subsequently expressed myogenic proteins and early sarcomere formation (data not shown). Finally, to determine myogenic differentiation in vivo, hMSCs from epicardial fat (4×10⁶ cells) were injected into immunocompromised nude rat myocardium. One week after the injection, we identified the implanted cells by positive staining for antihuman mitochondria antibodies (data not shown). Rarely, early sarcomere formation was detected at the injection site after staining for human cardiac actin and α‐actinin (data not shown).
Figure 2.
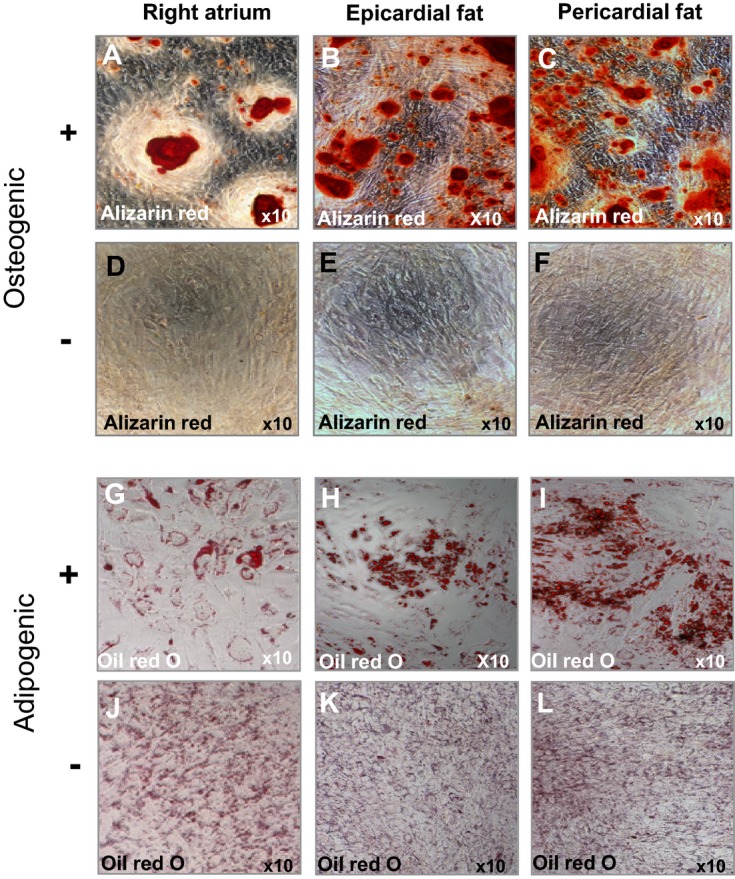
Multilineage differentiation capacity of hMSCs from different locations by in vitro differentiation assays. Representative hMSCs from right atrium and pericardial fat (n=1) and epicardial fat (n=3) induced to differentiate into adipogenic and osteogenic lineages. Positive staining for alizarin red (A through C) indicates osteogenic differentiation, compared with untreated hMSCs (D through F, respectively). Positive staining for Oil‐red O (G through I) indicates adipogenic differentiation, compared with untreated hMSCs (J through L, respectively). Bone marrow–derived hMSCs were used as positive controls (data not shown). hMSCs indicate human mesenchymal stromal cells.
Variability in Cytokine Secretion by hMSCs From Different Locations
MSCs are said to be effective through their trophic, immune‐modulating, anti‐inflammatory effects.2,18 To evaluate the differences in the cytokine secretion profiles, we measured the level of certain cytokines in the conditioned medium of cultured cells at passage 3. Significantly, hMSCs from the right atrium and epicardial fat secreted the highest amounts of trophic and proangiogenic factors, such as hepatocyte growth factor, basic fibroblast growth factor, and platelet‐derived growth factor, compared with other locations (Figure 3A through 3C; Table 3). In contrast, hMSCs from pericardial fat, subcutaneous fat, and BM secreted low amounts of hepatocyte growth factor, basic fibroblast growth factor, and PDGF (Figure 3A through 3C). The level of vascular endothelial growth factor from different hMSC locations was similar among groups (Figure 3D). Interestingly, we found that hMSCs from epicardial fat and the right atrium secreted the highest amounts of immunomodulatory cytokines such as tumor necrosis factor‐α (TNF‐α), tissue inhibitors of metalloproteinase 2, and interleukin (IL)‐13 (Figure 3E through 3G). On the other hand, the levels of IL‐6, which act as both a proinflammatory and an anti‐inflammatory cytokine, were high (above the measurement range) in all hMSC locations but not in the BM hMSCs (Figure 3H). Notably, BM hMSCs from healthy donors secreted the lowest amounts of cytokines but the highest amounts of tissue inhibitors of metalloproteinase 2 (Figure 3A through 3H). The amounts of tissue inhibitors of metalloproteinase 1 were high (above the range) in hMSCs from all locations even when diluted ×50 (Table 3).
Figure 3.
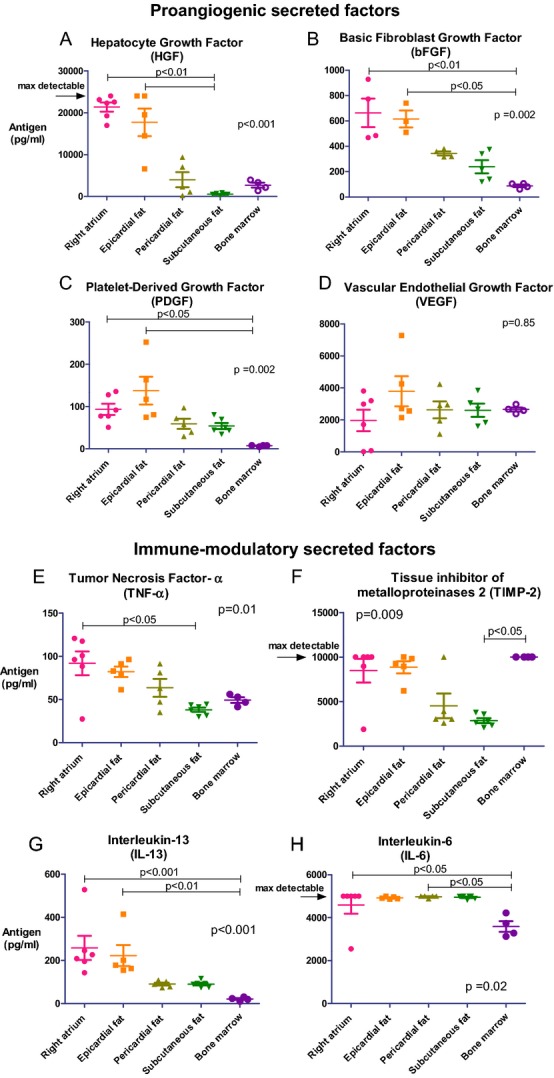
Different cytokine secretion by hMSCs from various locations. We measured the level of secreted cytokines in the conditioned medium collected from the cells at passage 3 by using multiplex ELISA. Overall, epicardial fat and right atrium hMSCs secreted higher levels of proangiogenic and immunomodulatory factors compared with pericardial fat, subcutaneous fat, and BM hMSCs (A through H; P values, calculated by Kruskal–Wallis test for all groups and by Dunn's post hoc test, are indicated in the graphs). Interleukin‐6 levels were high in all locations except for BM (H). BM indicates bone marrow; hMSCs, human mesenchymal stromal cells.
Table 3.
Cytokine Secretion by hMSCs From Different Locations With Multiplex ELISA (pg/mL)
| Cytokine | Right Atrium (n=6) | Epicardial Fat (n=5) | Pericardial Fat (n=5) | Subcutaneous Fat (n=6) | Bone Marrow (n=4) | P Value by Kruskal–Wallis |
|---|---|---|---|---|---|---|
| bFGF | 537±107.2* | 477.6±92.26* | 316±30.2 | 212.9±49.8 | 88.2±10.7*,* | 0.0068 |
| HGF | 21368±1095*,* | 17711±3289*,* | 3989±1790 | 546.3±99.1*,* | 2696±578.8 | 0.0005 |
| VEGF | 1967±668.9 | 3791±942.7 | 2629±525.7 | 2691±344.4 | 2654±123 | 0.8433 |
| PDGF | 93.4±13.3* | 137.6±32.8* | 59.08±11.9 | 53.9±7.2 | 7.08±0.7*,* | 0.002 |
| TIMP1 | 16000±0* | 16000±0* | 16000±0* | 16000±0* | 12507±781.6*,* | <0.0001 |
| TIMP2 | 8477±1328* | 8853±683.4* | 4516±1388 | 2869±274.7* | 10000±0*,* | 0.009 |
| TNF‐α | 91.88±13.8* | 82.13±6 | 63.5±10.4 | 38.1±2.5* | 49.3±3.2 | 0.011 |
| IL‐13 | 258.1±55.9* | 222.5±48.7* | 90.7±6.8 | 90.4±6.2 | 21.4±4.3*,* | 0.0003 |
| IL‐10 | 165.2±16.44 | 159.1±16.12 | 159.1±21.47 | 186.4±12.63* | 80.74±1.833* | 0.0307 |
| IL‐6 | 4591±409*,* | 4924±25.6* | 4976±23.6*,* | 4951±31.5* | 3591±31.4*,* | 0.024 |
bFGF indicates basic fibroblast growth factor; BM, bone marrow; HGF, hepatocyte growth factor; hMSCs, human mesenchymal stromal cells; IL, interleukin; PDGF, platelet‐derived growth factor; TIMP, tissue inhibitor of metalloproteinase; TNF‐α, tumor necrosis factor α; VEGF, vascular endothelial growth factor.
Right atrium vs BM (P<0.05).
Epicardial fat vs BM (P<0.05).
Right atrium vs subcutaneous fat (P<0.01).
Reached nondetectable concentrations.
Epicardial fat vs subcutaneous fat (P<0.01).
Epicardial fat vs BM (P<0.01).
BM vs all (P<0.001).
BM vs subcutaneous fat (P<0.05).
Right atrium vs subcutaneous fat (P<0.05).
Right atrium vs BM (P<0.001).
Pericardial fat vs BM (P<0.05).
Macrophage Polarization by hMSCs From Different Locations
MSCs can drive macrophages toward M2 anti‐inflammatory phenotypes.13 To determine the differences in hMSC‐induced M2 polarization, we cultured macrophages obtained from blood units of healthy young donors with hMSCs from different locations. The cells were separated by a transwell membrane for 72 hours, and macrophage polarization was assessed with a flow cytometer for M2 markers CD206+CD163+. The percentage of macrophages expressing M2 markers increased by 1.5‐ to 1.7‐fold after incubation with fat‐derived hMSCs but not with right atrial and BM hMSCs (Figure 4A; P=0.001 for all groups; P<0.05 between the groups; n=4 in each location). The greatest shift toward an M2 phenotype was found after incubation with hMSCs from pericardial, subcutaneous, and epicardial fat hMSCs (74.8±4.5%, 69.3±4.1%, and 69.2±4.7%).
Figure 4.
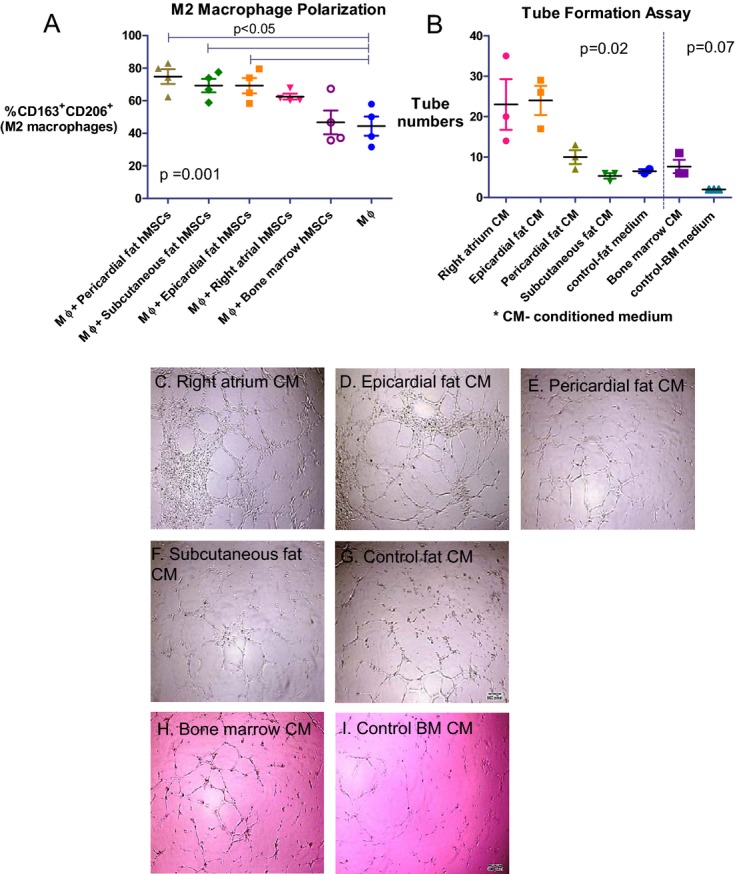
Diverse effects of hMSCs on macrophage polarization and angiogenesis. A, The effect of hMSCs on M2 macrophage polarization. hMSCs were co‐cultured with CD14+ macrophages, separated by a transwell membrane, and the macrophage phenotype was evaluated by immune‐staining for CD206+CD163+. The percentage of macrophages expressing M2 markers increased significantly after incubation with fat‐derived hMSCs but not with right atrial and BM hMSCs (P=0.001 for all groups; P<0.05 between the groups; n=4 in each location). B, The angiogenic effect of the conditioned medium from hMSCs was determined by quantification of the number of tubes with capillary‐like structures of HUVECs on Matrigel 8 hours after incubation with different conditioned media. The number of tubes was greater in the presence of conditioned medium from right atrial hMSCs and epicardial fat hMSCs compared with pericardial, subcutaneous fat, and control (P=0.02 for all groups, n=3 in each location). C through I, Representative microscopic images taken 8 hours after incubation of HUVECs with conditioned media from different hMSCs. BM indicates bone marrow; CM, conditioned medium; hMSCs, human mesenchymal stromal cells.; HUVECs, human umbilical vein endothelial cells; MΦ, macrophage.
hMSCs From Right Atrium and Epicardial Fat Induced the Greatest Angiogenic Effect In Vitro
To assess the angiogenic potential of hMSCs, we measured the number and structure of cords (“tubes”) in a Matrigel cord formation assay in representative hMSC samples from each location (Figure 4B through 4I). We found that the number of cords was 3.5 to 4.5 times greater in the presence of a conditioned medium from right atrial and epicardial fat hMSCs, compared with subcutaneous fat and controls (Figure 4B). Significantly, the number of cords in the BM hMSC wells was the lowest compared with right atrial and epicardial fat hMSCs (Figure 4B).
Variability in Gene Expression Profile of hMSCs From Different Locations
Analysis of gene expression profiles can contribute to the understanding of the variability and characteristics of hMSCs from different locations and their relationship to therapeutic potential and cardiovascular abnormalities. To confirm the different properties of hMSCs from diverse locations, we performed a preliminary, comparative gene expression analysis in hMSCs from right atrium, epicardial, pericardial, and sternal subcutaneous fat, from the same patient. Indeed, our preliminary findings indicated variability in gene expression of hMSCs from different locations (Figure 5A). Analysis of 9237 (of 21 855) genes with relative gene expression >−0.1‐fold and <0.1‐fold revealed similarity in gene expression profile between hMSCs from subcutaneous and pericardial fat (r=0.98, P<0.0001, Figure 5B) and less similarity between subcutaneous and right atrial hMSCs (r=0.90, P<0.0001, Figure 5C). Compared with subcutaneous hMSCs, the number of genes with relative expression >2‐fold and <−2‐fold was smallest for hMSCs from pericardial fat (53 genes, Figure 5B) and highest for epicardial (200 genes) and right atrial hMSCs (395 genes) (Figure 5C and 5D, respectively). Thus, hMSCs from subcutaneous and pericardial fat share similar gene expression profiles, whereas right atrial and epicardial hMSCs exhibited the most distinct profile.
Figure 5.
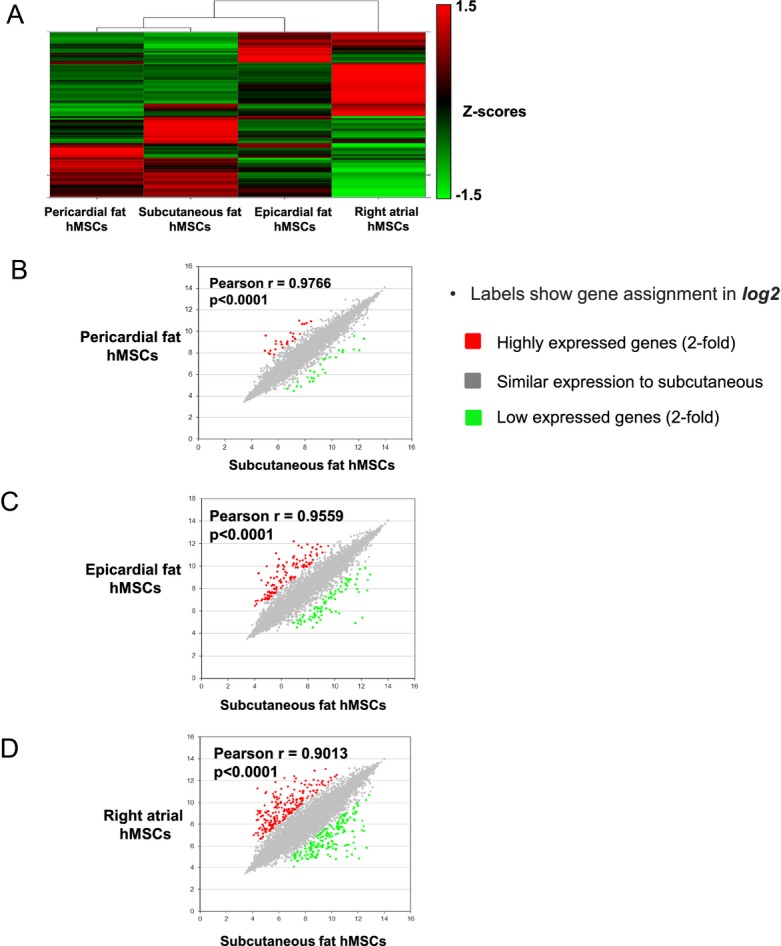
Gene expression of hMSCs from different locations. A, Heat maps of microarray data: each column represents a different location of hMSCs, with columns arranged in clusters by similarity. Normalized data presented as Z scores. B through D, Pearson correlation analysis of gene expression profiles of hMSCs from subcutaneous fat (in horizontal axis) compared with B, pericardial fat hMSCs (vertical axis), C, epicardial fat hMSCs (vertical axis) and D, right atrium hMSCs (vertical axis). Labels show gene assignment (in log2). The colors indicate above and below 2‐fold change compared to subcutaneous fat hMSCs: red, upregulated genes; green, downregulated genes; gray, similar expression to subcutaneous. hMSCs indicate human mesenchymal stromal cells.
Remarkably, hMSCs from the right atrium and epicardial fat appear to be highly enriched in inflammatory and immune‐related genes (Tables 4 and 5). For example, 36 genes above the indicated threshold (2‐fold) were identical to hMSCs from both the right atrium and epicardial fat, and some of them are related to immunomodulation, inflammation, and differentiation, such as IL‐1β, Toll‐like receptor 4 (TLR4), intercellular adhesion molecule 1 (ICAM1), transforming growth factor‐β2 (TGFβ2), complement component 3 (C3), and TNF receptor superfamily 21 (TNFRSF21) (Tables 4 and 5). Interestingly, hMSCs from the right atrium and epicardial fat expressed genes of transcriptional factor, such as GATA binding protein 4(GATA4) and bone morphogenetic protein 4 (BMP4), consistent with their reported myogenic differentiation capacity. Identical genes that exhibited low expression in both hMSCs from right atrial and epicardial fat (31 genes below the indicated threshold) included cell growth regulation genes such as wingless‐type MMTV integration site family 5A (Wnt‐5a) and lymphocyte antigen 6K (LY6K) (Tables 4 and 5).
Table 4.
High and Low Expressed Genes in Right Atrial hMSCs Compared With Subcutaneous Fat hMSCs
| Gene Name | Full Name | Function | Fold Change |
|---|---|---|---|
| Highly expressed genes in right atrial hMSCs compared with subcutaneous fat hMSCs | |||
| TGFB2 | Transforming growth factor‐β2 | Suppressive effects on T‐cell growth | 5.21 |
| C3 | Complement component 3 | Plays a central role in the activation of the complement system | 4.17 |
| CFB | Complement factor B | Regulation of the immune reaction | 3.71 |
| IL1B | Interleukin 1β | Mediators of inflammatory response | 3.47 |
| IL32 | Interleukin 32 | Induces the production of TNFα and IL‐8 from macrophages | 3.37 |
| TLR4 | Toll‐like receptor 4 | Leads to cytokine secretion and inflammatory responses. | 3.21 |
| CSF3 | Colony stimulating factor 3 | Controls production, differentiation, and function of granulocytes | 3.18 |
| ICAM1 | Intercellular adhesion molecule 1 | Leukocyte adhesion and migration | 3.08 |
| GATA4 | GATA binding protein 4 | Involved in myocardial differentiation and function | 3.01 |
| CFH | Complement factor H | Regulation of the immune reaction | 3.00 |
| BMP4 | Bone morphogenetic protein 4 | Growth and differentiation factor | 2.90 |
| TNFA‐IP3 | Tumor necrosis factor‐α–induced protein 3 | Involved in cytokine‐mediated immune and inflammatory responses | 2.72 |
| TNFAIP6 | Tumor necrosis factor‐α–induced protein 6 | Associated with cell–cell and cell–matrix interactions during inflammation | 2.63 |
| GDF15 | Growth differentiation factor 15 | Upregulated on stress, biomarkers of heart damage, inhibits macrophages. | 2.26 |
| TNFRSF21 | Tumor necrosis factor receptor superfamily21 | Induces cell apoptosis, involved in inflammation and immune regulation | 2.22 |
| CXCL6 | Chemokine (C‐X‐C motif) ligand 6 | Chemotactic for neutrophil granulocytes | 2.10 |
| CXCL12 | Chemokine (C‐X‐C motif) ligand 12 | Chemoattractant active on T cells and monocytes, protective role after myocardial infarction | 2.10 |
| BMP6 | Bone morphogenetic protein 6 | Growth and differentiation factor | 2.08 |
| Low expressed genes in right atrial hMSCs compared with subcutaneous fat hMSCs | |||
| IL13RA2 | Interleukin 13 receptor α2 | Plays a role in the internalization of IL‐13 | −4.87 |
| CCRL1 | Chemokine (C‐C motif) receptor‐like 1 | Receptor for C‐C type chemokines | −4.07 |
| KITLG | KIT ligand, stem cell factor | Ligand of the c‐kit receptor, stem cell maintenance | −3.47 |
| CD109 | CD109 molecule | Modulates negatively TGFβ1 signaling | |
| WNT5A | Wingless‐type MMTV integration site family 5A | Activation of noncanonical Wnt signaling, inhibition of canonical Wnt signaling | −3.07 |
| FGF7 | Fibroblast growth factor 7 | Regulation of cell proliferation and differentiation | −2.86 |
| CLU | Clusterin | Protects cells against apoptosis, regulates cell proliferation | −2.84 |
| TGFBR3 | Transforming growth factor‐β receptor III | Binds to TGFβ | −2.77 |
| LY6K | Lymphocyte antigen 6K | May play a role in cell growth | −2.56 |
hMSCs indicate human mesenchymal stromal cells; TGF, transforming growth factor; IL, interleukin.
Table 5.
High and Low Expressed Genes in Epicardial Fat hMSCs Compared With Subcutaneous Fat hMSCs
| Gene Name | Full Name | Function | Fold Change |
|---|---|---|---|
| Highly expressed genes in epicardial fat hMSCs compared with subcutaneous fat hMSCs | |||
| HGF | Hepatocyte growth factor | Growth factor for a broad spectrum of tissues and cell types | 4.10 |
| BMP4 | Bone morphogenetic protein 4 | Growth and differentiation factor | 3.89 |
| GATA4 | GATA binding protein 4 | Involved in myocardial differentiation and function | 3.82 |
| C3 | Complement component 3 | Plays a central role in the activation of complement system | 3.20 |
| TGFB2 | Transforming growth factor‐β2 | Suppressive effects on T‐cell growth | 3.03 |
| TNFRSF21 | Tumor necrosis factor receptor superfamily 21 | Induces cell apoptosis, involved in inflammation and immune regulation | 2.83 |
| CFH | Complement factor H | Regulation of the immune reaction | 2.758 |
| IL33 | Interleukin 33 | Induces T‐helper type 2–associated cytokines | 2.177 |
| Low expressed genes in epicardial fat hMSCs compared with subcutaneous fat hMSCs | |||
| WNT5A | Wingless‐type MMTV integration site family 5A | Activation of noncanonical Wnt signaling, inhibition of canonical Wnt signaling | −2.91 |
| IL13RA2 | Interleukin 13 receptor, α2 | Plays a role in the internalization of IL‐13 | −2.49 |
| CXCL5 | Chemokine (C‐X‐C motif) ligand 5 | Involved in neutrophil activation | −2.39 |
| LY6K | Lymphocyte antigen 6K | May play a role in cell growth | −2.06 |
hMSCs indicate human mesenchymal stromal cells; IL, interleukin.
On the other hand, gene expression was similar in pericardial and subcutaneous fat. Of interest, the TLR3 gene was upregulated and the inflammatory cytokine IL‐1β was downregulated in hMSCs from pericardial compared with subcutaneous fat (Table 6), supporting the anti‐inflammatory phenotype of pericardial hMSCs.
Table 6.
High and Low Expressed Genes in Pericardial Fat hMSCs Compared With Subcutaneous Fat hMSCs
| Gene Name | Full Name | Function | Fold Change |
|---|---|---|---|
| Highly expressed genes in pericardial fat hMSCs compared with subcutaneous fat hMSCs | |||
| TLR3 | Toll‐like receptor 3 | Leads to cytokine secretion and inflammatory response. | 2.22 |
| Low expressed genes in pericardial fat hMSCs compared with subcutaneous fat hMSCs | |||
| IL1B | Interleukin 1β | Mediators of inflammatory response | −3.44 |
hMSCs indicate human mesenchymal stromal cells.
Together, the data suggest that hMSCs from different locations express distinct gene profiles, reflecting their location, function, and therapeutic potential. Subcutaneous and pericardial hMSCs are more closely related than are hMSCs from the right atrium and epicardial fat. These variations confirmed differences in the therapeutic potential of hMSCs from different locations.
Variability in hMSC Grafts, Infarct Vascularization, and Inflammation
Vascularization and inflammation are key components of infarct repair. To assess the angiogenic and anti‐inflammatory effect of hMSC transplantation, we evaluated cell survival, vessel density, and inflammation 27 days after cell transplantation in the infarcted myocardium of rat. We mixed the injected cells with Matrigel to improve retention of the implanted cells. We allocated rats to 6 treatment groups 7 days after MI: (1) right atrial hMSCs in Matrigel (n=9), (2) epicardial fat hMSCs in Matrigel (n=10), (3) subcutaneous fat hMSCs in Matrigel (n=9), (4) BM hMSCs in Matrigel (n=8), (5) Matrigel (n=11), and (6) saline (n=10). To avoid any potential harmful effects on infarct healing, inflammation, and macrophage function, we did not use immunosuppression in this transplantation experiment.
To determine the survival of implanted hMSCs in the infarcted myocardium, we stained heart sections with antihuman mitochondria antibodies 27 days after transplantation. Cell grafts were the largest in representative sections of the hearts treated with hMSCs from subcutaneous fat (Figure 6A1 through 6A6). Positive human mitochondrial staining was identified in cell clusters rather than vessel walls. Notably, while the grafts of implanted hMSCs from right atrial and BM hMSCs seemed smaller than subcutaneous fat hMSCs, a few cells migrated to the remote myocardium (Figure 6B1 and 6B2). Furthermore, in some right atrial hMSC grafts, we noticed typical striation and early sarcomere formation, suggesting early myogenic differentiation or cell fusion (Figure 6B3). Human mitochondria staining was negative in control saline‐ and Matrigel‐treated hearts (Figure 6A5 through 6A6).
Figure 6.
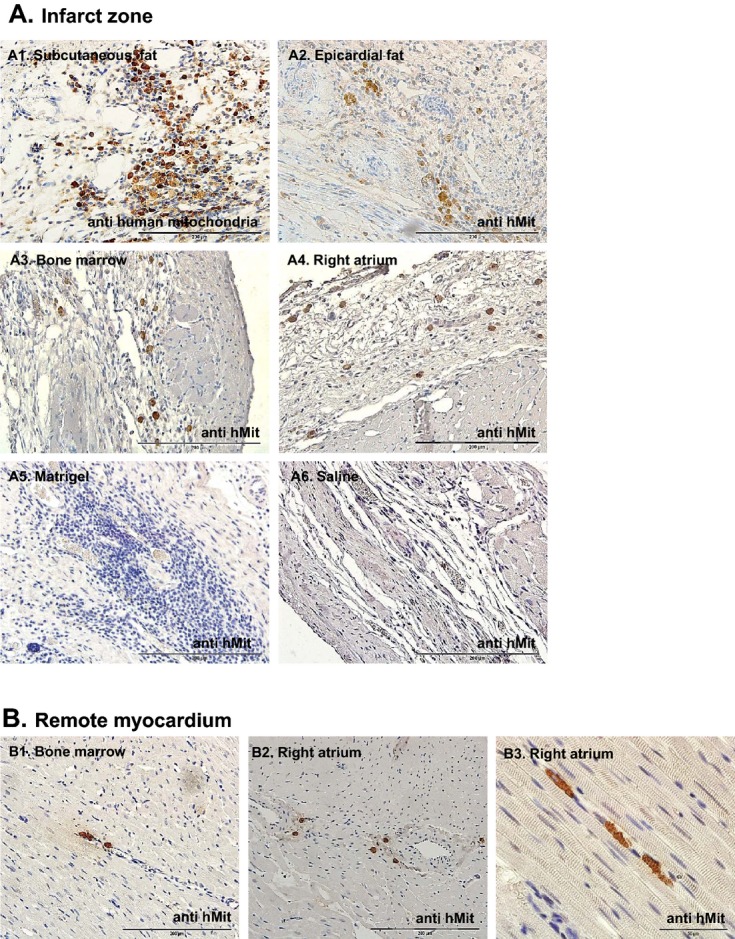
hMSC grafts in the infarcted myocardium 27 days after transplantation in rat. To determine the survival of implanted hMSCs in the infarcted myocardium, we stained heart sections with anti‐human mitochondria antibodies 27 days after transplantation. A1 through A6, Representative microscopic images of the infarct zone. Cell grafts were largest in the heart sections treated with subcutaneous fat hMSCs (A1) and smallest in BM and right atrial hMSC‐treated hearts (A3 and A4), while control groups (saline‐ and Matrigel‐treated hearts) were negative for human mitochondria staining (A5 and A6). B1 through B3, Representative microscopic images from the remote myocardium indicate cell migration (B1 and B2) and in some cases typical striation and early sarcomere formation (B3). BM indicates bone marrow; hMit, human mitochondria immunostaining; hMSCs, human mesenchymal stromal cells.
The capillary number per mm2 was 60% to 140% higher in cell‐treated groups compared with the saline‐treated group (P=0.02; Figure 7). Consistent with the findings of in vitro cytokine arrays and angiogenic assays, right atrial hMSCs induced the highest capillary density (612.4±102.2 mean vessel/mm2) that was 2.4 times greater than the saline‐treated group (253.5±49.9 mean vessel/mm2, P<0.05) (Figure 7).
Figure 7.
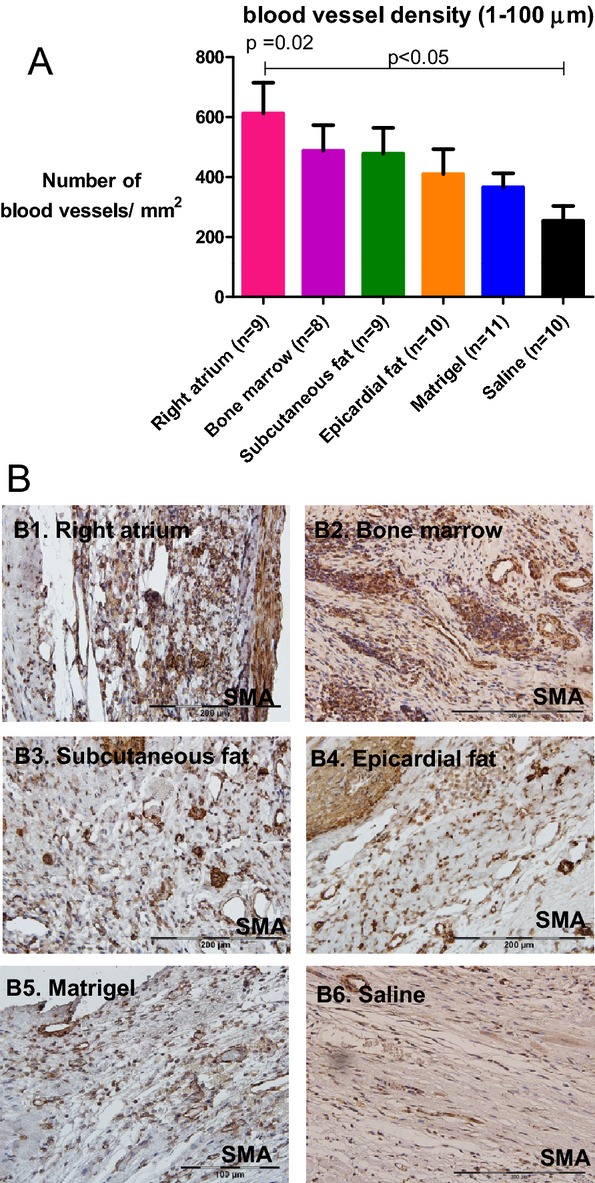
Diverse vascularization effect of hMSCs from different locations after transplantation in rats. A, Vessel density was determined by the number of smooth muscle actin positive vessels per mm2 in the infarct zone of the different groups (3 sequential pictures were taken per rat). B1 through B6, Representative microscopic images from each group. Vessel density was greater in rats treated with right atrial hMSCs 27 days after injection compared with saline‐treated rats (P=0.02 for all groups; P<0.05 for right atrium vs. saline). Data are means±SEM. hMSCs indicate human mesenchymal stromal cells.
Remarkably, transplantation of hMSCs from all locations increased the inflammatory response in the infarct zone compared with the saline‐treated group. We noticed inflammatory infiltrates, particularly macrophages, at the site of hMSCs and Matrigel injection 27 days after transplantation (Figure 8A and 8B). Inflammation scores in 3 random fields of hearts treated with right atrial hMSCs, epicardial fat hMSCs, BM hMSCs, and Matrigel were 1.9‐fold higher than saline‐treated hearts (Figure 8A; P<0.05). Macrophage accumulation in the infarcted tissue was calculated as a percentage of positive ED1 staining. While hMSCs from the right atrium, epicardial fat, and Matrigel were associated with the greatest macrophage accumulation (3.9, 3, and 3.8 times higher compared with saline, P<0.05), it was lowest after treatment with saline, BM hMSCs, and subcutaneous fat hMSCs (Figure 8C and 8D). Together, these findings suggest that while hMSCs from the right atrium and epicardial fat induced the greatest proinflammatory effects, hMSCs from subcutaneous fat induced the smallest.
Figure 8.

Inflammation and macrophage infiltration to the infarct 27 days after transplantation in rats. To examine the degree of inflammatory cell infiltration, heart sections were stained with hematoxylin and eosin, and microscopic findings were graded according to the score index in the figure. Three sections were obtained per heart; the mean score of the 3 sections was recorded as the microscopic score for that rat. A, Microscopic score. B1 through B6, Representative microscopic images from each group. hMSCs from right atrium, BM, and Matrigel increased the extent of inflammatory cells in the infarct zone and their inflammation scores were significantly higher compared with the saline group (P<0.05), while subcutaneous fat hMSCs had the lowest inflammation score (P=0.004 for all groups). C, Macrophage infiltration was determined by the percentage of area stained for ED1 in the infarct zone in the different groups (3 sequential pictures were taken per rat). D1 through D6, Representative microscopic images from each group. Macrophage infiltration into the infarct zone of hearts treated with the right atrial hMSCs, epicardial hMSCs, and Matrigel groups was significantly higher compared with BM hMSCs and saline groups (P<0.0001 for all groups). While the subcutaneous fat group exhibited noticeable macrophage infiltration, it was not significant when compared with saline. BM indicates bone marrow; hMSCs, human mesenchymal stromal cells; MΦ, macrophage.
Effects of hMSCs From Different Locations on LV Remodeling and Function
One of the most meaningful effects of cell therapy is the ability to produce functional benefit after transplantation into the infarcted heart. To test the effect of different hMSCs on cardiac remodeling and function after MI, rats were evaluated through serial echocardiography studies. The LV end‐diastolic dimension and area and LV end‐systolic dimension and area were increased in all 6 groups at 27 days after cell transplantations (Table 7). Surprisingly, hMSC treatment did not improve remodeling after MI. Furthermore, in contrast to the in vitro findings, which highlighted the angiogenic potential of right atrial and epicardial fat hMSCs, LV dilatation was greatest within these groups and smallest in the subcutaneous fat group 27 days after treatment (Figure 9, Table 7). For example, LV end‐diastolic area and LV end‐systolic area increased by 86% and 84% (right atrial hMSCs, Figure 9A and 9B) and by 56% and 61% (epicardial fat hMSCs, Figure 9A and 9B), respectively. On the other hand, hMSCs from subcutaneous fat induced the smallest change in LV areas and diameters (Figure 9A and 9B, Table 7). Importantly, the advantage of hMSCs from subcutaneous fat was reflected in attenuation of LV dysfunction as calculated by fractional area change (change from baseline percentage) compared with Matrigel, saline, BM, right atrium, and epicardial fat (Table 7, Figure 9C). Thus, subcutaneous fat hMSCs were the most effective in the prevention of LV dysfunction after MI.
Table 7.
Effect of hMSCs From Different Locations on LV Remodeling and Function After MI by 2‐Dimensional Echocardiography in Rat
| Right Atrium (n=9) | Epicardial Fat (n=10) | Subcutaneous Fat (n=9) | Bone Marrow (n=8) | Matrigel (n=11) | Saline (n=10) | P for Treatment Effect by 2 Way Repeated Measure ANOVA | |
|---|---|---|---|---|---|---|---|
| LVSD, mm | |||||||
| Baseline | 6±0.3 | 5.6±0.3 | 5.6±0.2 | 5.9±0.3 | 5.9±0.2 | 6.19±0.1 | NS |
| Day 34 | 8.1±0.4 | 7±0.3 | 6.7±0.3 | 7.6±0.4 | 7.3±0.2 | 7.5±0.3 | 0.2 |
| P by paired t test | <0.0001 | 0.0004 | 0.0005 | 0.0007 | <0.0001 | <0.0001 | |
| LVDD, mm | |||||||
| Baseline | 7.27±0.2 | 6.7±0.3 | 7.1±0.2 | 7.7±0.3 | 7.3±0.2 | 7.6±0.2 | NS |
| Day 34 | 9.5±0.31 | 8.6±0.3 | 8.4±0.2 | 9.2±0.4 | 8.9±0.1 | 8.9±0.3 | 0.146 |
| P | <0.0001 | <0.0001 | 0.0005 | 0.0002 | <0.0001 | <0.0001 | |
| LVDA, cm2 | |||||||
| Baseline | 27.4±2.5 | 24±2 | 22.3±2.2 | 28.2±2.7 | 26.3±1.8 | 29.5±1.3 | NS |
| Day 34 | 48.1±4.5 | 39.2±2.9 | 30.1±2.9 | 45.27±5.8 | 39.7±2.8 | 41.5±2.8 | 0.06 |
| P | 0.0001 | <0.0001 | 0.0011 | 0.0010 | <0.0001 | 0.0004 | |
| LVSA, cm2 | |||||||
| Baseline | 43±2 | 39.8±2.4 | 37±1.9* | 45.3±2.7 | 42.3±2.1 | 44.7±0.9* | NS |
| Day 34 | 65.9±4.7*,* | 56.9±3.2 | 49±3*,*,* | 63.2±5.2* | 59.3±2.2* | 56.6±2.8* | 0.035 |
| P | <0.0001 | <0.0001 | 0.0022 | 0.0061 | <0.0001 | 0.0005 | |
| FS,% | |||||||
| Baseline | 17.9±2.5 | 17.3±1.8 | 20.8±2 | 22.2±1 | 16.7±2.7 | 17.2±1.3 | NS |
| Day 34 | 15.5±1.8 | 17.2±1.2 | 20.7±1.9 | 17.4±1.8 | 17.9±2.1 | 16.4±1.3 | 0.518 |
| P | 0.1940 | 0.9942 | 0.9575 | 0.0515 | 0.7969 | 0.4616 | |
| FAC,% | |||||||
| Baseline | 36.8±3.9 | 40.2±2.9 | 40.9±3.7 | 38.4±2.8 | 37.8±3.1 | 33.2±2.2 | NS |
| Day 34 | 27.7±2 | 31.5±2.6 | 39.7±3.1 | 30.2±3.6 | 33.6± 2.8 | 27.±21 | 0.1 |
| P | 0.0024 | 0.0005 | 0.5914 | 0.0754 | 0.0788 | 0.0078 | |
| AW s, mm | |||||||
| Baseline | 1.3±0.1 | 1.3±0.1 | 1.3±0.1 | 1.5±0.1 | 1.3±0.1 | 1.4±0.1 | NS |
| Day 34 | 0.97±0.05 | 1.2±0.06 | 1.2±0.1 | 1.3±0.09 | 1.14±0.06 | 1.16±0.1 | 0.45 |
| P | 0.0001 | 0.3574 | 0.0763 | 0.1660 | 0.0798 | 0.0054 | |
| AW d, mm | |||||||
| Baseline | 1.2±0.1 | 1.2±0.1 | 1.3±0.1 | 1.3±0.1 | 1.2±0.05 | 1.3±0.1 | NS |
| Day 34 | 0.86±0.04 | 1.07±0.05 | 1.06±0.08 | 1.15±0.08 | 1.04±0.07 | 0.99±0.07 | 0.53 |
| P | <0.0001 | 0.3105 | 0.0053 | 0.1210 | 0.0434 | 0.0001 | |
Baseline measurements were obtained 6 days after MI, 1 day before therapy. P values in the left column are for the differences between baseline (day 6 after MI before treatment) and day 34 measurements (paired t test). Probability values in the right column reflect comparison of the differences between treatment and control groups over time. (2‐way repeated‐measures ANOVA with Bonferroni's multiple‐comparison posttest). AW d indicates anterior wall diastolic thickness; AW s, anterior wall systolic thickness; FAC, fractional area change=[(LVDA−LVSA)/LVDA]×100; FS, fractional shortening=[(LVDD−LVSD)/LVDD]×100; hMSCs, human mesenchymal stromal cells; LVDA, left ventricular end‐diastolic area; LVDD, left ventricular end‐diastolic dimension; LVSA, left ventricular end‐systolic area; LVSD, left ventricular end‐systolic dimension; NS, not significant.
Subcutaneous fat vs saline (P<0.05).
Right atrium vs saline (P<0.05).
Right atrium vs subcutaneous fat (P<0.001).
Subcutaneous fat vs Matrigel (P<0.05).
Subcutaneous fat vs bone marrow (P<0.01).
Figure 9.
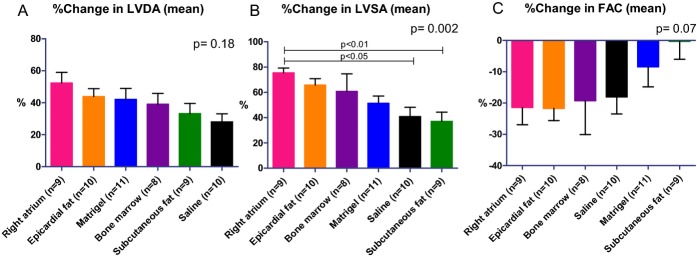
Diverse effects of hMSCs from different locations on LV remodeling and function in a rat model of MI. Percentage of changes in echocardiography measurements. hMSCs from different locations, mixed with Matrigel or Matrigel alone or saline, were injected into the infarcted heart 7 days after MI. Echocardiography studies were done 6 (baseline, before transplantation) and 34 days after MI. While subcutaneous fat hMSCs preserved LV diastolic (A) and systolic (B) area, right atrial hMSCs increased it (B, P<0.05). Significantly, hMSCs from subcutaneous fat attenuated LV dysfunction as indicated by change in FAC (C). P values for all groups by Kruskal–Wallis. FAC indicates fractional area change; hMSCs, human mesenchymal stromal cells.; LAD, left anterior descending coronary artery; LV, left ventricle; LVDD, left ventricular end‐diastolic dimension; LVSD, left ventricular end‐systolic dimension.
The varying effects of hMSCs from different locations on LV remodeling were partially confirmed by postmortem morphometric analysis (Table 8). Remarkably, hMSCs from the right atrium aggravated scar thinning and decreased LV muscle area (Table 8).
Table 8.
Effect of Various hMSCs on Cardiac Remodeling by Post‐mortem Morphometric Analysis in Rat
| Right Atrium (n=9) | Epicardial Fat (n=10) | Subcutan Fat (n=9) | Bone Marrow (n=8) | Matrigel (n=11) | Saline (n=10) | P Value by ANOVA | |
|---|---|---|---|---|---|---|---|
| Average wall thickness, mm | 1.17±0.06 | 1.37±0.08 | 1.22±0.08 | 1.57±0.13 | 1.44±0.09 | 1.53±0.12 | 0.03 |
| Average scar thickness, mm | 0.71±0.06 | 0.96±0.12 | 0.82±0.1 | 0.76±0.08 | 0.82±0.07 | 0.67±0.09 | 0.29 |
| Relative scar thickness | 62.16±6.3 | 67.22±7.8 | 70.18±7.6 | 50.80±6.5 | 56.69±4.3 | 47.21±7.4 | 0.10 |
| LV cavity area, mm2 | 40.40±3.6 | 38.12±4 | 41.93±3.4 | 32.49±5.3 | 38.46±3.7 | 33.31±2 | 0.42 |
| Whole LV area, mm2 | 69.07±4.1 | 68.53±3.7 | 75.66±3.3 | 61.25±5.8 | 74.61±3.5 | 61.62±2.3 | 0.04 |
| Muscle area, mm2 | 28.67±1.2* | 30.41±2.1 | 33.73±2.1 | 28.76±0.9* | 28.32±0.7* | 36.15±1.7*** | 0.002 |
| Expansion index | 1.03±0.1 | 0.94±0.1 | 0.88±0.1 | 1.24±0.3 | 1.03±0.1 | 1.20±0.1 | 0.59 |
| Scar area, mm2 | 6.95±1.1 | 5.24±0.6 | 6.14±0.8 | 6.17±0.5 | 8.10±0.5 | 6.16±1 | 0.23 |
| Relative scar area | 24±3.4 | 17.64±2.2 | 19.04±3 | 21.27±1.4 | 22.13±1.8 | 21.84±2.5 | 0.55 |
Average wall thickness was averaged from 3 measurements of septum thickness. Average scar thickness was averaged from 3 measurements of scar thickness. Relative scar thickness is determined by average scar thickness divided by average wall thickness. Expansion index is found as follows: (left ventricular [LV] cavity area/whole LV area)/relative scar thickness. Muscle area is determined by reduction of LV cavity area from whole LV area. Relative scar area is determined by average scar area divided by average muscle area. The difference between means of groups was compared by using ANOVA with Bonferroni's multiple comparison posttest. hMSCs indicate human mesenchymal stromal cells.
Right atrium vs saline (P<0.05).
Saline vs bone marrow (P<0.05).
Matrigel vs saline (P<0.01).
To confirm the results in rats and to avoid any potential bias from immune response and graft rejection, we repeated the transplantation study in immunocompromised nude mice. To refrain from interdonor variability, various hMSCs were obtained from different locations of a single patient with diabetes mellitus, significant coronary artery disease, and severe aortic stenosis. Indeed, the echocardiography findings (Figure 10A through 10D) have confirmed the results from the rat study. Particularly, the therapeutic advantage of subcutaneous fat MSCs (from a cardiac patient) over right atrium and epicardial MSCs was demonstrated again by smaller LV diastolic and systolic volumes and greater ejection fraction and scar thickness (Figure 10A through 10D). Due to large variability and a relatively large number (n=5) of treatment groups, these differences did not reach statistical significance. However, to improve our ability to detect delicate differences in regional cardiac function, we used speckle‐tracking–based strain imaging. Compared with conventional echocardiographic imaging, speckle‐tracking–based strain echocardiography efficiently detects early differences in response to treatment.16 Indeed, the therapeutic advantage of hMSCs from subcutaneous fat was clearly demonstrated by LV speckle‐tracking–based longitudinal strain analysis (Figure 11A through 11C). hMSCs from subcutaneous fat improved regional function (peak strain percentage) at the cell implantation site, at the infarct‐related, mid‐anterior segment, 28 days after MI (Figure 11B). Regional function at the apical segment was not affected by cell therapy (Figure 11C).
Figure 10.
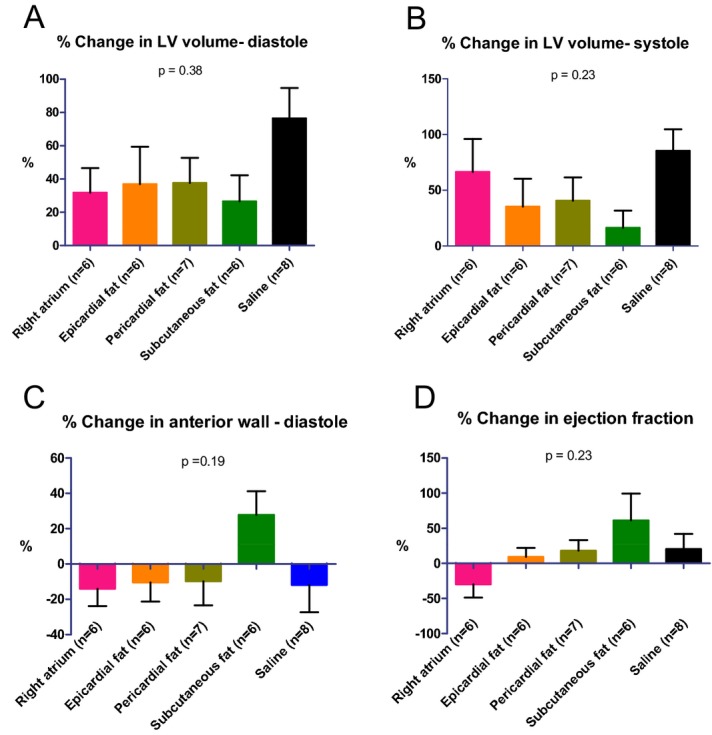
Diverse effects of hMSCs from different locations on LV remodeling and function in an immunocompromised nude mouse after MI. Percentage of changes in echocardiography measurements. hMSCs from different locations or saline were injected into the infarcted heart immediately after MI. Echocardiography studies were done 1 (baseline) and 28 days after MI. LV diastolic (A) and systolic (B) volumes were smallest, and scar thickness (C) and ejection fraction (D) were greatest in the animals treated with hMSCs from subcutaneous fat. P values for all groups by Kruskal–Wallis. hMSCs indicates human mesenchymal stromal cells; LV, left ventricle.
Figure 11.
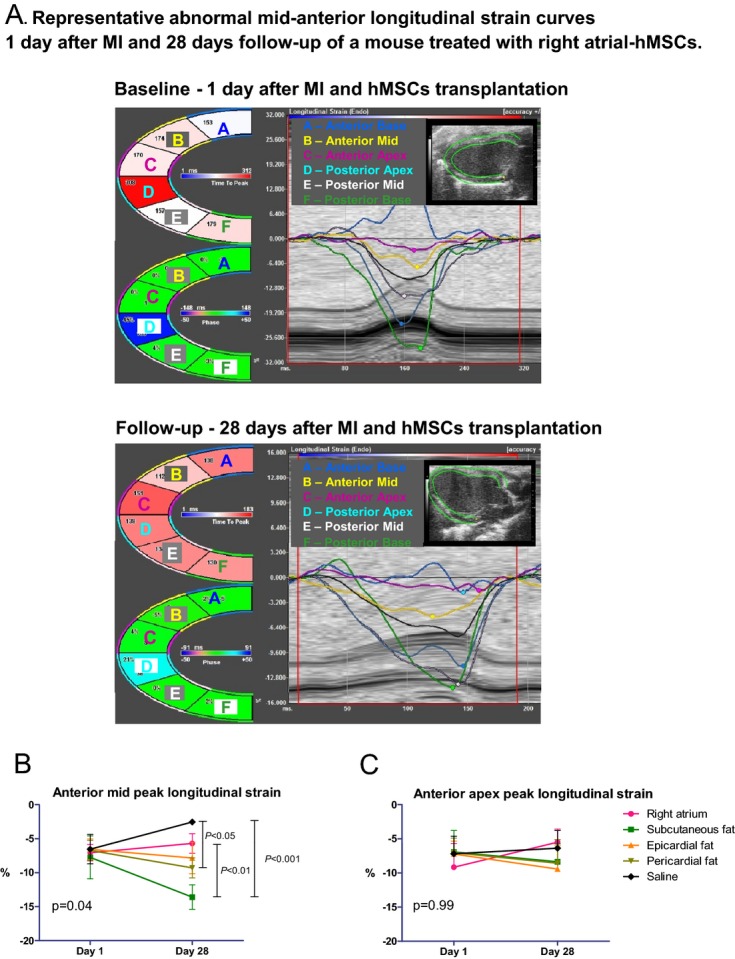
Diverse effects of hMSCs from different locations on LV function by speckle‐tracking–based strain analysis in a parasternal long‐axis view in immunocompromised nude mice. A, Regional strain curves are altered in a typical way at day 1 and 28 days after MI and right atrial hMSC transplantation. B, hMSCs from subcutaneous and pericardial fat improved regional function at the infarct‐related territory, compared with saline and hMSCs from the right atrium, by longitudinal peak strain analysis of the anterior mid segment. C, hMSCs did not significantly improve regional function at the anterior apical segment by peak longitudinal strain analysis. hMSCs indicates human mesenchymal stromal cells; LV, left ventricle.
Post‐mortem morphometric analysis showed that relative scar thickness was smallest and expansion index greatest in the saline‐treated mice; however, these differences did not reach statistical significance (data not shown).
Notably, there was a mild positive correlation between means of TNF‐α and hepatocyte growth factor secretion in vitro and adverse LV dilatation, measured as change in LV end‐systolic area, before and 27 to 28 days after hMSC transplantation (Figure 12A through 12B). In addition, there was a negative correlation between the means of TNF‐α secretion and change in LV ejection fraction (Figure 12C).
Figure 12.
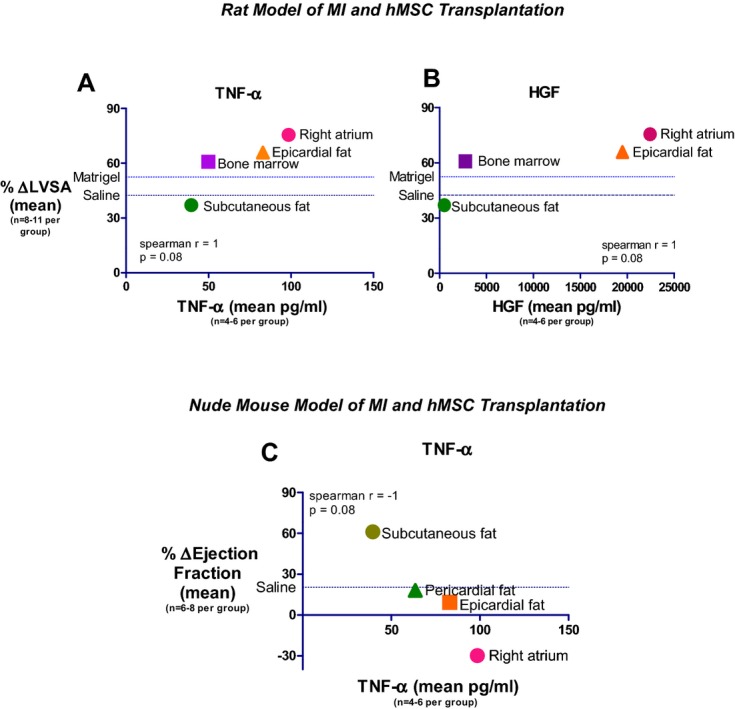
Correlation between hMSC TNF‐α or HGF levels and echocardiography parameters. A and B, A high correlation between the secretion of MSC TNF‐α (A) and HGF (B) in vitro and LV end systolic area after MSC transplantation in a rat model of MI. C, Inverse correlation between the secretion of MSC TNF‐α in vitro and ejection fraction after MSC transplantation in nude mouse model of MI. HGF indicates hepatocyte growth factor; hMSCs, human mesenchymal stromal cells.; LV, left ventricular; LVSA, left ventricular end‐systolic area; MI, myocardial infarction; TNF‐α, tumor necrosis factor‐α.
Discussion
The major new findings of the present study include several unexpected results that could be relevant to the use of hMSCs for cardiovascular regenerative medicine and expand our knowledge of the pathogenesis of cardiovascular diseases. Our study is the first to compare the reparative properties of hMSCs from visceral and subcutaneous fat. We found that hMSCs from different locations have both distinct characteristics and different reparative properties. Significantly, while right atrial and epicardial fat hMSCs secrete the highest amounts of angiogenic, trophic, and inflammatory cytokines, subcutaneous fat hMSCs secrete the lowest. Notably, whereas right atrial and epicardial fat hMSCs induced the highest angiogenic effect, in vitro and in vivo, they also elicited the highest inflammation score in the infarcted heart, compared with subcutaneous fat hMSCs. Importantly, despite the higher amounts of trophic and angiogenic cytokine secretion, the effect of hMSCs from right atrial and epicardial fat hMSCs on cardiac remodeling and function was inferior to subcutaneous fat hMSCs. This unexpected finding was confirmed in rat and immunocompromised nude mouse and is most likely related to the proinflammatory characteristics of hMSCs from the right atrium and epicardial fat. Indeed, the magnitude of LV dilatation and dysfunction was correlated with the amount of TNF secretion from hMSCs in vitro.
The importance of our findings is that they could guide the selection of different hMSCs for regenerative medicine and tissue engineering. Cardiac fat hMSCs, particularly from cardiac patients, secret cytokines that could affect the initiation and progression of various cardiovascular pathologies associated with inflammation, angiogenesis, and fibrosis. Thus, the high levels of inflammatory cytokines secreted by hMSCs from the right atrium and epicardial fat, obtained from cardiac patients, might limit their application in regenerative medicine. This could be particularly significant in patients with diabetes mellitus using MSCs with limited multipotency and impaired reparative power.19 On the other hand, subcutaneous fat hMSCs, with anti‐inflammatory properties, could be used for infarct repair and immunomodulation.
Diversity of hMSCs From Different Adipose Tissues
Our original hypothesis was that hMSCs from epicardial fat would produce a better reparative effect due to their proximity to the heart.9 The robust production of diverse paracrine factors by cardiac hMSCs supported our original hypothesis that these cells would be better therapeutic tools for infarct repair. However, contrary to our expectations, we observed a better therapeutic effect of subcutaneous fat hMSCs on cardiac function, despite their lower amount of angiogenic and trophic cytokine secretion. These findings matched previous reports suggesting that the location of fat tissue influences its biological effects.20–22 Observations in human patients have suggested a possible protective role for subcutaneous but not visceral fat. While the accumulation of visceral fat is associated with increased prevalence of insulin resistance, metabolic syndrome, and related cardiovascular complications,20 peripheral subcutaneous fat exhibits an independent antiatherogenic effect.23 Furthermore, subcutaneous fat is not associated with classic obesity‐related pathologies, such as cancer and heart disease, with some evidence that it might even be protective.24 Thus, secretory factors from subcutaneous fat‐hMSCs, may mediate the antiatherogenic effects of subcutaneous fat.
On the other hand, epicardial, pericardial, and periaortic fat, like intra‐abdominal visceral fat, are associated with overall adiposity and the presence of adverse metabolic phenotypes.21–22 Pericardial fat is also associated with prevalent coronary artery disease, progression of atherosclerosis, and future adverse clinical events.21 Indeed, a growing body of evidence suggests that epicardial fat may be an imaging biomarker for cardiovascular risk assessment.25
The proximity of epicardial fat to the aorta and coronary arteries may promote the association between disease progression and fat location.26 For example, epicardial fat from patients with coronary atherosclerosis is full of proinflammatory (M1) macrophages27 and with higher levels of inflammatory cytokine production.28 These properties might affect or be affected by the progression of coronary artery disease and cardiac fibrosis. In our study, hMSCs from different locations have variable effects on M2 macrophage polarization, with fat‐derived hMSCs inducing the greatest shift to anti‐inflammatory M2 phenotype, in vitro. This diversity in hMSC‐induced macrophage polarization is important because some of the therapeutic effects of hMSCs on tissue injury are mediated by macrophage polarization.13,29
The diversity among hMSCs from different locations has been previously described. However, our unexpected findings on the inferior effects of hMSCs from right atrium and epicardial fat contradict previous reports.9–10 Li et al30 compared the paracrine and reparative properties of human and rat cardiosphere‐derived cells with BM‐derived MSCs, adipose tissue–derived MSCs, and BM mononuclear cells. Similar to our findings, cardiosphere‐derived cells showed the greatest myogenic differentiation potency, highest angiogenic potential, and relatively high production of various angiogenic and antiapoptotic secreted factors, in vitro. Injection of cardiosphere‐derived cells (which were not tested in our study) into the infarcted hearts of immunocompromised mice resulted in superior improvement of cardiac function, highest cell engraftment, and myogenic differentiation rates 3 weeks after treatment.30 However, whereas Li et al30 compared human cardiosphere‐derived cells from cardiac patients (demographic and clinical characteristics were not reported), the other cells, including adipose tissue MSCs, were obtained from healthy young donors. In the present study, however, we focused on hMSCs from adipose tissue from sick cardiac patients.
Finally, the variability in hMSC properties from different locations, as demonstrated in our gene expression, cytokine profile, histopathological, and in vivo studies, fit a new paradigm in which MSCs, at least in vitro, can undergo polarization into either a proinflammatory (MSC1) or an immunosuppressive phenotype (MSC2).31–32 Infusion of MSC1 and MSC2 cells into murine models of inflammatory lung injury had opposing effects: MSC1 cells aggravated the inflammatory injury, whereas MSC2 cells were anti‐inflammatory.32 MSC1 and MSC2 polarization is mediated by TLR3 and TLR4. Consistent with this dogma, we found that whereas hMSCs from the right atrium and epicardial fat expressed a relatively high level of TLR4, hMSCs from pericardial fat expressed high levels of TLR3. Indeed, our MI studies in rat and immunocompromised nude mouse have shown that hMSCs from subcutaneous and pericardial fat, with MSC2 characteristics, improved remodeling and function after MI, whereas hMSCs from the right atrium and epicardial fat, with MSC1 characteristics, aggravated LV remodeling and dysfunction. Together, it seems that the mechanisms by which MSCs affect tissue repair are more complex than originally believed.
Cytokine Secretion and Paracrine Effects
We hypothesized that hMSC secretome in vitro would predict a therapeutic effect in vivo.
Indeed, many of the reparative properties of MSCs are attributed to paracrine effects and are self‐limiting.30,33–36 For example, we37–38 and others36,39–40 have shown that MSCs have a relatively short life in the recipient, suggesting that MSCs mediate their reparative and anti‐inflammatory effects through secretion of reparative growth factors and cytokines rather than through engraftment and differentiation.
The present study confirms that hMSCs secrete many growth factors along with cytokines that may play a paracrine role in infarct repair. Moreover, MSCs interact with other cells such as lymphocytes and macrophages.13 Additionally, the reported ability of implanted cells to stimulate proliferation in resident cardiac stem cells and cardiomyocytes is an exciting new mechanism of repair.41–42 Together, the mechanism of action of MSCs is likely a result of several mechanisms working together to influence infarct repair.43
Of interest is the positive correlation between TNF cytokine secretion from hMSCs and posttransplantation LV remodeling and dysfunction. Although the correlation was mild and should be interpreted with caution, inflammatory response and cytokine amplification after MI can contribute to cardiac remodeling and dysfunction.44 Our findings are consistent with those of Sun et al,45 where TNF knockout (TNF−/−) mice were compared with C57/BL wild‐type mice to investigate the potential contributions of TNF‐α on the incidence of acute myocardial rupture and subsequent cardiac dysfunction after MI. The authors showed that elevated local TNF‐α in the infarcted myocardium contributed to acute myocardial rupture and chronic LV dysfunction by stimulating local inflammatory response, matrix and collagen degradation, increased matrix metalloproteinase activity, and cardiomyocyte apoptosis.45 Thus, proinflammatory MSCs secreting high levels of TNF‐α could impair infarct healing and cardiac remodeling after transplantation. Additionally, hMSCs could be another source of the increased secretion of TNF‐α from visceral fat tissues and could promote inflammation and macrophage polarization to a proinflammatory M1 phenotype and induce insulin resistance.
Limitations
We are aware of several limitations in our study. First, the reparative potential of hMSCs was initially tested in rat model of MI without immunosuppression. It is possible that the intensive immune response against the human cells impaired graft survival and infarct repair. The rational to avoid immune suppression was to allay the negative influence of immune suppression on infarct healing and the immunomodulation properties of hMSCs. Nevertheless, we reproduced our initial results in repeated transplantation experiments in immunocompromised nude mice.
Second, some tissue samples were derived from different patients of different ages, gender, and clinical characteristics. Due to the relatively small number of patients, statistical adjustment for demographic and clinical characteristics was impractical. Nevertheless, in 20 patients, the right atrium, epicardial, and pericardial specimens were obtained from the same patient, allowing a direct comparison without interpatient variability. Moreover, the hMSCs for the gene profiling and cell transplantation in immunocompromised nude mouse were obtained from the same patient. Third, we compared certain cytokine secretion. It is possible that unmeasured cytokines could explain the differences in hMSC behavior in vivo. Fourth, we were unable to quantify the number of engrafted cells. Previously, we and others quantified engraftment by real‐time PCR, which we considered to be the best method to quantify cell graft.11,15,30 However, because hearts were fixed and cut for histology, PCR was impossible. Finally, we characterized BM‐hMSCs as reference controls. BM‐hMSCs were obtained from healthy young donors because we failed to grow BM‐MSCs from sick cardiac patients.
Summary and Implications
Our study suggests that the origin of hMSCs dictates their reparative and immunomodulatory properties. Inflammatory cytokines secreted by hMSCs are a major determinant of LV dilatation and dysfunction, suggesting that regulation of inflammation is a key mechanism in cell therapy for infarct repair. Our findings could guide the selection of the appropriate hMSC location for regenerative cardiovascular medicine, suggesting that subcutaneous fat is better than visceral fat. Additionally, our findings also suggest a potential role of proinflammatory hMSCs in the initiation and progression of atherosclerosis, fibrosis, coronary artery, and valvular heart disease. However, further research is needed to understand the precise role of each paracrine factor, the roles of other cytokines not studied here, and the potential of therapeutic modulation of adipose tissue hMSCs as a target for cardiovascular regenerative medicine.
Sources of Funding
We gratefully acknowledge support for this project provided by grants from the Legacy Heritage Fund of New York; the Israel Ministry of Science, Culture, and Sport (J.L.), and the EU Framework Program 7 (FP7) Health‐2007‐2.4.2.‐5, grant 222995 (J.L., J.K.).
Disclosures
None.
Acknowledgments
We thank Mrs Vivienne York for her adroit English‐language editing of the manuscript, Mrs Lena Shoval for her professional echocardiography studies, and Mrs Zmira Silman for her statistical advice. This study was carried out as partial fulfillment of the requirements for a PhD degree of Nili Naftali‐Shani, at Sackler Faculty of Medicine, Tel Aviv University, Tel Aviv, Israel.
References
- 1.Gimble JM, Guilak F, Bunnell BA. Clinical and preclinical translation of cell‐based therapies using adipose tissue‐derived cells. Stem Cell Res Ther. 2010; 1:19. [DOI] [PMC free article] [PubMed] [Google Scholar]
- 2.Rehman J, Traktuev D, Li J, Merfeld‐Clauss S, Temm‐Grove CJ, Bovenkerk JE, Pell CL, Johnstone BH, Considine RV, March KL. Secretion of angiogenic and antiapoptotic factors by human adipose stromal cells. Circulation. 2004; 109:1292-1298. [DOI] [PubMed] [Google Scholar]
- 3.Imanishi Y, Miyagawa S, Maeda N, Fukushima S, Kitagawa‐Sakakida S, Daimon T, Hirata A, Shimizu T, Okano T, Shimomura I, Sawa Y. Induced adipocyte cell‐sheet ameliorates cardiac dysfunction in a mouse myocardial infarction model: a novel drug delivery system for heart failure. Circulation. 2011; 124:S10-S17. [DOI] [PubMed] [Google Scholar]
- 4.Prockop DJ. Repair of tissues by adult stem/progenitor cells (mscs): controversies, myths, and changing paradigms. Mol Ther. 2009; 17:939-946. [DOI] [PMC free article] [PubMed] [Google Scholar]
- 5.Nakanishi C, Nagaya N, Ohnishi S, Yamahara K, Takabatake S, Konno T, Hayashi K, Kawashiri MA, Tsubokawa T, Yamagishi M. Gene and protein expression analysis of mesenchymal stem cells derived from rat adipose tissue and bone marrow. Circ J. 2011; 75:2260-2268. [DOI] [PubMed] [Google Scholar]
- 6.Limana F, Zacheo A, Mocini D, Mangoni A, Borsellino G, Diamantini A, De Mori R, Battistini L, Vigna E, Santini M, Loiaconi V, Pompilio G, Germani A, Capogrossi MC. Identification of myocardial and vascular precursor cells in human and mouse epicardium. Circ Res. 2007; 101:1255-1265. [DOI] [PubMed] [Google Scholar]
- 7.Zhou B, Ma Q, Rajagopal S, Wu SM, Domian I, Rivera‐Feliciano J, Jiang D, von Gise A, Ikeda S, Chien KR, Pu WT. Epicardial progenitors contribute to the cardiomyocyte lineage in the developing heart. Nature. 2008; 454:109-113. [DOI] [PMC free article] [PubMed] [Google Scholar]
- 8.Chong JJ, Chandrakanthan V, Xaymardan M, Asli NS, Li J, Ahmed I, Heffernan C, Menon MK, Scarlett CJ, Rashidianfar A, Biben C, Zoellner H, Colvin EK, Pimanda JE, Biankin AV, Zhou B, Pu WT, Prall OW, Harvey RP. Adult cardiac‐resident msc‐like stem cells with a proepicardial origin. Cell Stem Cell. 2011; 9:527-540. [DOI] [PMC free article] [PubMed] [Google Scholar]
- 9.Bayes‐Genis A, Galvez‐Monton C, Prat‐Vidal C, Soler‐Botija C. Cardiac adipose tissue: a new frontier for cardiac regeneration? Int J Cardiol. 2013; 167:22-25.10.1016/j.ijcard.2012.05.082 [DOI] [PubMed] [Google Scholar]
- 10.Bayes‐Genis A, Soler‐Botija C, Farre J, Sepulveda P, Raya A, Roura S, Prat‐Vidal C, Galvez‐Monton C, Montero JA, Buscher D, Izpisua Belmonte JC. Human progenitor cells derived from cardiac adipose tissue ameliorate myocardial infarction in rodents. J Mol Cell Cardiol. 2010; 49:771-780. [DOI] [PubMed] [Google Scholar]
- 11.Itzhaki‐Alfia A, Leor J, Raanani E, Sternik L, Spiegelstein D, Netser S, Holbova R, Pevsner‐Fischer M, Lavee J, Barbash IM. Patient characteristics and cell source determine the number of isolated human cardiac progenitor cells. Circulation. 2009; 120:2559-2566. [DOI] [PubMed] [Google Scholar]
- 12.Pevsner‐Fischer M, Morad V, Cohen‐Sfady M, Rousso‐Noori L, Zanin‐Zhorov A, Cohen S, Cohen IR, Zipori D. Toll‐like receptors and their ligands control mesenchymal stem cell functions. Blood. 2007; 109:1422-1432. [DOI] [PubMed] [Google Scholar]
- 13.Adutler‐Lieber S, Ben‐Mordechai T, Naftali‐Shani N, Asher E, Loberman D, Raanani E, Leor J. Human macrophage regulation via interaction with cardiac adipose tissue‐derived mesenchymal stromal cells. J Cardiovasc Pharmacol Ther. 2013; 18:78-86. [DOI] [PubMed] [Google Scholar]
- 14.Leor J, Patterson M, Quinones MJ, Kedes LH, Kloner RA. Transplantation of fetal myocardial tissue into the infarcted myocardium of rat. A potential method for repair of infarcted myocardium? Circulation. 1996; 94:II332-II336. [PubMed] [Google Scholar]
- 15.Ben‐Mordechai T, Holbova R, Landa‐Rouben N, Harel‐Adar T, Feinberg MS, Elrahman IA, Blum G, Epstein F, Silman Z, Cohen S, Leor J. Macrophage subpopulations are essential for infarct repair with and without stem cell therapy. J Am Coll Cardiol. 2013 [DOI] [PubMed] [Google Scholar]
- 16.Bauer M, Cheng S, Jain M, Ngoy S, Theodoropoulos C, Trujillo A, Lin FC, Liao R. Echocardiographic speckle‐tracking based strain imaging for rapid cardiovascular phenotyping in mice. Circ Res. 2011; 108:908-916. [DOI] [PMC free article] [PubMed] [Google Scholar]
- 17.Yuan Z, Liu Y, Liu Y, Zhang J, Kishimoto C, Ma A, Liu Z. Peroxisome proliferator‐activated receptor‐gamma ligands ameliorate experimental autoimmune myocarditis associated with inhibition of self‐sensitive t cells. J Cardiovasc Pharmacol. 2004; 43:868-875. [DOI] [PubMed] [Google Scholar]
- 18.van den Akker F, Deddens JC, Doevendans PA, Sluijter JP. Cardiac stem cell therapy to modulate inflammation upon myocardial infarction. Biochim Biophys Acta. 2013; 1830:2449-2458. [DOI] [PubMed] [Google Scholar]
- 19.Yan J, Tie G, Wang S, Messina KE, DiDato S, Guo S, Messina LM. Type 2 diabetes restricts multipotency of mesenchymal stem cells and impairs their capacity to augment postischemic neovascularization in db/db mice. J Am Heart Assoc. 2012; 1:e002238. [DOI] [PMC free article] [PubMed] [Google Scholar]
- 20.Hassan M, Latif N, Yacoub M. Adipose tissue: friend or foe? Nat Rev Cardiol. 2012; 9:689-702. [DOI] [PubMed] [Google Scholar]
- 21.Turer AT, Hill JA, Elmquist JK, Scherer PE. Adipose tissue biology and cardiomyopathy: translational implications. Circ Res. 2012; 111:1565-1577. [DOI] [PMC free article] [PubMed] [Google Scholar]
- 22.Britton KA, Pedley A, Massaro JM, Corsini EM, Murabito JM, Hoffmann U, Fox CS. Prevalence, distribution, and risk factor correlates of high thoracic periaortic fat in the framingham heart study. J Am Heart Assoc. 2012; 1:e004200. [DOI] [PMC free article] [PubMed] [Google Scholar]
- 23.Tanko LB, Bagger YZ, Alexandersen P, Larsen PJ, Christiansen C. Peripheral adiposity exhibits an independent dominant antiatherogenic effect in elderly women. Circulation. 2003; 107:1626-1631. [DOI] [PubMed] [Google Scholar]
- 24.Porter SA, Massaro JM, Hoffmann U, Vasan RS, O'Donnel CJ, Fox CS. Abdominal subcutaneous adipose tissue: a protective fat depot? Diabetes Care. 2009; 32:1068-1075. [DOI] [PMC free article] [PubMed] [Google Scholar]
- 25.Davidovich D, Gastaldelli A, Sicari R. Imaging cardiac fat. Eur Heart J Cardiovasc Imaging. 2013; 14:625-630. [DOI] [PubMed] [Google Scholar]
- 26.Thanassoulis G, Massaro JM, Corsini E, Rogers I, Schlett CL, Meigs JB, Hoffmann U, O'Donnell CJ, Fox CS. Periaortic adipose tissue and aortic dimensions in the framingham heart study. J Am Heart Assoc. 2012; 1:e000885. [DOI] [PMC free article] [PubMed] [Google Scholar]
- 27.Hirata Y, Tabata M, Kurobe H, Motoki T, Akaike M, Nishio C, Higashida M, Mikasa H, Nakaya Y, Takanashi S, Igarashi T, Kitagawa T, Sata M. Coronary atherosclerosis is associated with macrophage polarization in epicardial adipose tissue. J Am Coll Cardiol. 2011; 58:248-255. [DOI] [PubMed] [Google Scholar]
- 28.Mazurek T, Zhang L, Zalewski A, Mannion JD, Diehl JT, Arafat H, Sarov‐Blat L, O'Brien S, Keiper EA, Johnson AG, Martin J, Goldstein BJ, Shi Y. Human epicardial adipose tissue is a source of inflammatory mediators. Circulation. 2003; 108:2460-2466. [DOI] [PubMed] [Google Scholar]
- 29.Dayan V, Yannarelli G, Billia F, Filomeno P, Wang XH, Davies JE, Keating A. Mesenchymal stromal cells mediate a switch to alternatively activated monocytes/macrophages after acute myocardial infarction. Basic Res Cardiol. 2011; 106:1299-1310. [DOI] [PubMed] [Google Scholar]
- 30.Li TS, Cheng K, Malliaras K, Smith RR, Zhang Y, Sun B, Matsushita N, Blusztajn A, Terrovitis J, Kusuoka H, Marban L, Marban E. Direct comparison of different stem cell types and subpopulations reveals superior paracrine potency and myocardial repair efficacy with cardiosphere‐derived cells. J Am Coll Cardiol. 2012; 59:942-953. [DOI] [PMC free article] [PubMed] [Google Scholar]
- 31.Waterman RS, Tomchuck SL, Henkle SL, Betancourt AM. A new mesenchymal stem cell (msc) paradigm: polarization into a pro‐inflammatory msc1 or an immunosuppressive msc2 phenotype. PLoS ONE. 2010; 5:e10088. [DOI] [PMC free article] [PubMed] [Google Scholar]
- 32.Bunnell BA, Betancourt AM, Sullivan DE. New concepts on the immune modulation mediated by mesenchymal stem cells. Stem Cell Res Ther. 2010; 1:34. [DOI] [PMC free article] [PubMed] [Google Scholar]
- 33.Prockop DJ. “Stemness” does not explain the repair of many tissues by mesenchymal stem/multipotent stromal cells (mscs). Clin Pharmacol Ther. 2007; 82:241-243. [DOI] [PubMed] [Google Scholar]
- 34.Prockop DJ, Oh JY. Mesenchymal stem/stromal cells (mscs): role as guardians of inflammation. Mol Ther. 2012; 20:14-20. [DOI] [PMC free article] [PubMed] [Google Scholar]
- 35.Ranganath SH, Levy O, Inamdar MS, Karp JM. Harnessing the mesenchymal stem cell secretome for the treatment of cardiovascular disease. Cell Stem Cell. 2012; 10:244-258. [DOI] [PMC free article] [PubMed] [Google Scholar]
- 36.von Bahr L, Batsis I, Moll G, Hagg M, Szakos A, Sundberg B, Uzunel M, Ringden O, Le Blanc K. Analysis of tissues following mesenchymal stromal cell therapy in humans indicates limited long‐term engraftment and no ectopic tissue formation. Stem Cells. 2012; 30:1575-1578. [DOI] [PubMed] [Google Scholar]
- 37.Amsalem Y, Mardor Y, Feinberg MS, Landa N, Miller L, Daniels D, Ocherashvilli A, Holbova R, Yosef O, Barbash IM, Leor J. Iron‐oxide labeling and outcome of transplanted mesenchymal stem cells in the infarcted myocardium. Circulation. 2007; 116:I38-I45. [DOI] [PubMed] [Google Scholar]
- 38.Barbash IM, Chouraqui P, Baron J, Feinberg MS, Etzion S, Tessone A, Miller L, Guetta E, Zipori D, Kedes LH, Kloner RA, Leor J. Systemic delivery of bone marrow‐derived mesenchymal stem cells to the infarcted myocardium ‐ feasibility, cell migration, and body distribution. Circulation. 2003; 108:863-868. [DOI] [PubMed] [Google Scholar]
- 39.Zeng L, Hu Q, Wang X, Mansoor A, Lee J, Feygin J, Zhang G, Suntharalingam P, Boozer S, Mhashilkar A, Panetta CJ, Swingen C, Deans R, From AH, Bache RJ, Verfaillie CM, Zhang J. Bioenergetic and functional consequences of bone marrow‐derived multipotent progenitor cell transplantation in hearts with postinfarction left ventricular remodeling. Circulation. 2007; 115:1866-1875. [DOI] [PubMed] [Google Scholar]
- 40.Jameel MN, Li Q, Mansoor A, Qiang X, Sarver A, Wang X, Swingen C, Zhang J. Long‐term functional improvement and gene expression changes after bone marrow‐derived multipotent progenitor cell transplantation in myocardial infarction. Am J Physiol Heart Circ Physiol. 2010; 298:H1348-H1356. [DOI] [PMC free article] [PubMed] [Google Scholar]
- 41.Hatzistergos KE, Quevedo H, Oskouei BN, Hu Q, Feigenbaum GS, Margitich IS, Mazhari R, Boyle AJ, Zambrano JP, Rodriguez JE, Dulce R, Pattany PM, Valdes D, Revilla C, Heldman AW, McNiece I, Hare JM. Bone marrow mesenchymal stem cells stimulate cardiac stem cell proliferation and differentiation. Circ Res. 2010; 107:913-922. [DOI] [PMC free article] [PubMed] [Google Scholar]
- 42.Xiong Q, Ye L, Zhang P, Lepley M, Tian J, Li J, Zhang L, Swingen C, Vaughan JT, Kaufman DS, Zhang J. Functional consequences of human induced pluripotent stem cell therapy: myocardial atp turnover rate in the in vivo swine heart with postinfarction remodeling. Circulation. 2013; 127:997-1008. [DOI] [PMC free article] [PubMed] [Google Scholar]
- 43.Williams AR, Hare JM. Mesenchymal stem cells: biology, pathophysiology, translational findings, and therapeutic implications for cardiac disease. Circ Res. 2011; 109:923-940. [DOI] [PMC free article] [PubMed] [Google Scholar]
- 44.Nian M, Lee P, Khaper N, Liu P. Inflammatory cytokines and postmyocardial infarction remodeling. Circ Res. 2004; 94:1543-1553. [DOI] [PubMed] [Google Scholar]
- 45.Sun M, Dawood F, Wen WH, Chen M, Dixon I, Kirshenbaum LA, Liu PP. Excessive tumor necrosis factor activation after infarction contributes to susceptibility of myocardial rupture and left ventricular dysfunction. Circulation. 2004; 110:3221-3228. [DOI] [PubMed] [Google Scholar]