

Abstract
Background
Lipoprotein‐associated phospholipase A2 (Lp‐PLA2) levels are associated with coronary heart disease (CHD) in healthy individuals and in patients who have had ischemic events.
Methods and Results
The Long‐term Intervention with Pravastatin in Ischemic Disease (LIPID) study randomized 9014 patients with cholesterol levels of 4.0 to 7.0 mmol/L to placebo or pravastatin 3 to 36 months after myocardial infarction or unstable angina and showed a reduction in CHD and total mortality. We assessed the value of baseline and change in Lp‐PLA2 activity to predict outcomes over a 6‐year follow‐up, the effect of pravastatin on Lp‐PLA2 levels, and whether pravastatin treatment effect was related to Lp‐PLA2 activity change. Lp‐PLA2 was measured at randomization and 1 year, and levels were grouped as quartiles. The prespecified end point was CHD death or nonfatal myocardial infarction. Baseline Lp‐PLA2 activity was positively associated with CHD events (P<0.001) but not after adjustment for 23 baseline factors (P=0.66). In 6518 patients who were event free at 1 year, change in Lp‐PLA2 was a significant independent predictor of subsequent CHD events after adjustment for these risk factors, including LDL cholesterol and LDL cholesterol changes (P<0.001). Pravastatin reduced Lp‐PLA2 by 16% compared with placebo (P<0.001). After adjustment for Lp‐PLA2 change, the pravastatin treatment effect was reduced from 23% to 10% (P=0.26), with 59% of the treatment effect accounted for by changes in Lp‐PLA2. Similar reductions in treatment effect were seen after adjustment for LDL cholesterol change.
Conclusion
Reduction in Lp‐PLA2 activity during the first year was a highly significant predictor of CHD events, independent of change in LDL cholesterol, and may account for over half of the benefits of pravastatin in the LIPID study.
Keywords: biomarkers, LIPID, Lp‐PLA2, pravastatin
Introduction
Products of the enzyme lipoprotein‐associated phospholipase A2 (Lp‐PLA2) are found in plaques and are proinflammatory and proapoptotic.1 Lp‐PLA2 is also a marker of vulnerable plaques.2–3 Elevated plasma Lp‐PLA2 levels are associated with increased coronary heart disease (CHD) risk in both healthy individuals and patients who have already had coronary events.4
The Long‐term Intervention with Pravastatin in Ischaemic Disease (LIPID) study was a large double‐blind, placebo‐controlled study of pravastatin in stable CHD patients.5 During a mean 6.0‐year follow‐up, there were significant reductions in the primary end point of death from CHD, all‐cause mortality, and other prespecified cardiovascular end points, including the composite of nonfatal myocardial infarction (MI) or CHD death. There was a reduction in death from CHD death by 24% (P<0.001) and overall mortality by 22% (P<0.001). Nonfatal MI or death due to CHD was reduced by 24%.
Reduction in LDL cholesterol (LDL‐C) is thought to be the major mechanism by which statins reduce risk. It is possible that other mechanisms are also important. Statins have been shown to reduce Lp‐PLA2 levels by up to 33%,6–7,6–16 and therefore some of the benefits of pravastatin could be explained by this effect. We therefore assessed in a prespecified analysis of the LIPID study data the predictive value of baseline and changes in Lp‐PLA2 for major coronary events (CHD death or nonfatal MI), the effect of pravastatin on Lp‐PLA2 levels, and the extent to which pravastatin treatment effect might be explained by effects on Lp‐PLA2.
Methods
Study Design and Patients
The design and major results of the LIPID study have been described in detail previously.5 A total of 9014 patients aged 31 to 75 years (7498 men, 1516 women), with an MI or hospital discharge diagnosis of unstable angina 3 to 36 months previously, were enrolled on the study if their plasma total cholesterol was 4.0 to 7.0 mmol/L (155 to 271 mg/dL), fasting triglycerides were <445 mg/dL (<5.0 mmol/L), and they satisfied other broad inclusion and exclusion criteria. After informed consent and an 8‐week placebo run‐in phase to assess compliance, patients were randomly allocated to receive pravastatin 40 mg daily or matching placebo. Patients were otherwise treated with standard therapies.
The primary prespecified outcome for substudies was a composite of CHD death and nonfatal MI. MI was diagnosed by the presence of at least 2 new pathologic Q waves on the electrocardiogram or 2 of the following 3 criteria: ≥15 minutes of ischemic chest pain, evolutionary ST‐T wave changes, or elevation of the serum level of creatine kinase or its MB isoenzyme to at least twice the upper limit of normal. All deaths and MIs were reviewed by an Outcomes Assessment Committee whose members had no knowledge of the patient's treatment assignment.
The trial and biomarker analyses were conceived, managed, and analyzed independently of the sponsor.
Laboratory Methods and Biomarkers
Blood was drawn from consenting participants at baseline before treatment allocation after a 12‐hour fast into EDTA tubes, and plasma was stored at −70°C. Biomarkers including Lp‐PLA2 were analyzed using baseline samples from 87% of patients (n=7863) and 86% (n=6657) of patients alive at 1 year.
Lp‐PLA2 activity was measured in a research‐use automated enzyme assay system (CAM Assay; DiaDexus Inc), run on the Abbott Architect c8000 analyzer, using a colorimetric PAF analog substrate that is converted on hydrolysis by the phospholipase enzyme. The assay is calibrated to a highly purified recombinant Lp‐PLA2 standard. Intra‐assay coefficient of variation (CV) was 1.2%, and interassay CV was 3.8%. All assay measurements were performed by laboratory personnel who were blinded to the study samples regarding treatment assignment and outcomes.
Fasting serum lipids (total cholesterol, HDL cholesterol, and triglycerides) were measured in a central laboratory at Flinders Medical Centre, Adelaide, South Australia, a World Health Organization reference center. LDL cholesterol was calculated using the Friedewald formula.8
Statistics
Analyses were prespecified in a biomarker protocol. Baseline Lp‐PLA2 activity and changes to 1 year were grouped as quartiles. Hazard ratios (HRs) and 95% CIs were estimated using Cox proportional‐hazards regression models. Analyses were adjusted for sex, pravastatin treatment, and 22 other traditional risk factors. The primary end point for biomarker analyses was a composite of CHD death and nonfatal MI. Secondary end points included major cardiovascular disease (CVD) outcomes (a composite of CVD death, MI, and stroke) and total CVD outcomes (a composite of major CVD events, unstable angina, and coronary revascularization).
The relationship between Lp‐PLA2 activity and CVD outcomes was assessed using a prespecified time to event model adjusted for sex, randomized treatment, prior stroke, diabetes mellitus, current smoking, hypertension, fasting glucose, total cholesterol, apolipoprotein B, apolipoprotein A1, HDL cholesterol, triglycerides, age, nature of prior acute coronary syndromes, timing of coronary revascularization, systolic blood pressure, atrial fibrillation, estimated glomerular filtration rate, body mass index, dyspnea class, angina grade, white blood cell count, peripheral vascular disease, and use of aspirin at baseline.
The relationship between changes in Lp‐PLA2 activity from baseline to 1 year and subsequent CVD events was assessed in a landmark analysis using Cox regression in a model that incorporated the standard risk factors previously indicated as well as baseline Lp‐PLA2 activity. We also performed backward selection for a landmark model looking at events from 1 year adjusted for baseline brain natriuretic peptide, baseline cystatin C, baseline D‐dimer, baseline troponin I, baseline Lp‐PLA2 activity, and change in these same biomarkers.
The extent to which the pravastatin effect on subsequent CVD events was accounted for by changes in Lp‐PLA2 activity and changes in LDL‐C was assessed by estimating the relative risk reduction from pravastatin before and after adjustment for these changes as continuous variables in these Cox regression models.9 A sensitivity analysis of treatment effect accounted for by changes in Lp‐PLA2 activity and LDL‐C used change in these variables grouped in quartiles.
Results
Of the 9014 patients randomized in LIPID, 7863 patients had baseline measurement of Lp‐PLA2 levels and formed the cohort for this study (Figure 1). The baseline characteristics of patients included and of those not included in this analysis are shown in Table 1.
Figure 1.
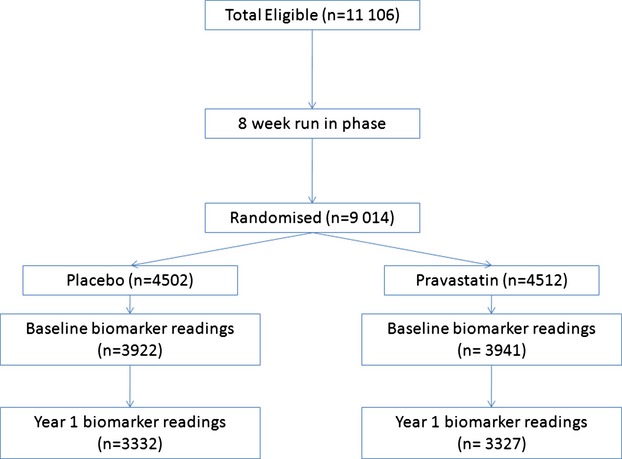
Consort diagram for patient flow.
Table 1.
Baseline Characteristics of Patients in the Biomarker Analysis vs Others
| Patients With All Biomarker Readings at Baseline | All Other Patients | P Value* | |
|---|---|---|---|
| 7863 (100%) | 1151 (100%) | ||
| Pravastatin, No. (%) | 3941 (50) | 571 (50) | |
| Age at randomization, y, median (IQR) | 62.0 (55.0 to 67.0) | 61.0 (54.0 to 67.0) | <0.001 |
| Age ≥65 y, No. (%) | 3109 (40) | 405 (35) | <0.01 |
| Female, No. (%) | 1333 (17) | 183 (16) | 0.37 |
| Baseline health | |||
| Months from QE, median (IQR) | 13.9 (7.9 to 25.0) | 12.8 (7.6 to 24.0) | 0.03 |
| Current smoker, No. (%) | 735 (9) | 134 (12) | 0.01 |
| Hypertension, No. (%) | 3291 (42) | 467 (41) | 0.41 |
| Diabetes, No. (%) | 676 (9) | 106 (9) | 0.49 |
| Obese, No. (%) | 1397 (18) | 214 (19) | 0.50 |
| Stroke, No. (%) | 322 (4) | 47 (4) | 0.99 |
| Atrial fibrillation, No. (%) | 110 (1) | 13 (1) | 0.46 |
| Systolic BP, mean (SD), mm Hg | 134 (19) | 133 (18) | 0.11 |
| Diastolic BP, mean (SD), mm Hg | 81 (11) | 80 (11) | 0.64 |
| Dyspnea NYHA Class >1, No. (%) | 761 (10) | 97 (8) | 0.18 |
| Angina CCS Grade >0, No. (%) | 2927 (37) | 401 (35) | 0.12 |
| Baseline lipids | |||
| Total cholesterol, mean (SD), nmol/L | 5.7 (0.8) | 5.6 (0.8) | 0.03 |
| Total cholesterol ≥5.5 mmol/L, No. (%) | 4495 (57) | 639 (56) | 0.29 |
| LDL‐C, mean (SD), nmol/L | 3.9 (0.7) | 3.8 (0.7) | <0.01 |
| LDL‐C ≥3.5 mmol/L, No. (%) | 5513 (70) | 780 (68) | 0.11 |
| HDL‐C, mean (SD), nmol/L | 1.0 (0.2) | 1.0 (0.2) | 0.84 |
| HDL‐C ≥1 mmol/L, No. (%) | 2936 (37) | 422 (37) | 0.67 |
| Triglyceride, median (IQR), nmol/L | 1.6 (1.2 to 2.2) | 1.6 (1.2 to 2.2) | 0.39 |
| Total cholesterol:HDL‐C, mean (SD), nmol/L | 6.2 (1.5) | 6.2 (1.5) | 0.37 |
| eGFR, median (IQR), mLs/min | 69 (60 to 80) | 70 (60 to 81) | 0.56 |
| WBC, median (IQR) ×109 | 7.0 (6.0 to 8.2) | 7.1 (6.0 to 8.3) | 0.30 |
| Previous coronary revascularization | |||
| No revascularization, No. (%) | 4610 (59) | 712 (62) | 0.03 |
| PCI only, No. (%) | 870 (11) | 118 (10) | — |
| CABG only, No. (%) | 2141 (27) | 295 (26) | — |
| PCI and CABG, No. (%) | 242 (3) | 26 (2) | — |
| Qualifying Event | |||
| No MI, No. (%) | 2843 (36) | 417 (36) | 0.90 |
| Single MI, No. (%) | 4115 (52) | 604 (52) | — |
| Multiple MI, No. (%) | 905 (12) | 130 (11) | — |
| Medications | |||
| Aspirin, No. (%) | 6501 (83) | 901 (78) | <0.001 |
| ACE inhibitors, No. (%) | 1254 (16) | 179 (16) | 0.73 |
| β‐Blocker, No. (%) | 3691 (47) | 538 (47) | 0.90 |
| Calcium antagonist, No. (%) | 2688 (34) | 424 (37) | 0.08 |
| LIPID risk score, mean (SD)10 | 5.8 (3.5) | 6.0 (3.5) | 0.26 |
No. (%) is presented unless otherwise stated. ACE indicates angiotensin‐converting enzyme; BP, blood pressure; CABG, coronary artery bypass graft surgery; CCS, Canadian Cardiovascular Society; eGFR, estimated glomerular filtration rate; HDL‐C, HDL cholesterol; IQR, interquartile range; LDL‐C, LDL cholesterol; LIPID, Long‐term Intervention with Pravastatin in Ischaemic Disease; MI, myocardial infarction, NYHA, New York Heart Association; PCI, percutaneous coronary intervention; WBC, white blood cell count.
P‐values for continuous variables are from a linear model, and for categorical variables are from an ordinal or logistic regression.
Baseline characteristics of the patients divided into the quartiles (<229, 229 to 261, 261 to 294, >294 nmoL/min per milliliter) of Lp‐PLA2 activity are shown in Table 2. Lp‐PLA2 activity was significantly lower in females (Figure 2) and with lower LDL‐C, lower triglycerides, or higher HDL cholesterol levels. There were higher associations with a history of multiple MIs, higher LIPID risk score,10 higher WBC, cystatin C, and lower estimated glomerular filtration rate. Lp‐PLA2 activity was not associated with high‐sensitivity C‐reactive protein or troponin I.
Table 2.
Baseline Risk Factors by Lp‐PLA2 Activity Categories
| Lp‐PLA2 Activity ≤229 nmol/min per milliliter | Lp‐PLA2 Activity 229 to 261 nmol/min per milliliter | Lp‐PLA2 Activity 261 to 294 nmol/min per milliliter | Lp‐PLA2 Activity >294 nmol/min per milliliter | P Value Trend* | |
|---|---|---|---|---|---|
| 1970 | 1962 | 1965 | 1966 | ||
| Lp‐PLA2 activity, mean (SD), nmol/min per milliliter | 199.4 (25.4) | 245.8 (9.1) | 276.8 (9.4) | 326.0 (29.5) | |
| Age at randomization, median (IQR), y | 63.0 (56.0 to 68.0) | 63.0 (56.0 to 68.0) | 62.0 (55.0 to 67.0) | 62.0 (55.0 to 67.0) | <0.01 |
| Age ≥65 y, No. (%) | 798 (41) | 819 (42) | 733 (37) | 759 (39) | 0.06 |
| Female, No. (%) | 658 (33) | 364 (19) | 195 (10) | 116 (6) | <0.001 |
| Allocated pravastatin, No. (%) | 990 (50) | 996 (51) | 981 (50) | 974 (50) | 0.57 |
| Baseline health | |||||
| Months from QE, median (IQR) | 13.4 (7.5 to 24.9) | 13.5 (7.6 to 24.6) | 14.3 (8.0 to 25.2) | 14.5 (8.3 to 25.3) | 0.05 |
| Current smoker, No. (%) | 156 (8) | 181 (9) | 183 (9) | 215 (11) | <0.01 |
| Hypertension, No. (%) | 877 (45) | 818 (42) | 801 (41) | 795 (40) | <0.01 |
| Diabetes mellitus, No. (%) | 201 (10) | 167 (9) | 152 (8) | 156 (8) | <0.01 |
| Obese, No. (%) | 357 (18) | 354 (18) | 340 (17) | 346 (18) | 0.56 |
| Previous stroke, No. (%) | 83 (4) | 74 (4) | 78 (4) | 87 (4) | 0.68 |
| Atrial fibrillation, No. (%) | 21 (1) | 20 (1) | 30 (2) | 39 (2) | <0.01 |
| Systolic BP, mean (SD), mm Hg | 135 (19) | 135 (19) | 134 (19) | 134 (20) | 0.11 |
| Diastolic BP, mean (SD), mm Hg | 80 (11) | 81 (11) | 81 (11) | 81 (11) | 0.32 |
| Dyspnea, No. (%) NYHA Class >1, No. (%) | 205 (10) | 171 (9) | 163 (8) | 222 (11) | 0.40 |
| Angina CCS Grade >0, No. (%) | 727 (37) | 681 (35) | 711 (36) | 808 (41) | <0.01 |
| Baseline lipids | |||||
| Total cholesterol, mean (SD), mmol/L | 5.5 (0.9) | 5.6 (0.8) | 5.7 (0.8) | 5.8 (0.8) | <0.001 |
| LDL‐C, mean (SD) | 3.6 (0.7) | 3.9 (0.7) | 4.0 (0.7) | 4.1 (0.7) | <0.001 |
| HDL‐C, mean (SD) | 1.1 (0.3) | 1.0 (0.2) | 0.9 (0.2) | 0.8 (0.2) | <0.001 |
| Triglycerides, median (IQR) | 1.4 (1.1 to 2.0) | 1.5 (1.1 to 2.1) | 1.6 (1.2 to 2.2) | 1.7 (1.3 to 2.3) | <0.001 |
| Total cholesterol:HDL‐C, mean (SD) | 5.3 (1.4) | 6.0 (1.3) | 6.4 (1.3) | 7.1 (1.5) | <0.001 |
| Previous coronary revascularization | |||||
| No revascularization, No. (%) | 1197 (61) | 1145 (58) | 1145 (58) | 1123 (57) | <0.001 |
| PCI only, No. (%) | 259 (13) | 221 (11) | 230 (12) | 160 (8) | — |
| CABG only, No. (%) | 453 (23) | 531 (27) | 532 (27) | 625 (32) | — |
| PCI and CABG, No. (%) | 61 (3) | 65 (3) | 58 (3) | 58 (3) | — |
| Qualifying Event | |||||
| No MI, No. (%) | 762 (39) | 703 (36) | 687 (35) | 691 (35) | <0.001 |
| Single MI, No. (%) | 1025 (52) | 1042 (53) | 1047 (53) | 1001 (51) | — |
| Multiple MI, No. (%) | 183 (9) | 217 (11) | 231 (12) | 274 (14) | — |
| Medications | |||||
| Aspirin, No. (%) | 1611 (82) | 1631 (83) | 1666 (85) | 1593 (81) | 0.78 |
| ACE inhibitors, No. (%) | 310 (16) | 297 (15) | 297 (15) | 350 (18) | 0.08 |
| β‐Blocker, No. (%) | 928 (47) | 896 (46) | 961 (49) | 906 (46) | 0.92 |
| Calcium antagonist, No. (%) | 701 (36) | 664 (34) | 636 (32) | 687 (35) | 0.52 |
| LIPID risk score,10 mean (SD) | 4.9 (3.4) | 5.7 (3.4) | 6.0 (3.4) | 6.7 (3.5) | <0.001 |
| Baseline biomarker levels | |||||
| eGFR, median (IQR), mL/min | 70 (60 to 81) | 70 (61 to 80) | 70 (61 to 80) | 69 (59 to 80) | <0.001 |
| WBC, median (IQR), ×109 | 6.9 (5.9 to 8.1) | 6.9 (5.9 to 8.1) | 7.1 (6.0 to 8.2) | 7.2 (6.1 to 8.5) | <0.001 |
| BNP, median (IQR), pg/mL | 23.9 (10.0 to 51.9) | 23.3 (9.7 to 50.1) | 23.1 (10.0 to 49.2) | 23.6 (9.6 to 52.1) | 0.03 |
| Troponin I, median (IQR), ng/mL | 0.011 (0.006 to 0.021) | 0.010 (0.006 to 0.019) | 0.010 (0.006 to 0.021) | 0.011 (0.006 to 0.021) | 0.55 |
| CRP, median (IQR), mg/L | 2.5 (1.2 to 5.0) | 2.4 (1.2 to 4.9) | 2.4 (1.2 to 4.6) | 2.5 (1.3 to 4.8) | 0.15 |
| Cystatin C, median (IQR), mg/L | 0.78 (0.70 to 0.89) | 0.80 (0.72 to 0.91) | 0.81 (0.73 to 0.93) | 0.85 (0.75 to 0.97) | <0.001 |
| D‐dimer, median (IQR), ng/L | 168 (109 to 266) | 167 (109 to 270) | 174 (112 to 276) | 183 (117 to 278) | 0.63 |
| LP(a), median (IQR), mg/L | 13.5 (6.4 to 39.6) | 13.7 (6.5 to 43.8) | 14.3 (6.7 to 46.3) | 14.1 (6.8 to 46.7) | <0.01 |
| Mid regional proadrenomedullin, median (IQR), nmol/L | 0.47 (0.37 to 0.57) | 0.47 (0.38 to 0.58) | 0.48 (0.39 to 0.57) | 0.48 (0.39 to 0.59) | 0.02 |
No. (%) is presented unless otherwise stated. BNP indicates brain natriuretic peptide; BP, blood pressure; CABG, coronary artery bypass graft surgery; CCS, Canadian Cardiovascular Society; CRP, C‐reactive protein; eGFR, estimated glomerular filtration rate; HDL‐C, HDL cholesterol; IQR, interquartile range; LDL‐C, LDL lipoprotein cholesterol; LIPID, Long‐term Intervention with Pravastatin in Ischaemic Disease; LP, lipoprotein; Lp‐PLA2, lipoprotein‐associated phospholipase A2; MI, myocardial infarction, NYHA, New York Heart Association; PCI, percutaneous coronary intervention; WBC, white blood cell count.
P‐values for trend for continuous variables are from generalized linear models and, for categorical variables, are from an ordinal or logistic regression.
Figure 2.
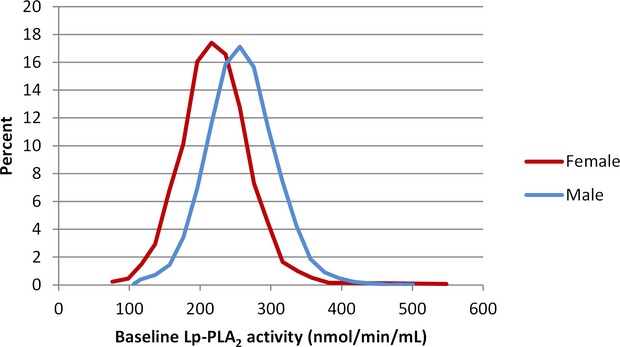
Distribution of lipoprotein‐associated phospholipase A2 (Lp‐PLA2) activity levels. Baseline Lp‐PLA2 activity by sex, P<0.0001.
Relationship Between Lp‐PLA2 and Clinical Events
Higher baseline Lp‐PLA2 activity was associated with an increased risk of CHD events, major CVD events, total CVD events, CHD death, and all‐cause mortality significant (each P≤0.01). After adjustment for all baseline factors, there was no longer a significant association between Lp‐PLA2 activity and clinical events with the exception of CHD death (P=0.05) (Figure 3).
Figure 3.
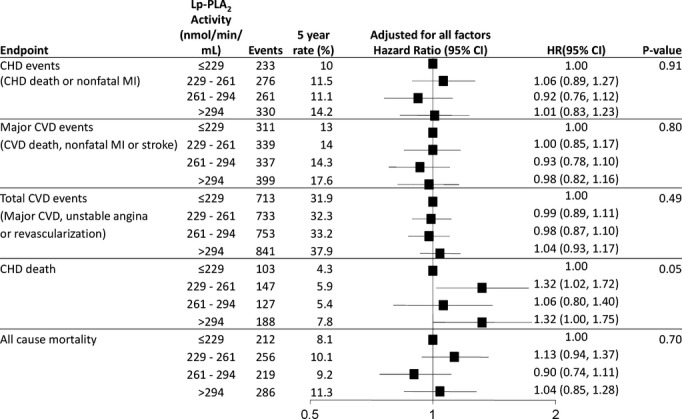
Baseline Lp‐PLA2 activity and prediction of CVD events. HR and 95% CI are adjusted for baseline variables: treatment, sex, stroke, diabetes, smoking, hypertension, total cholesterol, apolipoprotein B and A1, HDL‐C, age, nature of prior ACS, timing of coronary revascularization, SBP, atrial fibrillation, eGFR, BMI, dyspnea class, angina grade, WBC, peripheral vascular disease, triglycerides, fasting glucose and aspirin at baseline. ACS indicates acute coronary syndromes; BMI, body mass index; CHD, coronary heart disease; CVD, cardiovascular disease; eGFR, estimated glomerular filtration rate; HDL‐C, HDL cholesterol; HR, hazard ratio; Lp‐PLA2, lipoprotein‐associated phospholipase A2; MI, myocardial infarction; SBP, systolic blood pressure; WBC, white blood cell count.
Effect of Pravastatin on Lp‐PLA2 Levels and CVD Events
Lp‐PLA2 activity levels were reduced by 16% (262 nmoL/min per milliliter versus 218 nmoL/min per milliliter) in the pravastatin group at 12 months while levels decreased by 0.4% in the placebo group (P<0.001) (Figures 4 and 5). Figures 6 and 7 show the relationship between levels of Lp‐PLA2 levels and on treatment LDL‐C at baseline and changes to year 1. Effects of pravastatin on clinical events by each quartile of Lp‐PLA2 activity are shown in Table 3. Pravastatin resulted in a significant reduction in CHD events, CVD events, CHD death, and all‐cause mortality with no significant variation in treatment effect according to baseline Lp‐PLA2 activity. The numbers needed to treat to prevent 1 event were lower in patients with higher Lp‐PLA2 activity, but there was no significant trend in the effect of pravastatin across the quartiles of baseline Lp‐PLA2 activity.
Figure 4.
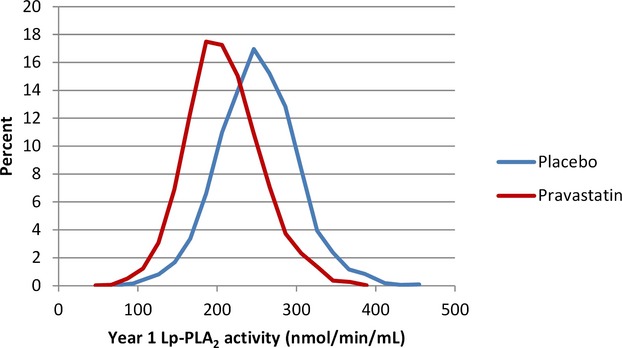
Distribution of lipoprotein‐associated phospholipase A2 (Lp‐PLA2) activity levels. Lp‐PLA2 activity at 1 year by randomized treatment, P<0.001.
Figure 5.
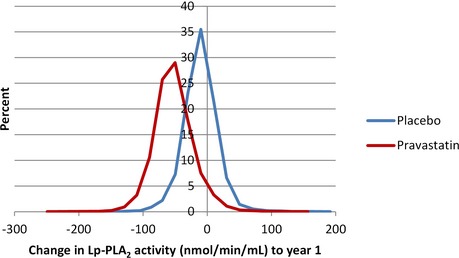
Distribution of lipoprotein‐associated phospholipase A2 (Lp‐PLA2) activity levels. Change in Lp‐PLA2 activity from baseline to 1 year by randomized treatment, P<0.001.
Figure 6.
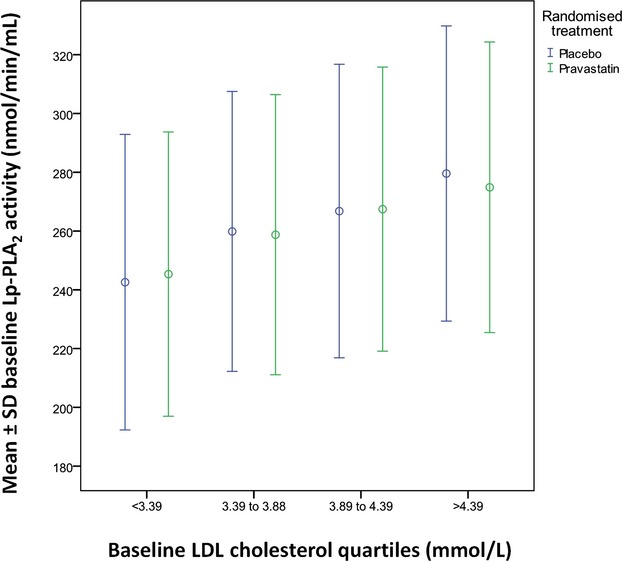
Lp‐PLA2 activity vs LDL‐C at baseline. LDL‐C indicates LDL cholesterol; Lp‐PLA2, lipoprotein‐associated phospholipase A2.
Figure 7.
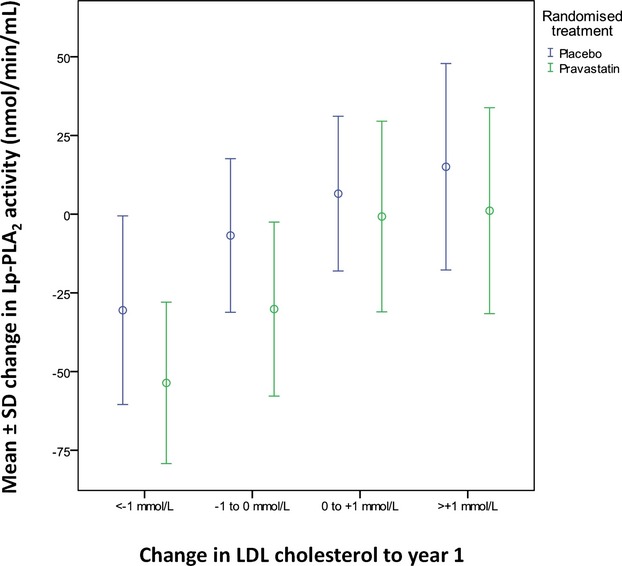
Change in Lp‐PLA2 activity vs change in LDL‐C. LDL‐C indicates LDL cholesterol; Lp‐PLA2, lipoprotein‐associated phospholipase A2.
Table 3.
Effect of Pravastatin Treatment on Clinical Events by Each Quartile of Baseline Lp‐PLA2 Activity
| End Point | Lp‐PLA2 Activity (nmol/min per milliliter) | Placebo (5‐y rate, %) | Pravastatin (5‐y rate, %) | Hazard Ratio (95% CI) | NNT (Based on Common HR) | Interaction P Value Trend |
|---|---|---|---|---|---|---|
| CHD events (CHD death or nonfatal MI) | ≤229 | 10.9 | 9.1 | 0.83 (0.64, 1.07) | 45 | 0.36 |
| 229 to 261 | 11.7 | 11.3 | 0.86 (0.68, 1.09 | 42 | ||
| 261 to 294 | 12.6 | 9.5 | 0.73 (0.57, 0.93) | 39 | ||
| >294 | 16.1 | 12.3 | 0.74 (0.59, 0.92) | 31 | ||
| Major CVD events (CVD death, nonfatal MI, or stroke) | ≤229 | 14.0 | 12.1 | 0.83 (0.66, 1.04) | 35 | 0.27 |
| 229 to 261 | 14.3 | 13.6 | 0.89 (0.72, 1.10) | 34 | ||
| 261 to 294 | 16.9 | 11.6 | 0.66 (0.53, 0.83) | 29 | ||
| >294 | 19.7 | 15.5 | 0.75 (0.62, 0.91) | 25 | ||
| Total CVD events (major CVD, unstable angina, or revascularization) | ≤229 | 32.9 | 30.8 | 0.88 (0.76, 1.02) | 25 | 0.63 |
| 229 to 261 | 34.8 | 30.0 | 0.86 (0.74, 0.99) | 24 | ||
| 261 to 294 | 35.4 | 31.0 | 0.83 (0.72, 0.96) | 24 | ||
| >294 | 40.3 | 35.5 | 0.84 (0.74, 0.97) | 22 | ||
| CHD death | ≤229 | 5.1 | 3.5 | 0.73 (0.49, 1.08) | 87 | 0.84 |
| 229 to 261 | 5.8 | 6.0 | 0.84 (0.60, 1.16) | 77 | ||
| 261 to 294 | 6.4 | 4.3 | 0.68 (0.47, 0.96) | 70 | ||
| >294 | 8.4 | 7.2 | 0.81 (0.61, 1.08) | 54 | ||
| All‐cause mortality | ≤229 | 9.1 | 7.2 | 0.78 (0.59, 1.02) | 49 | 0.92 |
| 229 to 261 | 10.4 | 9.8 | 0.81 (0.63, 1.03) | 43 | ||
| 261 to 294 | 10.7 | 7.7 | 0.64 (0.49, 0.84) | 42 | ||
| >294 | 11.8 | 10.7 | 0.83 (0.65, 1.04) | 38 |
CHD indicates coronary heart disease; CVD, cardiovascular disease; HR, hazard ratio; Lp‐PLA2, lipoprotein‐associated phospholipase A2; MI, myocardial infarction, NNT, number needed to treat.
Relationship Between Change in Lp‐PLA2 Activity and Events
Figure 8 shows the association of change of Lp‐PLA2 over 1 year with subsequent CVD events. A larger decrease in Lp‐PLA2 was associated with fewer CHD events (P<0.002), major CVD events (P=0.003), and total CVD events (P=0.001) after adjustment for baseline factors. In a landmark model looking at events after 1 year and adjusting for baseline brain natriuretic peptide, baseline cystatin C, baseline D‐dimer, baseline troponin I, baseline Lp‐PLA2 activity, and change in these same biomarkers, there was still a strong association with change in Lp‐PLA2 activity and CHD events (P<0.001) (Table 4). Further models were fitted to examine the strength of the association between change in Lp‐PLA2 activity and events after year 1. These models were not prespecified but were included as a sensitivity analysis. They showed that when baseline and change in LDL‐C were included in the model and/or when baseline and change in Lp‐PLA2 and LDL‐C were fitted as continuous variables rather than quartiles, the strong association between change in Lp‐PLA2 and CHD events was maintained, while change in LDL‐C was not a predictor of outcomes (data not shown).
Figure 8.
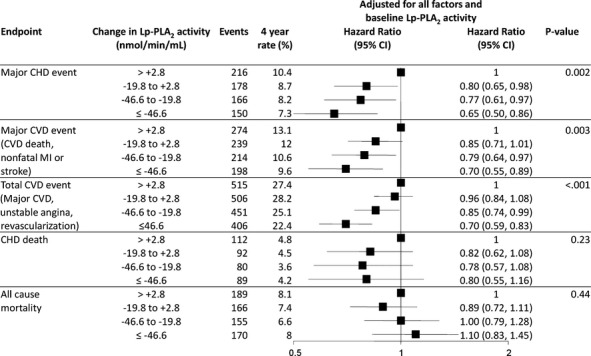
Quartiles of change in Lp‐PLA2 activity and prediction of CVD events. HR and 95% CI are adjusted for baseline variables: treatment, sex, stroke, diabetes, smoking, hypertension, total cholesterol, apolipoprotein B and A1, HDL‐C, age, nature of prior ACS, timing of coronary revascularization, SBP, atrial fibrillation, eGFR, BMI, dyspnea class, angina grade, WBC, peripheral vascular disease, triglycerides, fasting glucose, aspirin at baseline and change in LDL. ACS indicates acute coronary syndromes; BMI, body mass index; CHD, coronary heart disease; CVD, cardiovascular disease; eGFR, estimated glomerular filtration rate; HDL‐C, HDL cholesterol; HR, hazard ratio; Lp‐PLA2, lipoprotein‐associated phospholipase A2; MI, myocardial infarction; SBP, systolic blood pressure; WBC, white blood cell count.
Table 4.
Coronary Events After 1‐Year with Adjustment for Baseline Factors, Baseline Biomarkers and Change in Biomarkers
| Variables | Level | HR (95% CI) | P Value Trend |
|---|---|---|---|
| Baseline Lp‐PLA2 activity | ≤229.142 | 1 | 0.04 |
| 229.142 to 261.028 | 1.14 (0.91, 1.42) | ||
| 261.028 to 293.767 | 1.11 (0.89, 1.39) | ||
| >293.767 | 1.27 (1.01, 1.58) | ||
| Change in Lp‐PLA2 activity | ≤−46.6057 | 1 | <0.001 |
| −46.6057 to −19.8282 | 1.16 (0.92, 1.47) | ||
| −19.8282 to 2.8565 | 1.29 (0.99, 1.69) | ||
| >2.8565 | 1.61 (1.23, 2.11) |
Lp‐PLA2 indicates lipoprotein‐associated phospholipase A2; HR, hazard ratio.
Baseline Factors: Treatment, sex, stroke, diabetes, smoking, hypertension, total cholesterol, apolipoprotein B and A1, HDL cholesterol, age, nature of prior acute coronary syndromes, timing of coronary revascularization, systolic blood pressure, atrial fibrillation, estimated glomerular filtration rate, body mass index, dyspnea class, angina grade, white blood cell count, peripheral vascular disease, triglycerides, fasting glucose, and aspirin at baseline.
Baseline Biomarkers: Baseline brain natriuretic peptide, baseline cystatin C, baseline D‐dimer, baseline troponin I, and baseline Lp‐PLA2.
Change in Biomarkers: Change in brain natriuretic peptide, troponin I, and Lp‐PLA2 activity.
Extent of Pravastatin Treatment Effect Explained by Change in Lp‐PLA2
Figure 9 shows the effect of pravastatin versus placebo on CVD events before and after adjustment for changes in Lp‐PLA2 activity and LDL‐C. Pravastatin was associated with a 23% reduction in CHD events after adjustment for all baseline risk factors (P<0.001). After adjustment for change in LDL‐C, the estimated decrease in CHD events by pravastatin was reduced to 13%, accounting for ≈44% of the treatment effect. After adjustment for change in Lp‐PLA2 activity, the estimated decrease in CHD events by pravastatin was reduced to 10%, with 59% of the treatment effect accounted for by change in Lp‐PLA2 activity.
Figure 9.
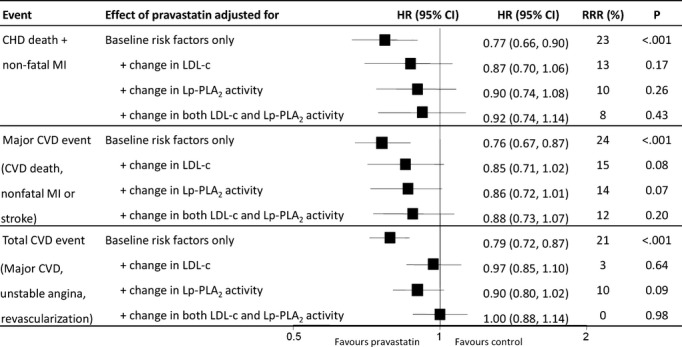
Effect of pravastatin on events after adjustment for changes in Lp‐PLA2 activity and LDL cholesterol (LDL‐C).9 Baseline and change in LDL‐C and Lp‐PLA2 activity are expressed as continuous variables. CHD indicates coronary heart disease; CVD, cardiovascular disease; HR, hazard ratio; Lp‐PLA2, lipoprotein‐associated phospholipase A2; MI, myocardial infarction; RRR, relative risk reduction.
When the expanded endpoint of total CVD events was used, the relative risk reduction with pravastatin was reduced after adjustment for both changes in Lp‐PLA2 and LDL‐C, to 0% (P=0.98). When these same analyses were conducted using quartiles of change, only change in Lp‐PLA2 activity, and not change in LDL‐C, accounted for the pravastatin treatment effect.
Discussion
This study is the largest and the longest study of CHD patients to evaluate the relationship of Lp‐PLA2 activity to CHD outcomes. Baseline Lp‐PLA2 activity levels were not related to outcomes except for CHD death. Lp‐PLA2 activity levels at randomization were reduced after 1 year on pravastatin by 16%. Similar relative effects of pravastatin were observed within each subgroup defined by baseline Lp‐PLA2 quartiles but with greater absolute benefit among those with higher baseline levels. While baseline Lp‐PLA2 activity was not independently associated with outcomes after adjustment for all other risk factors, reduction in Lp‐PLA2 activity from randomization to 1 year was a significant independent predictor of CHD events even after adjustment for treatment and 23 baseline risk factors. This remained highly significant even after adjustment for change in brain natriuretic peptide, tropinin I, and LDL‐C.
The major novel finding of this study is that change in Lp‐PLA2 levels accounted for at least as much of the pravastatin treatment effect on reducing CHD death and MI as did LDL‐C reduction. While the changes in Lp‐PLA2 and LDL‐C are related, this observation suggests that statins could reduce CHD risk in part by decreasing Lp‐PLA2 activity.4,11 The CIs around estimates of proportion of treatment effect explained are wide and do not enable meaningful comparison between the estimates for LDL‐C and Lp‐PLA2, which limits the conclusions that can be made from these results. However, all statistical models showed that change in Lp‐PLA2 was at least as strongly associated with CHD events as was change in LDL‐C.
Lp‐PLA2 is produced by blood‐borne inflammatory cells (monocytes, macrophages, T cells, mast cells) and is predominantly carried by LDL.12 Pathological studies in animals have shown increased staining for Lp‐PLA2 in thin cap fibroatheroma and ruptured vulnerable plaques.2 Higher plasma levels of Lp‐PLA2 have also been shown to be associated with coronary artery endothelial dysfunction in humans,13 and coronary production of Lp‐PLA2 is correlated with the degree of plaque as assessed by intravascular ultrasound.14
In an analysis of 79 000 patients from 32 studies, Lp‐PLA2 activity was shown to be higher in men than in women and to be positively associated with LDL‐C and inversely correlated with HDL cholesterol.4 Higher plasma levels of Lp‐PLA2 were associated with cardiovascular events, including mortality, MI, and stroke.
Statins have been shown to reduce Lp‐PLA2 activity levels.6–7,6–16 In the PRavastatin OR atorVastatin Evaluation and Infection Therapy (PROVE‐IT) study, treatment with atorvastatin 80 mg/d was associated with a 20% reduction in Lp‐PLA2 activity at 30 days (P<0.001), whereas Lp‐PLA2 rose 3.6% with pravastatin 40 mg/d (P<0.001).7 There was no placebo control group in this study. It is possible that as Lp‐PLA2 levels fall after acute coronary syndromes, as part of an acute‐phase reaction, that the effect of pravastatin on decreasing Lp‐PLA2 activity may have been obscured by levels increasing back toward the baseline levels that existed before the acute coronary syndrome. In a study of subjects free of CVD, Lp‐PLA2 levels were reduced 12.3% with pravastatin 40 mg at 12 months compared with placebo.15
In the Heart Protection Study (HPS), simvastatin reduced Lp‐PLA2 activity by 25%, but the effects of simvastatin on vascular outcomes did not vary according to Lp‐PLA2 levels.6
In the Justification for the Use of statins in Prevention: an Intervention Trial Evaluating Rosuvastatin (JUPITER) trial, Lp‐PLA2 activity was associated with cardiovascular risk.16 Rosuvastatin reduced Lp‐PLA2 activity by 33.2% (P<0.0001), and Lp‐PLA2 no longer predicted risk in patients treated with rosuvastatin. The mechanisms for inhibition of Lp‐PLA2 activity by statins are not well defined. However, simvastatin has been shown to reduce Lp‐PLA2 expression and activity in lipopolysaccharide‐stimulated human myocyte‐derived macrophages through inhibition of the mevalonate–geranylgeranyl pyrophosphate–RhoA–p38 mitogen‐activated protein kinase pathway.17
In the current study, it is not known if pravastatin also reduced the Lp‐PLA2 activity in plaques. If this occurred, the complexity of coronary lesions may have been reduced and potentially progression of the necrotic core may have been halted with stabilization of coronary atheromatous plaques. This could explain the reduction in CHD events that was observed. The results from the Cholesterol Treatment Trialists (CTT) overview, which did not use a landmark analysis, are consistent with most of the effects of statins being correlated with the size of the magnitude of reduction in LDL‐C change, but this can still allow for additional mechanisms to contribute.18 We have previously shown that ≈50%9 of the treatment effect of pravastatin in the LIPID study was explained by reduction in LDL‐C.
Darapladib, a potent reversible inhibitor of Lp‐PLA2, has been shown in diabetic, hypercholesterolemic pigs to reduce the inflammatory product of Lp‐PLA2 lysophosphatidylcholine content of coronary plaque and to reduce macrophage infiltration into the arterial wall and to reduce the necrotic core of plaque.19 In humans, darapladib has been shown to lower Lp‐PLA2 activity by 60% and, in the Integrated Biomarker and Imaging Study‐2 (IBIS 2) trial, to reduce the secondary end point of the necrotic core of coronary artery plaque.20 Ongoing randomized trials of darapladib will establish whether lowering of Lp‐PLA2 activity may lower the risk of cardiovascular death, MI, and stroke after MI21 and after an acute coronary syndrome.22
Limitations
There are several limitations of this study. These findings are from a clinical study and the randomized patients may not be fully representative of patients seen in clinical practice. Biomarker data were not available in some patients. However, the patients excluded compared with the patients included were younger, more likely to be male, and more likely to not have a history of hypertension and to not have had coronary revascularization.
There are limitations in using a landmark analysis to determine what proportion of treatment effect can be explained by change in a particular biomarker. Measurement error in the landmark analyses would tend to underestimate the associations we found. Estimates of the proportion of treatment effect accounted for by change in a biomarker are inherently imprecise.23 Nonetheless, the observation that changes in Lp‐PLA2 accounted for at least as much of the pravastatin effect as LDL‐C reduction is informative and provides support for the hypothesis that part of the pravastatin effect is mediated through Lp‐PLA2 change.
Conclusion
Higher baseline levels of Lp‐PLA2 activity significantly predicted an increased risk of CVD events including CHD death and MI, total CVD events, and all‐cause mortality, but not in multivariate analyses except for CHD death. Pravastatin significantly reduced Lp‐PLA2 activity over 1 year by 16% compared with placebo. Similar relative effects of pravastatin were observed within each subgroup defined by baseline Lp‐PLA2 quartiles and greater absolute benefit was found in those with higher baseline levels.
Reduction in Lp‐PLA2 strongly predicts a reduction in subsequent CHD events after adjustment for treatment, 23 baseline risk factors, and other biomarkers and for changes in other biomarkers and for reduction in LDL‐C.
Changes in Lp‐PLA2 appears to account for much of the pravastatin treatment effect (more than half) and appear to be at least as important as changes in LDL‐C. Some of the effect of Lp‐PLA2 change (and LDL‐C change) may be surrogates for each other, but both appear to account for more of the treatment effect than change in LDL‐C alone. This novel finding requires validation in other studies, especially in ongoing trials. These results raise the possibility of additional mechanisms of statin effects on CVD event reduction and also provide a rationale for ongoing trials testing inhibitors of Lp‐PLA2 activity.
Authors' Contributions
All authors had full access and contributed equally to the content of the manuscript. Dr Simes had full access to all the data in the study and takes responsibility for the integrity of the data and the accuracy of the data analysis. The corresponding author had full access to all the data in the study and had final responsibility for the decision to submit for publication. The corresponding author has not been paid to write this article by a pharmaceutical company or any other agency.
Sources of Funding
This work was supported by the National Health and Medical Research Council (NHMRC) of Australia and DiaDexus, San Francisco, CA. The LIPID study was supported by a research grant from Bristol‐Myers Squibb (BMS), Princeton, NJ, and was conducted independently of the sponsor under the auspices of the National Heart Foundation of Australia. The NHMRC, BMS, and DiaDexus had no role in the design and conduct of the study; collection, management, analysis, and interpretation of the data; and preparation, review, or approval of the manuscript.
Disclosures
Dr White has received research grants from Sanofi Aventis; Eli Lilly; Medicines Company; NIH; Pfizer; Roche; Johnson & Johnson; Schering Plough; Merck Sharpe & Dohme; Astra Zeneca; GlaxoSmithKline; Daiichi Sankyo Pharma Development and Bristol‐Myers Squibb and has served on Advisory boards for Merck Sharpe & Dohme, Roche, Astra Zeneca and Regado Biosciences. Drs Simes, Stewart, Barnes, Marschner, Thompson, Zeller, Colquhoun, Keech, and Hunt have no conflicts. Dr Blankenberg has received research grants from Boehringer Ingelheim, Bayer, Abbott Diagnostics, SIEMENS, and Thermo Fisher. He has received lecture fees from Astra Zeneca, Bayer, Boehringer Ingelheim, SIEMENS, Abbott Diagnostics and has been a member of Advisory Boards for Boehringer Ingelheim, Bayer, and ThermoFisher. Dr West has received research grants from Merck Sharpe & Dohme; Astra Zeneca; GlaxoSmithKline and Bristol‐Myers Squibb. Dr Nestel is an Advisory Board member for AstraZeneca and Merck Sharpe & Dohme and does consultancy work for AstraZeneca and Merck Sharpe & Dohme. Dr Sullivan has received research grants from AstraZeneca, Eli Lilly, Merck Sharpe and Dohme, AMGEN and Sanofi Aventis and has served on advisory boards of Abbott, Merck Sharpe and Dohme and AMGEN. Dr Tonkin has received research grants from AstraZeneca; Bristol‐Myers Squibb; Merck Sharpe & Dohme and NIH and has been a member of Advisory boards for AstraZeneca; Merck Sharpe & Dohme and Pfizer.
Acknowledgments
We would like to thank the LIPID Investigators5 and patients who participated in the LIPID study. We would also like to thank Charlene Nell, team support administrator, Green Lane Cardiovascular Research Unit, for excellent secretarial assistance.
References
- 1.Macphee CH, Moores KE, Boyd HF, Dhanak D, Ife RJ, Leach CA, Leake DS, Milliner KJ, Patterson RA, Suckling KE, Tew DG, Hickey DM. Lipoprotein‐associated phospholipase A2, platelet‐activating factor acetylhydrolase, generates two bioactive products during the oxidation of low‐density lipoprotein: use of a novel inhibitor. Biochem J. 1999; 338Pt 2:479-487 [PMC free article] [PubMed] [Google Scholar]
- 2.Kolodgie FD, Burke AP, Skorija KS, Ladich E, Kutys R, Makuria AT, Virmani R. Lipoprotein‐associated phospholipase A2 protein expression in the natural progression of human coronary atherosclerosis. Arterioscler Thromb Vasc Biol. 2006; 26:2523-2529 [DOI] [PubMed] [Google Scholar]
- 3.Virmani R, Burke AP, Farb A, Kolodgie FD. Pathology of the vulnerable plaque. J Am Coll Cardiol. 2006; 47:C13-C18 [DOI] [PubMed] [Google Scholar]
- 4.The Lp‐PLA2 Studies Collaboration Lipoprotein‐associated phospholipase A2 and risk of coronary disease, stroke, and mortality: collaborative analysis of 32 prospective studies. Lancet. 2010; 375:1536-1544 [DOI] [PMC free article] [PubMed] [Google Scholar]
- 5.The Long‐Term Intervention with Pravastatin in Ischaemic Disease (LIPID) Study Group Prevention of cardiovascular events and death with pravastatin in patients with coronary heart disease and a broad range of initial cholesterol levels. N Engl J Med. 1998; 339:1349-1357 [DOI] [PubMed] [Google Scholar]
- 6.Heart Protection Study Collaborative Group Lipoprotein‐associated phospholipase A2 activity and mass in relation to vascular disease and nonvascular mortality. J Intern Med. 2010; 268:348-358 [DOI] [PubMed] [Google Scholar]
- 7.O'Donoghue M, Morrow DA, Sabatine MS, Murphy SA, McCabe CH, Cannon CP, Braunwald E. Lipoprotein‐associated phospholipase A2 and its association with cardiovascular outcomes in patients with acute coronary syndromes in the PROVE IT‐TIMI 22 (pravastatin or atorvastatin evaluation and infection therapy‐thrombolysis in myocardial infarction) trial. Circulation. 2006; 113:1745-1752 [DOI] [PubMed] [Google Scholar]
- 8.Friedewald WT, Levy RI, Fredrickson DS. Estimation of the concentration of low‐density lipoprotein cholesterol in plasma, without use of the preparative ultracentrifuge. Clin Chem. 1972; 18:499-502 [PubMed] [Google Scholar]
- 9.Simes RJ, Marschner IC, Hunt D, Colquhoun D, Sullivan D, Stewart RAH, Hague W, Keech A, Thompson P, White H, Shaw J, Tonkin ALIPID Study Investigators Relationship between lipid levels and clinical outcomes in the long‐term intervention with pravastatin in ischemic disease (LIPID) trial: to what extent is the reduction in coronary events with pravastatin explained by on‐study lipid levels? Circulation. 2002; 105:1162-1169 [DOI] [PubMed] [Google Scholar]
- 10.Marschner IC, Colquhoun D, Simes RJ, Glasziou P, Harris P, Singh BB, Friedlander D, White H, Thompson P, Tonkin ALIPID Study Investigators Long‐term risk stratification for survivors of acute coronary syndromes: results from the long‐term intervention with pravastatin in ischemic disease (LIPID) study. J Am Coll Cardiol. 2001; 38:56-63 [DOI] [PubMed] [Google Scholar]
- 11.Packard CJ, O'Reilly DSJ, Caslake MJ, McMahon AD, Ford I, Cooney J, Macphee CH, Suckling KE, Krishna M, Wilkinson FE, Rumley A, Lowe GDOWest of Scotland Coronary Prevention Study Group Lipoprotein‐associated phospholipase A2 as an independent predictor of coronary heart disease. N Engl J Med. 2000; 343:1148-1155 [DOI] [PubMed] [Google Scholar]
- 12.Zalewski A, Macphee C. Role of lipoprotein‐associated phospholipase A2 in atherosclerosis: biology, epidemiology, and possible therapeutic target. Arterioscler Thromb Vasc Biol. 2005; 25:923-931 [DOI] [PubMed] [Google Scholar]
- 13.Yang EH, McConnell JP, Lennon RJ, Barsness GW, Pumper G, Hartman SJ, Rihal CS, Lerman LO, Lerman A. Lipoprotein‐associated phospholipase A2 is an independent marker for coronary endothelial dysfunction in humans. Arterioscler Thromb Vasc Biol. 2006; 26:106-111 [DOI] [PubMed] [Google Scholar]
- 14.Lavi S, McConnell JP, Rihal CS, Prasad A, Mathew V, Lerman LO, Lerman A. Local production of lipoprotein‐associated phospholipase A2 and lysophosphatidylcholine in the coronary circulation: association with early coronary atherosclerosis and endothelial dysfunction in humans. Circulation. 2007; 115:2715-2721 [DOI] [PubMed] [Google Scholar]
- 15.Albert MA, Glynn RJ, Wolfert RL, Ridker PM. The effect of statin therapy on lipoprotein associated phospholipase A2 levels. Atherosclerosis. 2005; 182:193-198 [DOI] [PubMed] [Google Scholar]
- 16.Ridker PM, MacFadyen JG, Wolfert RL, Koenig W. Relationship of lipoprotein‐associated phospholipase A(2) mass and activity with incident vascular events among primary prevention patients allocated to placebo or to statin therapy: an analysis from the JUPITER trial. Clin Chem. 2012; 58:877-886 [DOI] [PubMed] [Google Scholar]
- 17.Song JX, Ren JY, Chen H. Simvastatin reduces lipoprotein‐associated phospholipase A2 in lipopolysaccharide‐stimulated human monocyte‐derived macrophages through inhibition of the mevalonate‐geranylgeranyl pyrophosphate‐Rhoa‐p38 mitogen‐activated protein kinase pathway. J Cardiovasc Pharmacol. 2011; 57:213-222 [DOI] [PubMed] [Google Scholar]
- 18.Boekholdt SM, Arsenault BJ, Mora S, Pedersen TR, LaRosa JC, Nestel PJ, Simes RJ, Durrington P, Hitman GA, Welch KM, DeMicco DA, Zwinderman AH, Clearfield MB, Downs JR, Tonkin AM, Colhoun HM, Gotto AM, Jr, Ridker PM, Kastelein JJ. Association of LDL cholesterol, non‐HDL cholesterol, and apolipoprotein B levels with risk of cardiovascular events among patients treated with statins: a meta‐analysis. JAMA. 2012; 307:1302-1309 [DOI] [PubMed] [Google Scholar]
- 19.Wilensky RL, Shi Y, Mohler ER, III, Hamamdzic D, Burgert ME, Li J, Postle A, Fenning RS, Bollinger JG, Hoffman BE, Pelchovitz DJ, Yang J, Mirabile RC, Webb CL, Zhang L, Zhang P, Gelb MH, Walker MC, Zalewski A, Macphee CH. Inhibition of lipoprotein‐associated phospholipase A2 reduces complex coronary atherosclerotic plaque development. Nat Med. 2008; 14:1059-1066 [DOI] [PMC free article] [PubMed] [Google Scholar]
- 20.Serruys PW, Garcia‐Garcia HM, Buszman P, Erne P, Verheye S, Aschermann M, Duckers H, Bleie O, Dudek D, Botker HE, von Birgelen C, D'Amico D, Hutchinson T, Zambanini A, Mastik F, van Es GA, van der Steen AF, Vince DG, Ganz P, Hamm CW, Wijns W, Zalewski A. Effects of the direct lipoprotein‐associated phospholipase A(2) inhibitor darapladib on human coronary atherosclerotic plaque. Circulation. 2008; 118:1172-1182 [DOI] [PubMed] [Google Scholar]
- 21.White HD, Held C, Stewart RA, Watson D, Harrington R, Budaj A, Steg G, Cannon C, Tarka E, Krug‐Gourley S, Wittes J, Trivedi T, Wallentin LSTABILITY Steering Committee Study design and rationale for the clinical outcomes of the STABILITY Trial (stabilisation of atherosclerotic plaque by initiation of darapladib therapy) comparing darapladib versus placebo in patients with clinical coronary heart disease). Am Heart J. 2010; 160:655-661 [DOI] [PubMed] [Google Scholar]
- 22.O'Donoghue ML, Braunwald E, White HD, Serruys P, Steg PG, Hochman J, Maggioni AP, Bode C, Weaver D, Johnson JL, Cicconetti G, Lukas MA, Tarka E, Cannon CP. Study design and rationale for the stabilization of plaques using darapladib‐thrombolysis in myocardial infarction (SOLID‐TIMI 52) trial in patients after an acute coronary syndrome. Am Heart J. 2011; 162:613-619 [DOI] [PubMed] [Google Scholar]
- 23.Burzykowski T, Molenberghs G, Buyse M. The Evaluation of Surrogate Endpoints. 2005New York: Springer [Google Scholar]