

Abstract
Background
Hydrogen sulfide (H2S) has been implicated in regulating cardiovascular pathophysiology in experimental models. However, there is a paucity of information regarding the levels of H2S in health and cardiovascular disease. In this study we examine the levels of H2S in patients with cardiovascular disease as well as bioavailability of nitric oxide and inflammatory indicators.
Methods and Results
Patients over the age of 40 undergoing coronary or peripheral angiography were enrolled in the study. Ankle brachial index (ABI) measurement, measurement of plasma‐free H2S and total nitric oxide (NO), thrombospondin‐1 (TSP‐1), Interleukin‐6 (IL‐6), and soluble intercellular adhesion molecule‐1 (sICAM‐1) levels were performed. Patients with either coronary artery disease alone (n=66), peripheral arterial disease (PAD) alone (n=13), or any vascular disease (n=140) had higher plasma‐free H2S levels compared to patients without vascular disease (n=53). Plasma‐free H2S did not distinguish between disease in different vascular beds; however, total NO levels were significantly reduced in PAD patients and the ratio of plasma free H2S to NO was significantly greater in patients with PAD. Lastly, plasma IL‐6, ICAM‐1, and TSP‐1 levels did not correlate with H2S or NO bioavailability in either vascular disease condition.
Conclusions
Findings reported in this study reveal that plasma‐free H2S levels are significantly elevated in vascular disease and identify a novel inverse relationship with NO bioavailability in patients with peripheral arterial disease.
Clinical Trial Registration
URL: http://www.clinicaltrials.gov. Unique identifier: NCT01407172.
Keywords: coronary artery disease, hydrogen sulfide, nitric oxide, peripheral arterial disease
Introduction
Nitric oxide (NO) and hydrogen sulfide (H2S) are now well‐established gasotransmitters with protean functions in human biology including specific roles in cardiovascular physiology that continue to be elucidated. Both of these gaseous mediators are synthesized through enzymatic and nonenzymatic pathways. NO production classically occurs in an enzymatic manner via the nitric oxide synthase (NOS) isoenzymes with nonenzymatic reduction of nitrite/nitrate serving as alternative pathways.1 Likewise, H2S is also produced by 3 principal enzymes including cystathionine γ‐lyase (CGL/CSE), cystathionine β‐synthase (CBS), and 3‐mercaptopyruvate transferase (3‐MST),2–3 with nonenzymatic generation via glutathione and other sulfane sulfur redox pathways.4 Biological effects of NO and H2S occur predominately through small molecule interactions and posttranslational protein thiol modifications.5 Moreover, studies have suggested a role for H2S in vasodilation as an alternative to nitric oxide; as well as regulation of atherogenesis at the cellular and molecular level.6–8 Importantly, reports have suggested that H2S can affect endothelial nitric oxide synthase (eNOS) expression and function while also increasing nitrite anion reduction to NO, thereby establishing an alternate pathway for regulating NO bioavailability.9–10 However, no information currently exists regarding biochemical relationships between NO and H2S in clinical settings.
Precise understanding of H2S pathophysiology has been impeded by controversies in its measurement. The most widely used assay, the methylene blue method, lacks specificity and is subject to various sources of error in the measurement of bioavailable free H2S.11–13 These issues aside, there still remains a paucity of information on clinical H2S levels in humans associated with cardiovascular disease. The few papers that have explored this have been hampered by the use of older methods and associated limitations.14 Recent advances in H2S detection methods have identified accurate and reliable analytical approaches with which to measure free bioavailable H2S, including the ability to distinguish differences in levels amongst various mutant, germ free, and wild type animals.12,15–16 Using these analytical measurement methods, we have obtained insight into plasma‐free H2S levels in young healthy adults, but such information in patients with cardiovascular disease remains unknown.17 In an effort to understand the relationship between bioavailable free H2S and NO in patients with and without vascular disease, we undertook an unbiased observational clinical study measuring these molecules in plasma from patients presenting for coronary or peripheral angiography at our institution. Additionally, we also measured plasma thrombospondin‐1 (TSP‐1), interleukin‐6 (IL‐6) and soluble intercellular adhesion molecule‐1 (sICAM‐1) levels. Here we report changes in plasma‐free H2S levels that are differentially associated with NO depending on cardiovascular disease status.
Methods
Study Design
Our clinical study complied with the declaration of Helsinki and was approved by the institutional review board of the Louisiana State University Health Sciences Center at Shreveport (LSUHSC‐S) and was registered at www.clinicaltrials.gov, NCT 01407172.
Patients over the age of 40 undergoing cardiac catheterization or peripheral angiogram via a major arterial approach at the LSUHSC‐S cardiac catheterization laboratory or vascular surgery suite were enrolled in the study. Our protocol took advantage of the fact that we broadly enrolled patients with suspected cardiovascular disease that was either confirmed or ruled out by angiography. The patients presented for angiography for the usual clinically accepted indications including cases of coronary angiography, unstable angina, non‐ST elevation myocardial infarction, and stable angina. Similarly, peripheral angiography was performed for claudication and critical limb ischemia. All patients had the measurement of the ankle brachial index performed by the straight wrapping method, as currently recommended,18 with an 8‐MHz hand‐held Doppler by a single physician operator. ABI measurement was performed prior to angiography in all patients. In this way, we were able to recruit and enroll patients in an unbiased manner and then separate them into distinct disease cohorts as discussed below. A total of 271 patients were enrolled in the study with 78 patients excluded due to various reasons including non‐compressible vessels (at the time of study initiation defined as an ABI >1.3), excess number of enrolled nonperipheral artery disease patients beyond IRB‐approved numbers allowed for further study, sample processing quality control failures (eg, exceeding collection tube incubation time or specimen hemolysis), or other issues (eg, cancellation of planned procedure). A total of 193 patients were studied and, based on the ankle brachial index or known peripheral artery disease (PAD) status, were classified as follows:
Patients without PAD as defined by ABI >0.9 and <1.3.
Patients with PAD as defined by an ABI <0.9 or documented PAD on peripheral angiogram or with prior peripheral arterial interventions.
The above groups were then divided according to the presence or absence of coronary artery disease (CAD) on the basis of their coronary angiogram using the currently accepted definitions for the same (ie, presence of >50% stenosis in at least 1 major epicardial coronary artery of size greater 2 mm).19 In a few cases, coronary angiography could not be performed and CAD diagnosis was performed on the basis of medical history using the same criterion or history of prior myocardial infarction. Figure 1 illustrates the flow chart of cohort assignments along with the number of subjects per cohort.
Figure 1.
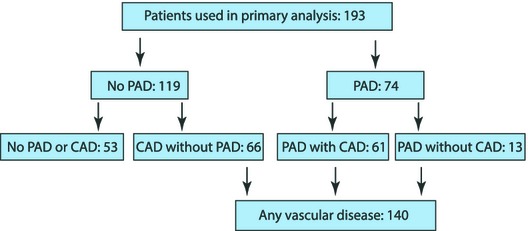
Study organization flow chart. A total of 193 patients were used for analysis, including a total of 74 PAD patients along with 119 non‐PAD patients who were subsequently diagnosed with or without CAD after cardiac catheterization. CAD indicates coronary artery disease; PAD, peripheral artery disease.
Exclusion Criteria
Patients were excluded from the study if they were unable to provide informed consent, were enrolled in another clinical trial requiring the use of experimental therapeutic agents, or were pregnant or nursing. Additional exclusion criteria included patients with nonatherosclerotic PAD (eg, Buerger's disease) and those with ABI >1.3 (indicative of noncompressible vessel needing further evaluation to diagnose PAD) unless they had documented known PAD. Patients presenting with ST elevation myocardial infarction or cardiogenic shock were also excluded to avoid delays in care.
Historical Data and Blood Collection
Medical record data were collected and patient interviews were conducted to assess for the presence of traditional risk factors (hypertension, dyslipidemia, diabetes, obesity, smoking, and racial and sex classification). Under routine aseptic conditions, a femoral or radial vascular access sheath was placed at the operator's discretion for the performance of the procedure. Twelve milliliters of blood was then collected into a sterile 20‐mL syringe after bleed back to ensure that no contamination with saline used to flush catheters occurred. This sample of blood was then directly injected into 2 plastic 6‐mL lithium heparin vacutainer tubes. Lithium heparin collection tubes were selected after initial experiments using healthy blood donors who demonstrated decreased hemolysis compared to ethylenediaminetetraacetic acid (EDTA) collections tubes, a phenomenon that has also been previously demonstrated by others particularly if the EDTA tube is incorrectly filled20 (Figure 2A and 2B). After inversion 4 to 5 times to ensure adequate mixing with the anticoagulant, the tube was placed on ice and transported to the research lab. To ensure consistency across samples, specimens were centrifuged at 9 minutes after collection for 4 minutes at a RCF (relative centrifugal force) of 1500g.
Figure 2.
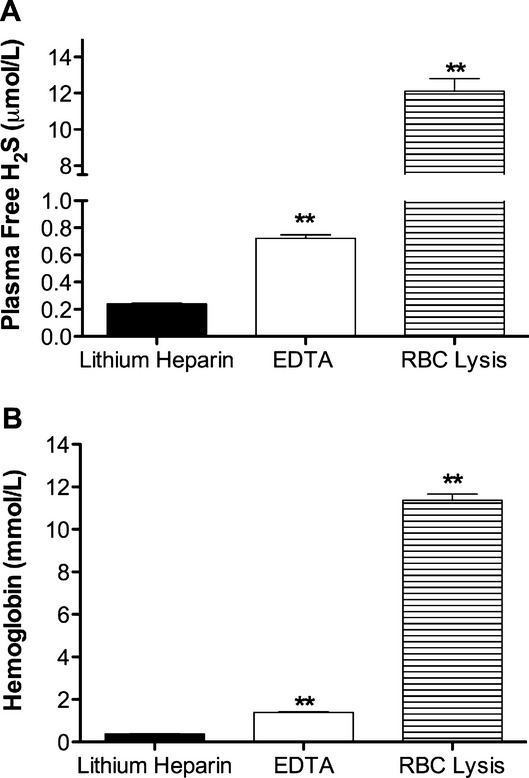
Effect of blood collection tubes on plasma hydrogen sulfide (H2S) levels. Venous blood was collected from healthy volunteers in either lithium heparin or ethylenediaminetetraacetic acid (EDTA) vacutainer collection tubes. A, reports the differences in plasma free H2S between the different collection tubes vs lysed red blood cells (RBC) (**P<0.01 vs lithium heparin collection tubes). B, illustrates amount of cell free hemoglobin measured using the Drabkin assayin plasma from blood collected in various tubes vs lysed red blood cells (**P<0.01 vs lithium heparin collection tubes).
Measurement of Plasma Free H2S and Total Nitric Oxide
Plasma samples were analyzed for H2S as previously described.12 Briefly, plasma free H2S was measured by reversed‐phase high‐performance liquid chromatography (RP‐HPLC) after derivatization with excess monobromobimane (MBB) to form the stable sulfide‐dibimane derivative. Thirty microliters of plasma was mixed with 70 μL of 100‐mmol/L Tris‐HCl buffer (pH 9.5, 0.1 mmol/L DTPA), followed by addition of 50 μL of 10‐mmol/L MBB. The reaction was stopped after 30 minutes by adding 50 μL of 200‐mmol/L 5‐sulfosalicylic acid, and then the sample was centrifuged and the supernatant analyzed using a Shimadzu Prominence HPLC with fluorescence detection (λex: 390 nm and λem: 475 nm) and an Eclipse XDB‐C18 column. A separate aliquot of plasma was placed in NO preservation solution (800 mmol/L potassium ferricyanide, 17.6 mmol/L N‐ethylmaleimide, and 6% nonidet P40) for tri‐iodide NO chemiluminescent analysis as we have previously reported.21 All plasma levels of H2S or NO were quantified based on sulfide dibimane and sodium nitrite standard curves, respectively. Finally, a third plasma aliquot was used for enzyme‐linked immunosorbent assay (ELISA) measurement of thrombospondin‐1 (TSP‐1), IL‐6 and sICAM‐1 levels using the commercially available ELISA assays (R&D Systems, Cayman Chemicals, and Thermo Scientific, respectively) per the manufacturer's instructions.
Statistical Analysis
Based on our initial analytical measurements of plasma‐free H2S levels in mice and humans,17 a power analysis was performed (to 0.8) to identify the number of subjects needed assuming a 15% difference among subjects with or without PAD as well as a 5% drop out rate. This yielded 110 subjects per cohort for a total of 220 subjects. Data were analyzed with Statistical Package for Social Sciences version 16.0 (SPSS for Windows 7). A P value of <0.05 was required to achieve statistical significance. Linear regression analysis, independent sample t test, chi square test, and Spearman and Pearson's correlation analysis were performed based on the normality of the data and type of variable as noted below in the results section.
Results
Demographics and Baseline Characteristics
Clinical characteristics of the enrolled patients were analyzed on the basis of the presence and absence of vascular disease (ie, patients with either or both PAD and CAD versus those without vascular disease [Table 1]). These data report phenotypic characteristics and associated percentages of the cohorts including race, sex, and traditional cardiovascular risk factors. Category percentages per cohort are listed in Table 1. Table 2 also lists the prevalence of pharmaceutical agents that were taken by each patient cohort.
Table 1.
Patient Demographic Characteristics
| Diagnosis | ||||||||
|---|---|---|---|---|---|---|---|---|
| No Vascular Disease (53 Patients) | Any Vascular Disease (140 Patients) | CAD Alone (66 Patients) | PAD Alone (13 Patients) | |||||
| Mean±SD | Count (N%) | Mean±SD | Count (N%) | Mean±SD | Count (N%) | Mean±SD | Count (N%) | |
| Age, y | 53 ± 8.6 | 57 ± 8.5 | 55 ± 8.7 | 58 ± 8.0 | ||||
| Gender | ||||||||
| Male | 15 (28.3) | 85 (60.7) | 39 (59.1) | 9 (69.2) | ||||
| Female | 38 (71.7) | 55 (39.3) | 27 (40.9) | 4 (30.8) | ||||
| Race | ||||||||
| Nonblack | 14 (26.4) | 66 (47.1) | 38 (57.6) | 5 (38.5) | ||||
| Black | 39 (73.6) | 74 (52.9) | 28 (42.4) | 8 (61.5) | ||||
| Dyslipidemia | ||||||||
| No | 32 (60.4) | 38 (27.1) | 19 (28.8) | 4 (30.8) | ||||
| Yes | 21 (39.6) | 102 (72.9) | 47 (71.2) | 9 (69.2) | ||||
| DM | ||||||||
| No | 36 (67.9) | 85 (60.7) | 38 (57.6) | 9 (69.2) | ||||
| Yes | 17 (32.1) | 55 (39.3) | 28 (42.4) | 4 (30.8) | ||||
| HTN | ||||||||
| No | 10 (18.9) | 10 (7.1) | 3 (4.5) | 2 (15.4) | ||||
| Yes | 43 (81.1) | 130 (92.9) | 63 (95.5) | 11 (84.6) | ||||
| Obesity | ||||||||
| Nonobese | 17 (32.1) | 68 (48.6) | 28 (42.4) | 8 (61.5) | ||||
| Obese | 36 (67.9) | 72 (51.4) | 38 (57.6) | 5 (38.5) | ||||
| Smoking | ||||||||
| Nonsmoker | 37 (69.8) | 70 (50.0) | 35 (53.0) | 4 (30.8) | ||||
| Smoker | 16 (30.2) | 70 (50.0) | 31 (47.0) | 9 (69.2) | ||||
CAD indicates coronary artery disease; DM, diabetes mellitus; HTN, hypertension; PAD, peripheral artery disease; SD, standard deviation.
Table 2.
Patient Medications Taken
| Home Medications | Diagnosis | |||||||
|---|---|---|---|---|---|---|---|---|
| No Vascular Disease | Any Vascular Disease | CAD Alone | PAD Alone | |||||
| Count | N% | Count | N% | Count | N% | Count | N% | |
| Aspirin | ||||||||
| No | 24 | 45.3 | 42 | 30.0 | 18 | 27.3 | 3 | 23.1 |
| Yes | 29 | 54.7 | 98 | 70.0 | 48 | 72.7 | 10 | 76.9 |
| Clopidogrel | ||||||||
| No | 46 | 86.8 | 92 | 65.7 | 46 | 69.7 | 12 | 92.3 |
| Yes | 7 | 13.2 | 48 | 34.3 | 20 | 30.3 | 1 | 7.7 |
| Other Antiplatelet | ||||||||
| No | 53 | 100.0 | 138 | 98.6 | 65 | 98.5 | 12 | 92.3 |
| Yes | 0 | 0.0 | 2 | 1.4 | 1 | 1.5 | 1 | 7.7 |
| β Blocker | ||||||||
| No | 21 | 39.6 | 43 | 30.7 | 18 | 27.3 | 10 | 76.9 |
| Yes | 32 | 60.4 | 97 | 69.3 | 48 | 72.7 | 3 | 23.1 |
| ACE/ARB | ||||||||
| No | 28 | 52.8 | 38 | 27.1 | 20 | 30.3 | 5 | 38.5 |
| Yes | 25 | 47.2 | 102 | 72.9 | 46 | 69.7 | 8 | 61.5 |
| Statin | ||||||||
| No | 28 | 52.8 | 40 | 28.6 | 18 | 27.3 | 5 | 38.5 |
| Yes | 25 | 47.2 | 100 | 71.4 | 48 | 72.7 | 8 | 61.5 |
| Cilostazol | ||||||||
| No | 53 | 100.0 | 137 | 97.9 | 66 | 100.0 | 12 | 92.3 |
| Yes | 0 | 0.0 | 3 | 2.1 | 0 | 0.0 | 1 | 7.7 |
ACE indicates angiotensin‐converting enzyme; ARB, angiotensin receptor blocker; CAD, coronary artery disease; PAD, peripheral artery disease.
Plasma Free H2S and Vascular Disease
Linear regression analysis and independent sample t test were employed to examine the relationship between H2S bioavailability and specific cardiovascular disease status. Plasma‐free H2S levels in patients with either vascular disease (mean 441.0 nmol/L) were significantly elevated compared to patients without vascular disease (mean 368.5 nmol/L, P=0.01) (Table 3). Importantly, elevated H2S levels seen in patients with either vascular disease compared to those without vascular disease was independent of traditional risk factors including age, race, gender, and history of diabetes mellitus (DM) hypertension (HTN), hyperlipidemia, smoking, or obesity. Similarly, free‐plasma H2S levels in patients with PAD alone (mean 514.4 nmol/L, P=0.007) or CAD alone (mean 443.8 nmol/L, P=0.02) were significantly greater than patients without either vascular disease (mean 368.5 nmol) (Table 3). However, differences in plasma‐free H2S levels between patients with CAD alone versus PAD alone were not significant (P=0.18). Thus, plasma‐free H2S alone was not able to discriminate between different forms of vascular disease.
Table 3.
Plasma‐Free H2S and Total NO Levels in Vascular Disease
| No Vasc Disease, n=53 | Any Vasc Disease, n=140 | CAD Alone, n=66 | PAD Alone, n=13 | |
|---|---|---|---|---|
| Plasma free H2S, nmol/L | 368.53±20.87 | 441.04±15.40 (P =0.010) |
443.89±21.67 (P =0.020) |
514.48±62.05 (P =0.007) |
| Total NO levels, nmol/L | 64.71±1.12 | 64.71±1.07 (P =0.997) |
61.56±1.09 (P =0.743) |
38.86±1.20 (P =0.034) |
All data are reported as mean±standard error of the mean. P value is compared to no vascular disease group. CAD indicates coronary artery disease; H2S, hydrogen sulfide; NO, nitric oxide; PAD, peripheral artery disease.
Free H2S and Smoking Status
An independent sample t test showed that patients who were current smokers had significantly elevated free H2S levels (mean 452.28 nmol/L, P=0.03) as compared to those who were not current smokers (mean 396.10 nmol/L). However, linear regression analysis revealed that when controlled for the presence of vascular disease the difference between smokers and non‐smokers was not significant (P=0.073). A 1‐way analysis of covariance (ANCOVA) between subjects was done to examine the effect of smoking on the relationship between H2S and vascular disease that revealed that patients with vascular disease had significantly higher adjusted H2S levels (mean±SE=438.54±14.73) as compared to the patients without vascular disease (mean±SE=375.15±24.11, F(1,190)=4.97, P=0.027).
Inflammatory Indicators and H2S Levels
Several inflammatory markers including sICAM‐1, IL‐6, and TSP‐1 reported to participate in cardiovascular disease were examined. There was no significant difference noted amongst the various inflammatory markers between the patient cohorts, although increasing trends for IL‐6 was noted in patients with PAD alone (Table 4). Additionally, Pearson correlation analysis did not reveal any significant association between plasma‐free H2S and levels of IL‐6, sICAM, or TSP‐1.
Table 4.
Plasma sICAM, IL6, and TSP‐1 Levels in Vascular Disease
| No Vasc Disease, n=53 | Any Vasc Disease, n=140 | CAD Alone, n=66 | PAD Alone, n=13 | |
|---|---|---|---|---|
| sICAM, ng/mg | 365.04±1.05 | 389.16±1.03 (P =0.324) |
375.40±1.04 (P =0.704) |
378.80±1.16 (P =0.766) |
| IL6, ng/mg | 12.83±1.20 | 17.53±1.12 (P =0.156) |
13.24±1.17 (P =0.900) |
25.89±1.37 (P =0.093) |
| TSP‐1, ng/mg | 40.95±2.25 | 37.09±1.37 (P =0.143) |
37.33±1.95 (P =0.230) |
32.43±4.05 (P =0.093) |
All data are reported as mean±standard error of the mean. P value is compared to no vascular disease group. CAD indicates coronary artery disease; IL‐6, interleukin‐6; PAD, peripheral artery disease; sICAM, soluble intercellular adhesion molecule‐1; TSP‐1, thrombospondin‐1.
NO and Vascular Disease
Plasma NO levels have been reported to be inversely related to the number of cardiovascular risk factors such that the greater the number of risk factors the lower the plasma NO levels.22 Interestingly, we found that patients with no vascular disease had considerably lower plasma NO levels (mean=64.7 nmol/L) compared to previously reported “normal” NO levels of healthy adults (≈150 to 300 nmol/L).22 However, our findings are not surprising as patients without clinically diagnosed vascular disease still had numerous risk factors, as noted in Table 1, that are known to contribute to endothelial cell dysfunction and reduced NO levels.22 Interestingly, linear regression analysis revealed that plasma total NO levels were only significantly lower in patients with PAD alone (mean 38.86 nmol/L, P=0.034) compared to subjects without vascular disease. Together, these data highlight that plasma NO bioavailability was considerably diminished in our study subjects compared to previously reported normal healthy subjects22 and that patients with PAD alone had a significant deficit in total NO bioavailability.
Ratio of H2S to NO and Vascular Disease
We next examined the relationship between plasma‐free H2S and NO bioavailability as these molecules have been found to influence the other in experimental systems10 which might prove informative in discriminating between different forms of vascular disease. Spearman correlation analysis between plasma NO and free H2S in all patients with vascular disease did not reveal a significant correlation. However, calculation of plasma H2S/NO concentration ratios was performed for each cohort and compared using linear regression analysis. Importantly, the plasma H2S/NO ratio was significantly elevated in the PAD alone group (P=0.031) compared to patients with CAD alone versus those without vascular disease (Figure 3). Together, these data reveal a novel finding that patients with PAD have significantly greater amounts of plasma‐free H2S with respect to total NO levels.
Figure 3.
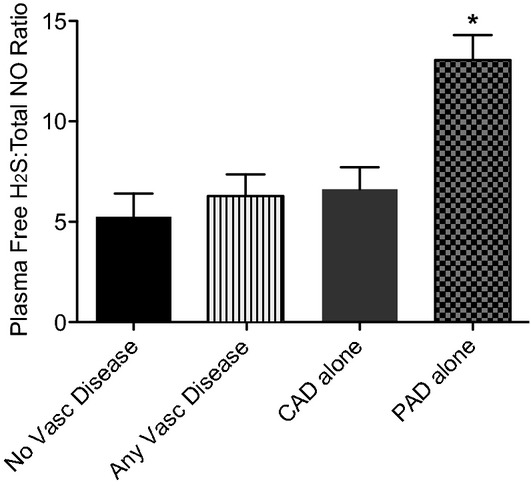
Plasma‐free hydrogen sulfide to total NO ratio by vascular disease. The ratio of plasma‐free hydrogen sulfide to total NO was calculated per vascular disease cohort. Free H2S:NOx ratio was significantly elevated in patients with PAD alone over all other comparison cohorts, *P<0.05. No vascular disease n=53, CAD alone n=66, PAD alone n=13, and any vascular disease n=140. CAD indicates coronary artery disease; H2S, hydrogen sulfide; NO, nitric oxide; PAD, peripheral artery disease.
Discussion
H2S is a colorless, pungent gas that has multiple functions in human physiology including regulation of neurological function, intestinal inflammation, ischemia reperfusion injury, vasomotor tone regulation, and angiogenesis.23–27 A clear understanding of H2S bioavailability and metabolism has been impeded by controversies in its measurement and it is now well established that nonanalytical methods have resulted in anomalous levels.12,28–29 Even accounting for data utilizing problematic methods, there still remains a paucity of information regarding plasma‐free H2S levels in normal human physiology and disease states, much less its relationship to NO bioavailability.14,30
Several studies posit an important role of H2S in atherosclerosis pathogenesis involving both its development and attenuation of consequences of ischemic vascular remodeling and tissue ischemia reperfusion injury.6,31 H2S has been shown to decrease oxidation of low‐density lipoprotein (LDL) as well as uptake of oxidized LDL by macrophages involving antioxidant responses.6–8 Furthermore, H2S impairs the migration of monocytes into the subendothelial layer via reduction of expression of ICAM‐1 and monocyte chemotactic protein‐1 (MCP‐1).6,32 H2S has also been found to inhibit foam cell formation and vascular smooth muscle cell proliferation.6 Lastly, H2S reduces vascular calcification in the rat model via down‐regulation of alkaline phosphatase activity and osteopontin gene down‐regulation.33 Together, these findings suggest that changes in plasma‐free H2S levels could affect several different pathophysiological responses involved in atherosclerotic vessel disease.
Thus, elevation of plasma‐free H2S found in our study could be interpreted in different ways; with an initial explanation being a compensatory response to endothelial dysfunction and dysregulation of NO bioavailability. As mentioned previously, recent studies reveal that H2S can alter eNOS expression and function while also enhancing nitrite anion reduction to NO, thus serving as an alternate pathway for regulating NO bioavailability.9–10 Interestingly, we found that plasma NO levels were significantly reduced in all patients compared to reported normal levels of NO in healthy persons, with PAD‐alone subjects showing the greatest deficit confirming recent findings that plasma NO levels are critically altered during PAD.34 This observation is important when considering the relationship between plasma‐free H2S and NO levels such that patients with PAD had the highest levels of plasma‐free H2S compared to patients with CAD. These findings suggest that vascular disease mechanisms could be different between patients with CAD versus those with PAD. Future studies will address the nature of the H2S/NO relationship differences and whether such interactions may exist in healthy adults with no or few cardiovascular risk factors.
Alternatively, elevated plasma‐free H2S levels in patients with vascular disease may play a pathogenic role by decreasing NO production and bioavailability contributing to vascular dysfunction. Previous studies have shown that H2S donors (Na2S) can inhibit eNOS function and that H2S can interact with NO metabolites to generate novel reactive species.35–37 Clearly, further cause and effect studies are needed to better understand the pathophysiological implications of our findings. Moreover, additional areas of investigation involving measurement of plasma CSE and CBS enzyme expression and activity along with cysteine substrate bioavailability will also be important to determine whether these factors may contribute to different observations between disease cohorts.
Having observed distinct differences in plasma‐free H2S and total NO in patients with vascular disease leads to the obvious question whether the use of such a test may serve as a biomarker for cardiovascular disease. Numerous studies have endeavored to identify useful biomarkers for vascular diseases including PAD. Multiple indicators have been examined from soluble adhesion molecules, inflammatory mediators, cytokines, and other plasma proteins.38–39 However, clinical utility of these markers as an indicator of vascular disease is still not clear and is under active investigation. A recent study by Smadja et al40 suggested that plasma TSP‐1 levels might identify patients with PAD as TSP‐1 levels were increased over control patients. In our study, we did not observe a similar increase in plasma TSP‐1 levels likely due to the fact that our study included Caucasian and African American males and females in contrast to Smadja et al that enrolled only “white men younger than 70 years of age”. With regard to markers of vascular inflammation, we did not find a clear relationship or interaction of plasma‐free H2S or NO levels with IL‐6 or sICAM‐1 levels. Future studies are clearly necessary to more closely evaluate the possibility of utilizing H2S either alone or in combination with other molecules as a biomarker for vascular disease.
We recognize that our study has limitations. First, we employed the definition of noncompressible arteries (ie, an ABI >1.3) that was recommended at the time of study design and approval. However, since that time the ABI cut‐off has been increased to >1.4, though we believe this to have a minimal effect on the major finding of our study. Moreover, in the rapidly evolving field of H2S biology, our laboratory has published a new method that sensitively and accurately measures discrete biologic pools of H2S.17 While we did not evaluate differences in bioavailability of H2S in different biochemical forms, a separate study is currently ongoing to measure these biochemical forms in order to gain additional insight into H2S metabolite bioavailability in different cardiovascular disease states. We do not know if there is a circadian variation in H2S levels, however since all of the procedures were performed during daytime hours, the impact of any circadian variation if any should be small and are likely to be equally distributed amongst the various groups. We also did not assess for cerebrovascular disease involvement, although this will be examined in future trials. Furthermore, inherent to the fact that the majority of patients presented for coronary angiography and the frequent coexistence of disease in multiple vascular beds, our sample of patients with PAD alone is small. Lastly, we acknowledge that the patients studied here may not be representative of age‐matched healthy subjects that will require further study to obtain a better understanding between H2S and NO bioavailability and cardiovascular disease.
In conclusion, our findings provide initial insight into plasma‐free H2S and NO bioavailability during cardiovascular disease states using precise analytical measurement techniques revealing unique pathophysiologic relationships between these molecules. Our findings suggest that closer evaluation of gasotransmitter levels during cardiovascular disease could be informative from a clinical or therapeutic perspective. While our study may be viewed as hypothesis generating, larger, multicenter trials are needed to further investigate the utility of these results and to gain greater insight into the pathophysiological importance of H2S and NO bioavailability during cardiovascular disease.
Sources of Funding
This work was funded in part by a fellowship from the Malcolm Feist Cardiovascular Research Endowment, LSU Health Sciences Center‐Shreveport to Dr Peter and NIH grant HL113303 to Dr Kevil
Disclosures
Drs Peter, Shen, and Kevil have filed provisional intellectual property on the use of gasotransmitter measurements for clinical cardiovascular disease. Dr Kevil has ownership equity of and serves as CSO for Theravasc Inc.
References
- 1.Kevil CG, Kolluru GK, Pattillo CB, Giordano T. Inorganic nitrite therapy: historical perspective and future directions. Free Radical Biol Med. 2011; 51:576-593 [DOI] [PMC free article] [PubMed] [Google Scholar]
- 2.Olson KR. A practical look at the chemistry and biology of hydrogen sulfide. Antioxid Redox Signal. 2012; 17:32-44 [DOI] [PMC free article] [PubMed] [Google Scholar]
- 3.Kabil O, Banerjee R. Redox biochemistry of hydrogen sulfide. J Biol Chem. 2010; 285:21903-21907 [DOI] [PMC free article] [PubMed] [Google Scholar]
- 4.Kabil O, Banerjee R. Enzymology of H2S biogenesis, decay and signaling. Antioxid Redox Signal. 2013. 10.1089/ars.2013.5339 [DOI] [PMC free article] [PubMed] [Google Scholar]
- 5.Mustafa AK, Gadalla MM, Sen N, Kim S, Mu W, Gazi SK, Barrow RK, Yang G, Wang R, Snyder SH. H2S signals through protein S‐sulfhydration. Sci Signal. 2009; 2:ra72. [DOI] [PMC free article] [PubMed] [Google Scholar]
- 6.Wang Y, Zhao X, Jin H, Wei H, Li W, Bu D, Tang X, Ren Y, Tang C, Du J. Role of hydrogen sulfide in the development of atherosclerotic lesions in apolipoprotein E knockout mice. Arterioscler Thromb Vasc Biol. 2009; 29:173-179 [DOI] [PubMed] [Google Scholar]
- 7.Zhao ZZ, Wang Z, Li GH, Wang R, Tan JM, Cao X, Suo R, Jiang ZS. Hydrogen sulfide inhibits macrophage‐derived foam cell formation. Exp Biol Med. 2011; 236:169-176 [DOI] [PubMed] [Google Scholar]
- 8.Laggner H, Muellner MK, Schreier S, Sturm B, Hermann M, Exner M, Gmeiner BM, Kapiotis S. Hydrogen sulphide: a novel physiological inhibitor of LDL atherogenic modification by HOCL. Free Radical Res. 2007; 41:741-747 [DOI] [PubMed] [Google Scholar]
- 9.Bir S, Kolluru G, McCarthy P, Shen X, Pardue S, Pattillo C, Kevil C. Hydrogen sulfide stimulates ischemic vascular remodeling through nitric oxide syntase and nitrite reduction activity regulating hypoxia inducible factor 1α and vascular endothelial growth factor dependent angiogenesis. J Am Heart Assoc. 2012. 10.1161/JAHA.112.004093 [DOI] [PMC free article] [PubMed] [Google Scholar]
- 10.Coletta C, Papapetropoulos A, Erdelyi K, Olah G, Modis K, Panopoulos P, Asimakopoulou A, Gero D, Sharina I, Martin E, Szabo C. Hydrogen sulfide and nitric oxide are mutually dependent in the regulation of angiogenesis and endothelium‐dependent vasorelaxation. Proc Natl Acad Sci USA. 2012; 109:9161-9166 [DOI] [PMC free article] [PubMed] [Google Scholar]
- 11.Hughes MN, Centelles MN, Moore KP. Making and working with hydrogen sulfide: the chemistry and generation of hydrogen sulfide in vitro and its measurement in vivo: a review. Free Radical Biol Med. 2009; 47:1346-1353 [DOI] [PubMed] [Google Scholar]
- 12.Shen X, Pattillo CB, Pardue S, Bir SC, Wang R, Kevil CG. Measurement of plasma hydrogen sulfide in vivo and in vitro. Free Radical Biol Med. 2011; 50:1021-1031 [DOI] [PMC free article] [PubMed] [Google Scholar]
- 13.Van de Louw A, Haouzi P. Oxygen deficit and H2S in hemorrhagic shock in rats. Crit Care. 2012; 16:R178. [DOI] [PMC free article] [PubMed] [Google Scholar]
- 14.Jain SK, Bull R, Rains JL, Bass PF, Levine SN, Reddy S, McVie R, Bocchini JA. Low levels of hydrogen sulfide in the blood of diabetes patients and streptozotocin‐treated rats causes vascular inflammation? Antioxid Redox Signal. 2010; 12:1333-1337 [DOI] [PMC free article] [PubMed] [Google Scholar]
- 15.Wintner EA, Deckwerth TL, Langston W, Bengtsson A, Leviten D, Hill P, Insko MA, Dumpit R, VandenEkart E, Toombs CF, Szabo C. A monobromobimane‐based assay to measure the pharmacokinetic profile of reactive sulphide species in blood. Br J Pharmacol. 2010; 160:941-957 [DOI] [PMC free article] [PubMed] [Google Scholar]
- 16.Shen X, Carlstrom M, Borniquel S, Jadert C, Kevil CG, Lundberg JO. Microbial regulation of host hydrogen sulfide bioavailability and metabolism. Free Radical Biol Med. 2013; 60C:195-200 [DOI] [PMC free article] [PubMed] [Google Scholar]
- 17.Shen X, Peter EA, Bir S, Wang R, Kevil CG. Analytical measurement of discrete hydrogen sulfide pools in biological specimens. Free Radical Biol Med. 2012; 52:2276-2283 [DOI] [PMC free article] [PubMed] [Google Scholar]
- 18.Aboyans V, Criqui MH, Abraham P, Allison MA, Creager MA, Diehm C, Fowkes FG, Hiatt WR, Jonsson B, Lacroix P, Marin B, McDermott MM, Norgren L, Pande RL, Preux PM, Stoffers HE, Treat‐Jacobson DAmerican Heart Association Council on Peripheral Vascular D, Council on E, Prevention, Council on Clinical C, Council on Cardiovascular N, Council on Cardiovascular R, Intervention, Council on Cardiovascular S, Anesthesia Measurement and interpretation of the ankle‐brachial index: a scientific statement from the American Heart Association. Circulation. 2012; 126:2890-2909 [DOI] [PubMed] [Google Scholar]
- 19.Cannon CP, Brindis RG, Chaitman BR, Cohen DJ, Cross JT, Jr, Drozda JP, Jr, Fesmire FM, Fintel DJ, Fonarow GC, Fox KA, Gray DT, Harrington RA, Hicks KA, Hollander JE, Krumholz H, Labarthe DR, Long JB, Mascette AM, Meyer C, Peterson ED, Radford MJ, Roe MT, Richmann JB, Selker HP, Shahian DM, Shaw RE, Sprenger S, Swor R, Underberg JA, Van de Werf F, Weiner BH, Weintraub WSAmerican College of Cardiology Foundation/American Heart Association Task Force on Clinical Data S, American College of Emergency P, Emergency Nurses A, National Association of Emergency Medical T, National Association of EMSP, Preventive Cardiovascular Nurses A, Society for Cardiovascular A, Interventions, Society of Cardiovascular Patient C, Society of Thoracic S 2013 ACCF/AHA key data elements and definitions for measuring the clinical management and outcomes of patients with acute coronary syndromes and coronary artery disease: a report of the American College of Cardiology Foundation/American Heart Association Task Force on Clinical Data Standards (Writing Committee to Develop Acute Coronary Syndromes and Coronary Artery Disease Clinical Data Standards). Circulation. 2013; 127:1052-1089 [DOI] [PubMed] [Google Scholar]
- 20.Unger J, Filippi G, Patsch W. Measurements of free hemoglobin and hemolysis index: EDTA‐ or lithium‐heparinate plasma? Clin Chem. 2007; 53:1717-1718 [DOI] [PubMed] [Google Scholar]
- 21.Venkatesh PK, Pattillo CB, Branch B, Hood J, Thoma S, Illum S, Pardue S, Teng X, Patel RP, Kevil CG. Dipyridamole enhances ischaemia‐induced arteriogenesis through an endocrine nitrite/nitric oxide‐dependent pathway. Cardiovasc Res. 2010; 85:661-670 [DOI] [PMC free article] [PubMed] [Google Scholar]
- 22.Kleinbongard P, Dejam A, Lauer T, Jax T, Kerber S, Gharini P, Balzer J, Zotz RB, Scharf RE, Willers R, Schechter AN, Feelisch M, Kelm M. Plasma nitrite concentrations reflect the degree of endothelial dysfunction in humans. Free Radical Biol Med. 2006; 40:295-302 [DOI] [PubMed] [Google Scholar]
- 23.Calvert JW, Jha S, Gundewar S, Elrod JW, Ramachandran A, Pattillo CB, Kevil CG, Lefer DJ. Hydrogen sulfide mediates cardioprotection through Nrf2 signaling. Circ Res. 2009; 105:365-374 [DOI] [PMC free article] [PubMed] [Google Scholar]
- 24.Liu YH, Lu M, Hu LF, Wong PT, Webb GD, Bian JS. Hydrogen sulfide in the mammalian cardiovascular system. Antioxid Redox Signal. 2012; 17:141-185 [DOI] [PubMed] [Google Scholar]
- 25.Lavu M, Bhushan S, Lefer DJ. Hydrogen sulfide‐mediated cardioprotection: mechanisms and therapeutic potential. Clin Sci. 2011; 120:219-229 [DOI] [PubMed] [Google Scholar]
- 26.Papapetropoulos A, Pyriochou A, Altaany Z, Yang G, Marazioti A, Zhou Z, Jeschke MG, Branski LK, Herndon DN, Wang R, Szabo C. Hydrogen sulfide is an endogenous stimulator of angiogenesis. Proc Natl Acad Sci USA. 2009; 106:21972-21977 [DOI] [PMC free article] [PubMed] [Google Scholar]
- 27.Zhao W, Zhang J, Lu Y, Wang R. The vasorelaxant effect of H(2)S as a novel endogenous gaseous K(ATP) channel opener. EMBO J. 2001; 20:6008-6016 [DOI] [PMC free article] [PubMed] [Google Scholar]
- 28.Olson KR. The therapeutic potential of hydrogen sulfide: separating hype from hope. Am J Physiol Regul Integr Comp Physiol. 2011; 301:R297-R312 [DOI] [PubMed] [Google Scholar]
- 29.Olson KR. Is hydrogen sulfide a circulating “gasotransmitter” in vertebrate blood? Biochim Biophys Acta. 2009; 1787:856-863 [DOI] [PubMed] [Google Scholar]
- 30.Whiteman M, Gooding KM, Whatmore JL, Ball CI, Mawson D, Skinner K, Tooke JE, Shore AC. Adiposity is a major determinant of plasma levels of the novel vasodilator hydrogen sulphide. Diabetologia. 2010; 53:1722-1726 [DOI] [PubMed] [Google Scholar]
- 31.Wang R. Physiological implications of hydrogen sulfide: a whiff exploration that blossomed. Physiol Rev. 2012; 92:791-896 [DOI] [PubMed] [Google Scholar]
- 32.Jin HF, Liang C, Liang JM, Tang CS, Du JB. Effects of hydrogen sulfide on vascular inflammation in pulmonary hypertension induced by high pulmonary blood flow: experiment with rats. Zhonghua Yi Xue Za Zhi. 2008; 88:2235-2239 [PubMed] [Google Scholar]
- 33.Wu SY, Pan CS, Geng B, Zhao J, Yu F, Pang YZ, Tang CS, Qi YF. Hydrogen sulfide ameliorates vascular calcification induced by vitamin D3 plus nicotine in rats. Acta Pharmacol Sin. 2006; 27:299-306 [DOI] [PubMed] [Google Scholar]
- 34.Allen JD, Giordano T, Kevil CG. Nitrite and nitric oxide metabolism in peripheral artery disease. Nitric Oxide. 2012; 26:217-222 [DOI] [PMC free article] [PubMed] [Google Scholar]
- 35.Filipovic MR, Miljkovic J, Nauser T, Royzen M, Klos K, Shubina T, Koppenol WH, Lippard SJ, Ivanovic‐Burmazovic I. Chemical characterization of the smallest S‐nitrosothiol, HSNO; cellular cross‐talk of H2S and S‐nitrosothiols. J Am Chem Soc. 2012; 134:12016-12027 [DOI] [PMC free article] [PubMed] [Google Scholar]
- 36.Geng B, Cui Y, Zhao J, Yu F, Zhu Y, Xu G, Zhang Z, Tang C, Du J. Hydrogen sulfide downregulates the aortic L‐arginine/nitric oxide pathway in rats. Am J Physiol Regul Integr Comp Physiol. 2007; 293:R1608-R1618 [DOI] [PubMed] [Google Scholar]
- 37.Kubo S, Doe I, Kurokawa Y, Nishikawa H, Kawabata A. Direct inhibition of endothelial nitric oxide synthase by hydrogen sulfide: contribution to dual modulation of vascular tension. Toxicology. 2007; 232:138-146 [DOI] [PubMed] [Google Scholar]
- 38.Cooke JP, Wilson AM. Biomarkers of peripheral arterial disease. J Am Coll Cardiol. 2010; 55:2017-2023 [DOI] [PMC free article] [PubMed] [Google Scholar]
- 39.Lau JF, Weinberg MD, Olin JW. Peripheral artery disease. Part 1: clinical evaluation and noninvasive diagnosis. Nat Rev Cardiol. 2011; 8:405-418 [DOI] [PubMed] [Google Scholar]
- 40.Smadja DM, d'Audigier C, Bieche I, Evrard S, Mauge L, Dias JV, Labreuche J, Laurendeau I, Marsac B, Dizier B, Wagner‐Ballon O, Boisson‐Vidal C, Morandi V, Duong‐Van‐Huyen JP, Bruneval P, Dignat‐George F, Emmerich J, Gaussem P. Thrombospondin‐1 is a plasmatic marker of peripheral arterial disease that modulates endothelial progenitor cell angiogenic properties. Arterioscler Thromb Vasc Biol. 2011; 31:551-559 [DOI] [PubMed] [Google Scholar]