

Abstract
Background
Thymic stromal lymphopoietin (TSLP) is a cytokine with multiple effects on the body. For one thing, TSLP induces Th2 immunoreaction and facilitates allergic reaction; for another, it promotes the differentiation of naturally occurring CD4+CD25+Foxp3+ regulatory T cells (nTregs) and maintains immune tolerance. However, the exact role of TSLP in atherosclerosis remains unknown.
Methods and Results
In vitro, we examined the phenotype of TSLP‐conditioned bone marrow dendritic cells (TSLP‐DCs) of apolipoprotein E–deficient (ApoE−/−) mice and their capacity to induce the differentiation of Tregs. Our results indicated that TSLP‐DCs obtained the characteristics of tolerogenic dendritic cells and increased a generation of CD4+ latency‐associated peptide (LAP)+ Tregs and nTregs when cocultured with naive T cells. In addition, the functional relevance of TSLP and TSLP‐DCs in the development of atherosclerosis was also determined. Interestingly, we found that TSLP was almost absent in cardiovascular tissue of ApoE−/− mice, and TSLP administration increased the levels of antioxidized low‐density lipoprotein IgM and IgG1, but decreased the levels of IgG2a in plasma. Furthermore, mice treated with TSLP and TSLP‐DCs developed significantly fewer (32.6% and 28.2%, respectively) atherosclerotic plaques in the aortic root compared with controls, along with increased numbers of CD4+LAP+ Tregs and nTregs in the spleen and decreased inflammation in the aorta, which could be abrogated by anti‐TGF‐β antibody.
Conclusions
Our results revealed a protective role for TSLP in atherosclerosis that is possibly mediated by reestablishing a tolerogenic immune response, which may represent a novel possibility for treatment or prevention of atherosclerosis.
Keywords: atherosclerosis, CD4+LAP+ Tregs, TGF‐β, tolerogenic dendritic cells, TSLP
Introduction
Atherosclerosis is an inflammatory condition of the arterial wall involving the cells of the innate and adaptive immune system. It is now widely recognized that chronic inflammation caused by T‐cell–mediated pathogenic responses plays an important role in atherogenesis.1 Recently, the pathogenic function of Th1 cells in atherosclerosis has been convincingly demonstrated in murine systems.2–3 Additional evidence supports that Th17 cells and interleukin (IL)–17, which are related to autoimmunity diseases, may play an important role in atherogenesis.4 In contrast, other studies have demonstrated an atheroprotective effect for Th2 cells, CD4+CD25+Foxp3+ Tregs, and CD4+ latency‐associated peptide (LAP)+ Tregs.5–7
Dendritic cells that are professional antigen‐presenting cells present different capacities based on different subtypes: mature dendritic cells promote the differentiation of effector T cells, whereas the function of immature or semimature dendritic cells (tolerogenic DCs) is to maintain peripheral T‐cell tolerance.8 Tolerogenic dendritic cells (tDCs) excrete large amounts of IL‐10 and transforming growth factor–β (TGF‐β) and have an impaired ability to produce IL‐12p70.9 It has been demonstrated that conditioning dendritic cells with TGF‐β10 or IL‐1011 promotes tDCs that induce Th2 cell responses or the differentiation of CD4+CD25+ Foxp3+ regulatory T cells (nTregs). Moreover, tDCs are able to prevent acute graft‐versus‐host disease12 and autoimmune diabetes.13 Recently, Hermansson et al found that the injection of tolerogenic antigen‐loaded dendritic cells attenuates atherosclerosis.14 Thus, tDCs may provide a new treatment to prevent atherosclerosis.
As a member of the IL‐7 cytokine family, thymic stromal lymphopoietin (TSLP) is principally expressed by epithelial cells mainly in the lung, skin, and gut.15–16 TSLP signals via a TSLP receptor, which consists of a heterodimer of the IL‐7 receptor α chain and the TSLP receptor chain and is widely distributed on many immune cells, including DCs, T cells, B cells, and mast cells as well as in tissues from the heart. In the thymus, TSLP is selectively produced by epithelial cells of Hassall's corpuscles, and TSLP‐activated dendritic cells (TSLP‐DCs) induced differentiation of CD4+Foxp3− thymocytes into CD4+Foxp3+ Tregs.17 Recently, Taylor et al16 demonstrated that TSLP could maintain mucosa tolerance through inhibiting Th1 and Th17 cells. In addition, Besin et al18 found that TSLP and TSLP‐conditioned DCs could protect NOD mice against diabetes by inducing nTreg and Th2‐cell differentiation in the thymus and, subsequently, in peripheral organs (spleen and lymph nodes). These studies indicated that TSLP could affect the function of DCs and the differentiation of naive T cells directly or indirectly.
Given these findings, we investigated whether murine TSLP and TSLP‐DCs alleviate atherosclerosis via rectifying the imbalance between regulatory T cells and Th1 cells. We found that TSLP treatment induced Tregs (nTregs and CD4+LAP+ Tregs) and Th2 cells. In addition, the treatment prevented atherosclerosis through a TGF‐β–dependent mechanism in apolipoprotein E–deficient (ApoE−/−) mice. Our study is the first to find that TSLP inhibits atherosclerotic plaque formation by inducing a tolerogenic immune response in ApoE−/− mice.
Methods
Reagents and Antibodies
The cell culture medium for DCs and splenocytes was RPMI 1640 (Gibco) supplemented with 10% FCS (Gibco) and 100 U/mL streptomycin/penicillin. Human copper‐oxidized low‐density lipoprotein (oxLDL) was obtained from Yuanyuan Biotechnology of Zhongshan University (Guanzhou, China). In brief, LDL was collected from the plasma of a healthy volunteer,19 and then isolated LDL was oxidized by 10 μmol/L copper sulfate for 24 hours at 37°C.20 GM‐CSF (lot no. 050755‐1), IL‐4 (lot no. 1106CY49), and IL‐2 (lot no. 0608108) were obtained from Peprotech (Rocky Hill, NJ). Recombinant mouse TSLP (lot no. ELR0511061), anti‐TSLP‐biotin antibody (cat no. BAF555), and anti‐LAP‐PE antibody (lot no. AACP0809111) were from R&D Systems. Purified anti‐CD4 antibody (clone RM4‐5) was from BD Systems (Franklin). Anti‐CD11c‐FITC antibody (clone N418), anti‐CD86‐PE antibody (clone PO3.1), anti–programmed death ligand 1 (PD‐L1)‐PE antibody (clone MIH5), anti‐CD4‐FITC antibody (clone GK1.5), anti‐CD3 antibody (clone 17A2), anti‐CD25‐antigen‐presenting cell antibody (clone PC61.5), anti‐Foxp3‐PE antibody (clone FJK‐165), anti‐interferon (IFN)‐γ‐PE antibody (clone XMG1.2), anti‐IL‐4‐PE antibody (clone 11B11), anti‐IL‐17A‐PE antibody (clone eBio17B7), anti‐Foxp3‐biotin antibody (clone FJK‐16s), and anti‐CD11c‐biotin antibody (clone N418) were from eBioscience (San Diego, CA). Anti‐MOMA‐2 antibody (lot no. NG1904267) was from Millipore, anti‐SMA (lot no. BM0002) was from Boster (China). Anti‐TGF‐β antibody (clone 1D11) and control rat IgG were obtained from ThermoFisher Scientific Inc.
Animals
Male C57BL/6 mice and ApoE−/− mice from a C57BL/6 background (Jackson Laboratory) were bred and maintained in the Animal Center of Beijing University. The mice were kept in‐house in a specific pathogen‐free facility (Tongji Medical College) and were fed a normal chow diet or a Western‐type diet containing 0.15% cholesterol and 21% fat. The mice were 6 weeks old at the start of the experiment. Diet and water were administered ad libitum. All experiments were carried out in compliance with the guidelines of the Care and Use of Laboratory Animals (Science and Technology Department of Hubei Province, China).
Generation of Bone Marrow–Derived DCs
Bone marrow–derived DCs were generated with GM‐CSF and IL‐4 as previously described.21 In brief, bone marrow was isolated from ApoE−/− mice. Bone marrow cells were depleted of red blood cells and were cultured with RPMI 1640 for 6 days in tissue culture plates at 37°C and 5.0% CO2; 1640 culture medium was supplemented with 10% FCS, 100 U/mL penicillin, 100 U/mL streptomycin, 10 ng/mL granulocyte‐macrophage colony‐stimulating factor, and 10 ng/mL IL‐4. Purification of DCs from the differentiated bone marrow cells was performed with a CD11c magnetic cell‐sorting kit (Miltenyi Biotec) according to the manufacturer's instructions. After purification, dendritic cells were left unstimulated (immature DCs [iDCs]) or exposed (48 hours) to 100 μg/mL oxLDL (oxLDL‐DCs) or 20 ng/mL TSLP (TSLP‐DCs) in RPMI 1640. After 48 hours, the supernatants were collected for ELISA analysis.
T‐Cell and Bone Marrow–Derived DCs Cocultured in Vitro
CD4+ T cells were purified from splenocytes of ApoE−/− mice through a CD4+ T‐cell‐positive isolation Kit II (Miltenyi Biotec) according to the manufacturer's instructions. CD4+CD25+ Tregs and CD4+CD25− T cells were isolated from total CD4+ T cells by a CD4+CD25+ Regulatory T‐Cell Isolation Kit (Miltenyi Biotec). The purity of each population was >93% by fluorescence‐activated cell sorter analysis. When cultured in RPMI 1640 in 24‐well plates, 8×10⁵ CD4+ or CD4+CD25− T cells were cocultured with 2×10⁵ iDCs, TSLP‐DCs, or oxLDL‐DCs in each well for 7 days in the presence of 2 μg/mL anti‐CD3 antibody and 4 ng/mL IL‐2. The percentages of CD4+CD25+Foxp3+ Tregs and CD4+LAP+ T cells were detected by a fluorescence‐activated cell sorter. The supernatants were collected 48 hours later for cytokine quantification using an ELISA kit (eBioscience).
Proliferation Assays
CD4+ or CD4+CD25+ T cells (2×10⁴ cells/well) were incubated in RPMI 1640 with a combination of 2 μg/mL anti‐CD3 antibody and 4 ng/mL IL‐2 in the absence of bone marrow–derived DCs or in the presence of iDCs, TSLP‐DCs, or oxLDL‐DCs (5×10³ cells/well) in 96‐well plates for 48 hours. The cells were pulsed with 1 μCi [3H]thymidine/well during the last 18 hours, and their radioactivity was assayed.
Animal Groupings
For analysis of TSLP expression, 6‐week‐old male C57BL/6 mice were given normal chow diet or a Western‐type diet for 10 weeks, and ApoE−/− mice were given a Western‐type diet. Six‐week‐old male ApoE−/− mice were injected subcutaneously in the nuchal area with recombinant mouse TSLP (600 ng·250 μL−1·mouse−1·day−1) or PBS for 6 consecutive days. For the dendritic cell transfer experiments, 6‐week‐old male ApoE−/− mice received 1 intravenous injection of iDCs, TSLP‐DCs, oxLDL‐DCs (2×10⁶ cells/mouse), or PBS alone (the no‐DC group). For the neutralization experiment, the mice were subcutaneously given 600 ng of TSLP daily for 6 days and then were injected with 100 μg of neutralizing anti‐TGF‐β antibody or control rat IgG once a week from the age of 7 to 16 weeks. Five days after treatment with TSLP or DCs, a Western‐type diet was administered for 10 weeks. There were 6 to 9 mice in each group.
Real‐Time Polymerase Chain Reaction
Total RNA from dendritic cells, splenocytes, the heart, or the abdominal aorta of each mouse was prepared using Trizol Plus (Takara). cDNA was transcribed from purified RNA using an RNA PCR Kit (Takara). Real‐time polymerase chain reaction (PCR) was performed using One Step SYBR Green Mix (Takara) and ABI Prism 7900 Sequence Detection System (Applied Biosystems) according to the manufacturers' instructions. Melting curves established the purity of the amplified band after 40 cycles of 30 seconds at 94°C, 30 seconds at 57°C, and 30 seconds at 72°C. Amplification reactions were performed in duplicate, and all mRNA expression was calculated using the comparative CT method formula 2−∆∆ct. The data were presented and normalized to GAPDH. All primers used are shown in Table 1.
Table 1.
Real‐Time RT‐PCR Primer Sequences
| Molecule | Sequence (5′‐3′) |
|---|---|
| TGF‐β1 sense | CAGTGGCTGAACCAAGGAGAC |
| TGF‐β1 antisense | ATCCCGTTGATTTCCACGTG |
| IL‐12p40 sense | ATCGTTTTGCTGGTGTCTCC |
| IL‐12p40 antisense | CTTTGTGGCAGGTGTACTGG |
| Foxp3 sense | CACCTATGCCACCCTTATCC |
| Foxp3 antisense | CGAACATGCGAGTAAACCAA |
| IL‐4 sense | ACGAGGTCACAGGAGAAGGGA |
| IL‐4 antisense | AGCCCTACAGACGAGCTCACTC |
| IL‐10 sense | ATGCTGCCTGCTCTTACTGACTG |
| IL‐10 antisense | CCCAAGTAACCCTTAAAGTCCTGC |
| IFN‐γ sense | AGAGCCAGATTATCTCTTTCTACCTCAG |
| IFN‐γ antisense | CCTTTTTCGCCTTGCTGTTG |
| GAPDH sense | TGCAGTGGCAAAGTGGAGATT |
| GAPDH antisense | TTGAATTTGCCGTGAGTGGA |
| TSLP sense | TGCAAGTACTAGTACGGATGGGGC |
| TSLP antisense | GGACTTCTTGTGCCATTTCCTGAG |
All these primers were synthesized by Invitrogen in Shanghai. IFN indicates interferon; IL, interleukin; RT‐PCR, real‐time polymerase chain reaction; TGF‐β, transforming growth factor–β; TSLP, thymic stromal lymphopoietin.
Western Blot
Total protein of heart tissue and thoracic aorta was extracted with a Total Protein Extraction Kit (Pierce/Thermo Scientific). Protein concentration was determined by a BCA Protein Assay Kit (Pierce). Samples containing 50 g of protein were separated on a 10% SDS‐PAGE and electrotransferred onto nitrocellulose membranes. Membranes were sequentially blocked in TBST containing 5% skim milk and then incubated with anti‐TSLP‐biotin antibody (1:1000; R&D Systems) and anti‐β‐actin (1:1000; Abcam) at 4°C overnight. After washing, the membranes were then further incubated with HRP‐conjugated secondary antibody (1:5000, 37°C, 2 hours). The target bands were finally washed and developed with super ECL reagent (Thermo Scientific) and semiquantitatively analyzed using densitometric methods.
Cytokine and Antibody ELISA
The supernatants of the cultured DCs, splenocytes, and mouse plasma were collected for ELISA analysis (eBioscience). Cytokines for ELISA contained IL‐4, IFN‐γ, IL‐12p70, and TGF‐β1. All procedures followed the instructions of the product manual. To quantify oxLDL‐specific antibodies, plates were coated with 100 μg/mL native acetyl‐ or oxLDL, washed, and blocked. And then plasma harvested from mice was added at an optimized 1:50 dilution, and specific detection antibodies for IgG1, IgG2a, and IgM (BD Biosciences) were added. The OD value was read at 630 nm.
Flow Cytometry
Two weeks after the administration of DCs or TSLP, the monocytes from the spleen were isolated with Ficoll‐Paque Plus, and RCLB was used to remove the erythrocytes. For detection of CD4+LAP+ Tregs, the cells were first stained with anti‐LAP and anti‐CD4 as described previously.22 For detection of CD4+CD25+Foxp3+ Tregs, the cells were stained with anti‐CD4‐FITC and anti‐CD25‐PE and then stained with anti‐Foxp3‐antigen‐presenting cells after fixation and permeabilization according to the manufacturer's instructions. For analysis of Th1 (CD4+IFN‐γ+), Th2 (CD4+IL‐4+), and Th17 (CD4+IL‐17+), the monocytes were suspended at a density of 2×10⁶ cells/mL in complete culture medium. The cell suspension in 1 mL of medium was transferred to each well of 24‐well plates. Cultures were stimulated with phorbol myristate acetate (20 ng/mL) plus ionomycin (1 μg/mL) from Alexis Biochemicals for 4 hours in the presence of 2 μmol/mL monensin (Alexis Biochemicals). The incubator was set at 37°C under a 5% CO2 environment. After 4 hours of culture, the monocytes were collected for staining according to the instructions. Fixation and permeabilization were necessary before staining with IFN‐γ, IL‐4, or IL‐17 antibody. Isotype controls were given to enable correct compensation and confirm antibody specificity. For analysis of the characterization for cultured DCs, the purified CD11c cells were stained with CD86‐PE or PD‐L1‐PE for 30 minutes. Flow cytometric acquisition was performed using a FACSCalibur (BD Immunocytometry Systems), and all analyses were performed using Flowjo software (Treestar Inc).
Weight and Lipids
The weight of each mouse was recorded 2, 4, 6, 8, 10 weeks following the start of the Western‐type diet. The plasma was isolated from the blood of mice by centrifugation at 1200g for 10 minutes after clotting at room temperature. Total cholesterol, high‐density lipoprotein cholesterol, and triglyceride plasma levels were measured by enzymatic assay and determined with an autoanalyzer (Hitachi 917).
Atherosclerotic Lesion and Heart Tissue Analysis
Atherosclerosis lesions were quantified in the aortic sinus and descending thoracic aorta, as previously described.23 In brief, the hearts including the aortic roots, which were parallel to the atria, were prepared, and sections were fixed in 4% formaldehyde, processed, and embedded in optimum cutting temperature (OCT) compound. Five‐ to seven‐micrometer sections of the aortic sinus were cut at 35‐μm intervals starting from the 3‐valve cusps. In addition, the descending thoracic aorta were dissected and fixed, opened longitudinally, and pinned onto black wax plates. All the above specimens were stained with Oil Red O and hematoxylin. For plaque area measurement in each mouse, Image‐Pro Plus 6.0 (Media Cybernetics) was used. Furthermore, the fibrous area was stained by Masson trichrome.
For immunohistochemical analysis, 5‐ to 7‐μm serial cryostat sections of aortic sinus adjacent to the Oil Red O–stained sections and the aorta tissue were prepared. The staining was performed with the following molecule‐specific antibodies: purified anti‐monocyte/macrophage (MOMA)‐2 antibody (1:200) for monocyte and macrophages, purified anti–smooth muscle actin antibody (1:200) for smooth muscle cells, purified anti‐CD4 antibody (1:50) for T cells, anti‐TSLP‐biotin antibody (1:100) for TSLP+ cells, anti‐Foxp3‐biotin antibody (1:100) for Tregs, and anti‐CD11c‐biotin antibody (1:100) for DCs. For purified antibodies, staining was visualized using biotinylated secondary antibodies. For biotinylated antibodies, staining was visualized using streptavidinylated secondary antibodies and detected with the ABC/DAB system. Macrophages, smooth muscle cells, TSLP+ cells, and DCs were quantified by assessing the percent positive area of total plague for each marker. CD4+ T cells and Tregs were assessed by counting the number of cells stained positive per meter squared in plaque area.
Statistical Analysis
Results are expressed as the mean±SD unless indicated otherwise. Comparisons between 2 groups were performed by the Student t test when data were normally distributed and group variances were equal. The Mann–Whitney rank sum test was used when data were not normally distributed or if group variances were unequal. One‐way ANOVA was used for multiple comparisons between ≥3 groups followed by the Holm–Sidak test when data were normally distributed and group variances were equal. The Kruskal–Wallis test followed by the Dunn test was used when group data were not normally distributed or if group variances were unequal. The software used for statistical analysis was GraphPad Prism 6.0. The significance level was set at P<0.05.
Results
TSLP Is Almost Absent in Cardiovascular Tissue of ApoE−/− Mice
TSLP is expressed predominantly by epithelial cells in the thymus, lung, skin, and intestine as well as stromal cells.24 However, the expression of TSLP in atherosclerotic tissue has not been previously investigated.
We examined the expression of TSLP in murine by PCR, Western blot, and immunohistochemistry. Immunostaining and quantitative PCR demonstrated significantly lower expression of TSLP in hearts from ApoE−/− mice fed a Western‐type diet versus C57BL/6 control mice or C57BL/6 mice with a Western‐type diet (Figure 1A and 1B). In addition, the results of the Western blot were similar to the immunostaining (Figure 1C). Meanwhile, expression of TSLP was detected in the aorta. Surprisingly, very few TSLP+ cells were detected in the aortic roots of ApoE−/− mice, whereas abundant expression was found in the hearts of C57BL/6 mice irrespective of Western‐type diet (Figure 1D), and TSLP mRNA was also inhibited in the aortas of ApoE−/− mice (Figure 1E). Furthermore, the results of the Western blot were similar to the immunostaining (Figure 1F).
Figure 1.
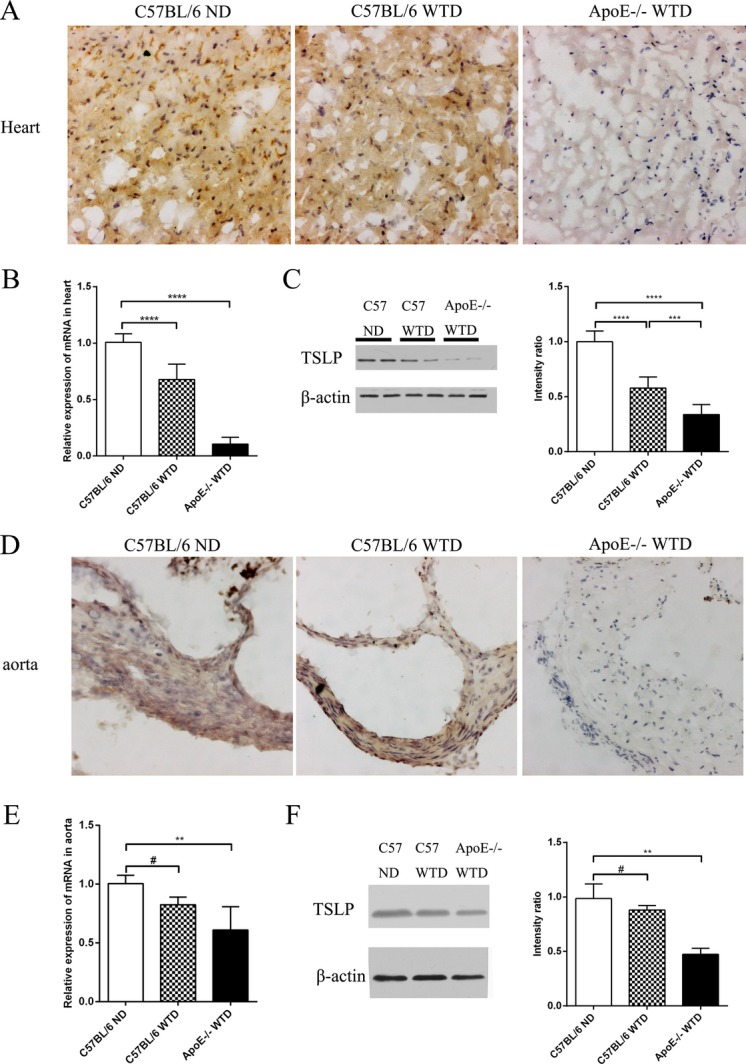
Expression of TSLP on cardiovascular tissue. A and D, Representative images of TSLP staining in the heart and the aorta. B and E, Quantitative PCR analysis of TSLP gene expression in the heart and the aorta (median with 25th and 75th percentiles; Kruskal–Wallis test; #P=0.0915, **P=0.0013). C and F, Representative images and intensity analysis of Western blot for the levels of cardiac (***P=0.0007) and aorta TSLP protein (median with 25th and 75th percentiles; Kruskal–Wallis test; #P=0.9999; **P=0.0022) from each treatment. Data are shown as the average±SD of 3 to 6 independent experiments. Black bar=100 μm. ****P<0.0001. ND indicates normal diet; PCR, polymerase chain reaction; SD, standard deviation; TSLP, thymic stromal lymphopoietin; WTD, Western‐type diet.
Characterization of Cultured DCs
As oxLDL promotes dendritic cells to maturate and differentiate strongly25 and plays an important role in the progression of atherosclerosis, we chose oxLDL as a positive control. The oxLDL‐treated DCs displayed distinct upregulation in mean fluorescence intensity of the costimulatory factor CD86 (192.0±22.3 versus 41.1±6.7, P=0.0002; Figure 2A and 2B), but almost did not affect the expression of the coinhibitory molecule PD‐L1 (Figure 2A and 2B). In contrast, TSLP enhanced the expression of CD86 modestly and improved the mean fluorescence intensity of PD‐L1 markedly on DCs (81.9±11.3 versus 41.1±6.7, P=0.0156, and 320.0±43.0 versus 159.0±24.0, P=0.0030, respectively; Figure 2A and 2B). mRNA expression and secretion of inflammation factor IL‐12 from DCs were significantly increased after uptake of oxLDL, but the levels were mostly unaffected following treatment of TSLP (Figure 2C and 2D). Furthermore, expression of the atheroprotective factor TGF‐β was increased dramatically for TSLP‐DCs (Figure 2C and 2E).
Figure 2.
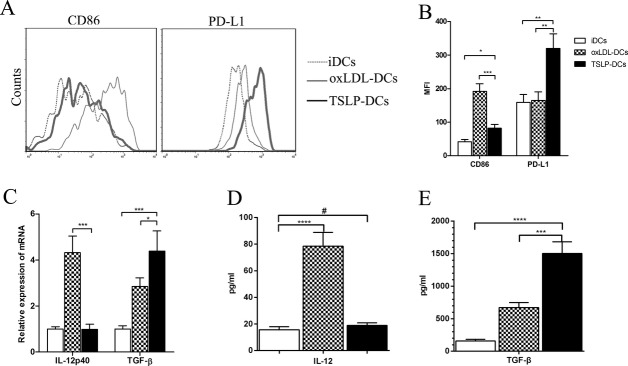
Characterization of TSLP‐DCs. A, After being cultured for 2 days under different conditions, BM‐DCs (2×10⁵ cells/well) were stained with specific antibodies against CD86 and PD‐L1 and analyzed by FACS. B, Mean fluorescence intensities (MFIs) for CD86 (*P=0.0156, ***P=0.0002) and PD‐L1 (**P=0.0030 for both) were quantified. C, Quantitative PCR analysis of IL‐12 (***P=0.0003) and TGF‐β (*P=0.0135; ***P=0.0008) for the DCs in different groups. D, Quantification of IL‐12 by ELISA in the supernatants of each group (#P=0.5435). E, Quantification of TGF‐β by ELISA (***P=0.0002). Data are shown as the average±SD of 3 to 5 independent experiments. ****P<0.0001. BM indicates bone marrow; DCs, dendritic cells; ELISA, enzyme‐linked immuno sorbent assay; FACS, fluorescence‐activated cell sorting; IL, interleukin; oxLDL, oxidized low‐density lipoprotein; PCR, polymerase chain reaction; PD‐L1, programmed death ligand 1; SD, standard deviation; TGF‐β, transforming growth factor‐β; TSLP, thymic stromal lymphopoietin.
TSLP‐DCs Differentiate CD4+ T Cells Into Protective CD4+CD25+Foxp3+ Tregs, CD4+LAP+ Tregs, and Noninflammatory Th2 Cells
To assess the functional activity of TSLP‐DCs, we cocultured TSLP‐DCs with splenic CD4+ T cells. When compared with iDCs, CD4+ T cells activated in the presence of TSLP‐DCs contained nearly double the number of CD4+CD25+Foxp3+ Treg cells (7.6±0.5% versus 3.3±0.4%, P<0.0001; Figure 3B) and almost 7‐fold more CD4+LAP+ Tregs (3.67±0.56% versus 0.52±0.20%, P<0.0001; Figure 3C). In addition, CD4+ T cells cocultured with TSLP‐DCs produced a 4‐fold greater amount of IL‐4 and low amounts of IFN‐γ (Figure 3D). In addition, only moderate proliferation of CD4+ T cells was induced by anti‐CD3 and IL‐2, whereas a combination of anti‐CD3 and IL‐2 with iDCs, TSLP‐DCs, or oxLDL‐DCs induced 3.3‐, 3.5‐, and 3.7‐fold increases in CD4+ T‐cell proliferation, respectively (Figure 3E).
Figure 3.
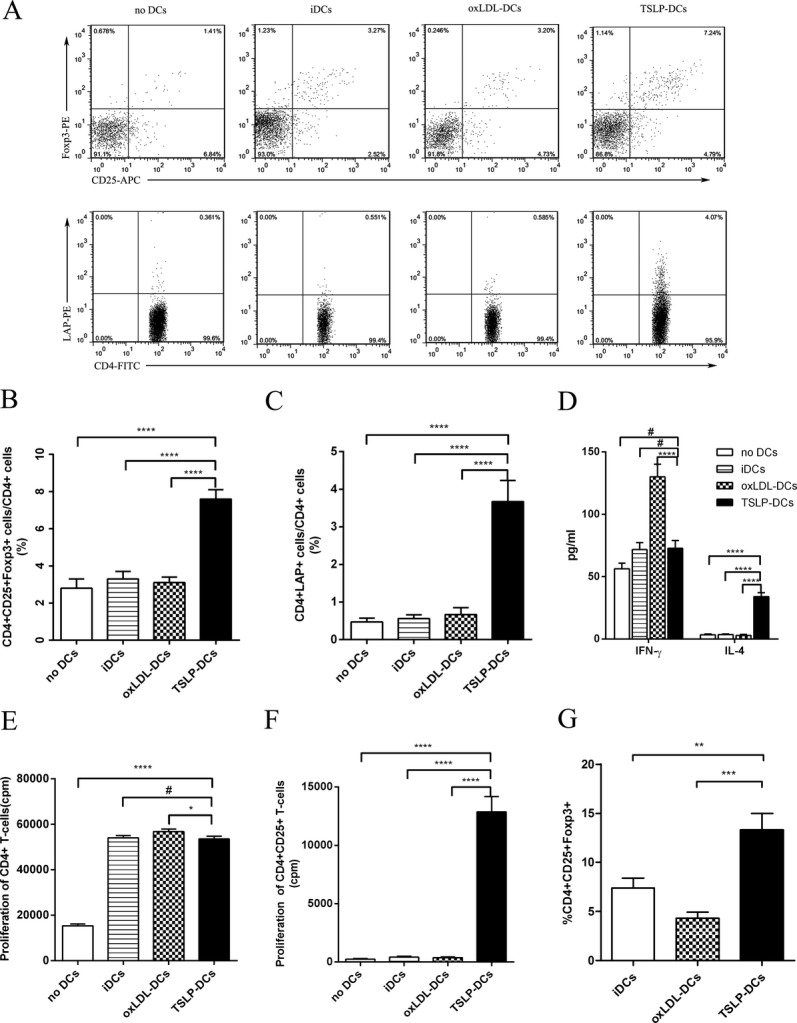
Coculture of BM‐DCs and T cells. A, Representative FACS analysis of the percentages of nTregs and CD4+LAP+ Tregs in CD4+ splenic T cells after 7 days of culturing. B and C, Graphs represent the average percentages of nTregs and CD4+LAP+ Tregs in CD4+ splenic T cells. D, Quantification of IFN‐γ (#P=0.0578 vs no DCs; #P=0.8652 vs iDCs) and IL‐4 released by CD4+ T cells. E and F, Proliferative response of purified CD4+ (#P=0.5676, *P=0.0163) or CD4+CD25+ T cells exposed to different stimulus. G, Conversion of naive CD4+CD25− T cells into CD4+CD25+Foxp3+ T cells under different conditions (**P=0.0019; ***P=0.0003). Data are shown as the average±SD of 3 to 5 independent experiments. ****P<0.0001. APC indicates allophycocyanin; BM, bone marrow; DCs, dendritic cells; iDCs, immature DCs; FITC, fluorecein isothiocyanate; IFN, interferon; IL, interleukin; LAP, latency‐associated peptide; oxLDL, oxidized low‐density lipoprotein; PE, phycoerythrin; SD, standard deviation; TSLP, thymic stromal lymphopoietin.
We next tested whether the increased number of Tregs in splenic CD4+ T cells cocultured with TSLP‐DCs resulted from an expansion of Tregs or differentiation of the Tregs. Purified CD4+CD25+ T cells were cultured without DCs or with iDCs, TSLP‐DCs, or oxLDL‐DCs. The results indicated that iDCs or oxLDL‐DCs weakly induced proliferation, whereas TSLP‐DCs promoted strong proliferation (Figure 3F), as previously reported.17–18 We found that CD4+CD25− T cells could not differentiate into CD4+CD25+Foxp3+ T cells without DCs after 7 days of culturing. Furthermore, compared with that in the iDC‐treated group, the percentage of CD4+CD25+Foxp3+ T cells from CD4+CD25− T cells significantly increased in the presence of TSLP‐DCs (Figure 3G).
TSLP Treatment Inhibits Atherosclerosis in ApoE−/− Mice
To investigate the capacity of TSLP to protect against atherosclerosis, we evaluated the severity of atherosclerosis by comparing morphological and histological changes between TSLP‐treated and PBS‐treated mice. The mice treated with TSLP developed a substantially smaller atherosclerotic lesion size in the aortic sinus compared with PBS‐treated control mice (3.20±0.48×105 μm2 versus 4.75±0.85×105 μm2, P=0.0004; Figure 4A and 4B). Simultaneously, the atherosclerotic lesions of TSLP‐treated mice showed a marked 25% reduction in the accumulation macrophages (28.25±9.72% versus 53.13±12.29%, P=0.0005; Figure 4A and 4C) and also a 3‐fold increase in Foxp3+ Treg cell infiltration (Figure 4A and 4D). Furthermore, we performed α‐smooth muscle actin, Masson, CD4, and CD11c staining of the plaques and found no statistically significant difference in staining between TSLP‐treated mice and PBS‐treated mice (Figures 4A, 4E, 4F, and 5). In addition, we also observed a lower plaque burden in thoracic aorta when giving TSLP treatment (Figure 5). TSLP also affected body weight growth (5.3±0.8 versus 7.3±1.3 g, P=0.0053; Table 2), but did not affect total plasma cholesterol, high‐density lipoprotein cholesterol, and triglycerides (Tables 3, 4, and 5).
Figure 4.

TSLP inhibits the development of atherosclerosis (Ι). A, Representative sections of aortic sinus stained with the Oil Red O and antibodies specific for MOMA‐2 for macrophages, Foxp3 for Tregs, α‐smooth muscle actin staining, and collagen staining in ApoE−/− mice in different groups (PBS and TSLP) at 16 weeks. Black bar=200 or 100 μm (Foxp3); black arrows indicate examples of Foxp3‐positive cells. B through F, Quantitative analysis of lesion size (***P=0.0004), MOMA‐2 (***P=0.0005), Foxp3 (**P=0.0066), α‐SMA (#P=0.4424), and collagen (#P=0.5900) staining in different groups (PBS and TSLP). Values are presented as mean±SD, n=7 to 9. MOMA indicates monocyte/macrophage; SD, standard deviation; SMA, smooth muscle actin; TSLP, thymic stromal lymphopoietin.
Figure 5.

TSLP inhibits the development of atherosclerosis (Π). A, Representative photographs of Oil Red O staining in the surface lesion area of the thoracic aorta. B, Representative sections of aortic sinus stained with antibodies specific for CD4 for T cells and CD11c for dendritic cells in ApoE−/− mice in different groups (PBS and TSLP) at 16 weeks. Black bar=100 μm; black arrows indicate examples of CD4‐positive cells. C through E, Quantitative analysis of the percent lesion area of total vessel area (*P=0.0104), number of CD4‐positive cells (#P=0.0878), and percent of CD11c staining area (#P=0.6022). Values are presented as the mean±SD, n=6. SD indicates standard deviation; TSLP, thymic stromal lymphopoietin.
Table 2.
Body Weight in All Groups
| Body Weight, g | ||||||
|---|---|---|---|---|---|---|
| PBS | TSLP | No DCs | iDCs | oxLDL‐DCs | TSLP‐DCs | |
| 6 Weeks | 20.7±1.0 | 20.9±1.2 | 21.7±1.1 | 21.0±1.2 | 21.3±1.3 | 21.2±1.1 |
| 16 Weeks | 28±1.4 | 26.2±1.1 | 29.1±1.5 | 28.5±1.3 | 27.4±1.4 | 26.4±1.5 |
| Growth | 7.3±1.3 | 5.3±0.8** | 7.4±0.8 | 7.5±0.9# | 6.1±1.4# | 5.2±1.11* |
Values are presented as the mean±SD, n=6. DCs indicates dendritic cells; iDCs, immature DCs; oxLDL, oxidized low‐density lipoprotein; TSLP, thymic stromal lymphopoietin.
**P=0.0053 vs PBS *P=0.0104 vs no DCs; #P=0.1421 for oxLDL‐DCs vs no DCs; #P=0.8740 for iDCs vs no DCs.
Table 3.
Total Cholesterol Levels in All Groups
| Cholesterol, mg/dL | ||||||
|---|---|---|---|---|---|---|
| PBS | TSLP | No DCs | iDCs | oxLDL‐DCs | TSLP‐DCs | |
| 6 Weeks | 202.1±22.8 | 192.2±27.3 | 187.4±27.0 | 190.2±25.4 | 199.1±24.0 | 194.9±26.5 |
| 9 Weeks | 354.5±65.2 | 345.6±55.6 | 325.4±58.8 | 363.3±63.0 | 359.4±56.2 | 330.9±68.1 |
| 13 Weeks | 598.3±104.2 | 543.9±93.3 | 545.6±83.6 | 576.4±92.5 | 607.3±92.6 | 561.1±90.0 |
| 16 Weeks | 645.6±145.6 | 732.2±113.3# | 691.7±113.0 | 709.3±134.8 | 715.3±117.7# | 723.0±127.4# |
Values are presented as the mean±SD, n=6. DCs indicates dendritic cells; iDCs, immature DCs; oxLDL, oxidized low‐density lipoprotein; TSLP, thymic stromal lymphopoietin.
#P= 0.2772 for TSLP vs PBS; #P=0.9989 for oxLDL‐DCs vs no DCs; #P=0.9986 for TSLP‐DCs vs no DCs.
Table 4.
HDL Cholesterol Levels in All Groups
| HDL Cholesterol, mg/dL | ||||||
|---|---|---|---|---|---|---|
| PBS | TSLP | No DCs | iDCs | oxLDL‐DCs | TSLP‐DCs | |
| 6 Weeks | 10.1±1.7 | 9.8±1.8 | 9.1±2.0 | 9.8±1.4 | 10.9±2.3 | 10.7±1.9 |
| 16 Weeks | 46.4±8.4 | 49.8±8.6# | 49.8±7.1 | 48.7±9.2 | 51.1±8.1# | 52.5±10.0# |
Values are presented as the mean±SD, n=6. DCs indicates dendritic cells; HDL, high‐density lipoprotein; iDCs, immature DCs; oxLDL, oxidized low‐density lipoprotein; TSLP, thymic stromal lymphopoietin.
#P=0.5021 for TSLP vs PBS #P=0.9904 for oxLDL‐DCs vs no DCs; #P=0.9892 for TSLP‐DCs vs no DCs.
Table 5.
Triglycerides Levels in All Groups
| Triglycerides, mg/dL | ||||||
|---|---|---|---|---|---|---|
| PBS | TSLP | No DCs | iDCs | oxLDL‐DCs | TSLP‐DCs | |
| 6 week | 57.8±16.3 | 59.6±14.9 | 63.5±17.3 | 57.6±14.9 | 61.8±14.4 | 59.3±17.4 |
| 16 week | 828.8±188.4 | 662.7±143.8# | 801.8±219.8 | 814.5±150.8 | 802.4±175.1# | 737.5±163.0# |
Values are presented as the mean±SD, n=6. DCs indicates dendritic cells; iDCs, immature DCs; oxLDL, oxidized low‐density lipoprotein; TSLP, thymic stromal lymphopoietin.
#P=0.1168 for TSLP vs PBS; #P=0.9991 for oxLDL‐DCs vs no DCs; #P=0.9789 for TSLP‐DCs vs no DCs.
TSLP‐DCs Prevent Atherosclerosis in ApoE−/− Mice
To evaluate whether the observed TSLP atheroprotection was associated with the tolerogenic function of dendritic cells, we treated mice intravenously without DCs or with different types of DCs, including TSLP‐DCs, oxLDL‐DCs, and iDCs. There was a 28.2% reduction in atherosclerotic lesion size for mice administered TSLP‐DCs compared with mice given no DC treatment (3.23±0.80×105 μm2 versus 4.67±0.62×105 μm2, P=0.0047; Figure 6A and 6B). In contrast, treatment with oxLDL‐DCs increased the severity of atherosclerotic lesion (5.9±1.0×105 μm2 versus 4.67±0.62×105 μm2, P=0.0074; Figure 6A and 6B). Simultaneously, there was a decreased percentage of MOMA‐2+ macrophages and an obvious increase in Treg infiltration in the atherosclerotic lesions of mice that received TSLP‐DCs compared with those that received no DC treatment (30.38±14.22% versus 54.63±16.46%, P=0.0391; and 65 [25th and 75th percentiles, 45 and 78] versus 12 [25th and 75th percentiles, 6 and 18], P=0.0158, respectively; Figure 6A, 6C, and 6D) and an increased percentage of MOMA‐2+ macrophages observed in oxLDL‐DC‐treated mice though not significantly (62.01±16.29% versus 54.63±16.46%, P=0.6304; Figure 6A and 6C). There were no significant α‐smooth muscle actin, collagen, and CD11c changes in each group (Figures 6A, 6E, 6F, and 7). Similar to TSLP treatment, administration of TSLP‐DCs also led to a slight but not significant decrease in CD4+ T cells (Figure 7). In thoracic aorta, TSLP‐DCs also led to a lower plaque burden compared with controls (Figure 7). Interestingly, TSLP‐DC treatments slightly decreased body weight growth (5.2±1.1 versus 7.4±0.8 g; Table 2) and did not affect total plasma cholesterol, high‐density lipoprotein cholesterol, and triglycerides (Tables 3, 4, and 5) in ApoE−/− mice.
Figure 6.

TSLP‐DCs attenuate the development of atherosclerosis (Ι). A, Representative sections of aortic sinus stained with Oil Red O and antibodies specific for MOMA‐2 for macrophages, Foxp3 for Tregs, α‐smooth muscle actin staining, and collagen staining in ApoE−/− mice in different groups (no DCs, iDCs, oxLDL‐DCs, and TSLP‐DCs) at 16 weeks. Black bar=200 or 100 μm (Foxp3); black arrows indicate examples Foxp3‐positive cells. B through F, Quantitative analysis of lesion size (**P=0.0074 vs oxLDL‐DCs; **P=0.0047 vs TSLP‐DCs), MOMA‐2 (#P=0.6304; *P=0.0391), Foxp3 (median with 25th and 75th percentiles; Kruskal–Wallis test; *P=0.0158), α‐SMA (#P=0.9994 vs TSLP‐DCs; #P=0.9647 vs oxLDL‐DCs), and collagen (#P=0.9878 vs TSLP‐DCs; #P=0.9878 vs oxLDL‐DCs) staining in different groups. Values are presented as the mean±SD, n=7 to 9. DCs indicates dendritic cells; iDCs, immature DCs; MOMA, monocyte/macrophage; oxLDL, oxidized low‐density lipoprotein; SD, standard deviation; SMA, smooth muscle actin; TSLP, thymic stromal lymphopoietin.
Figure 7.
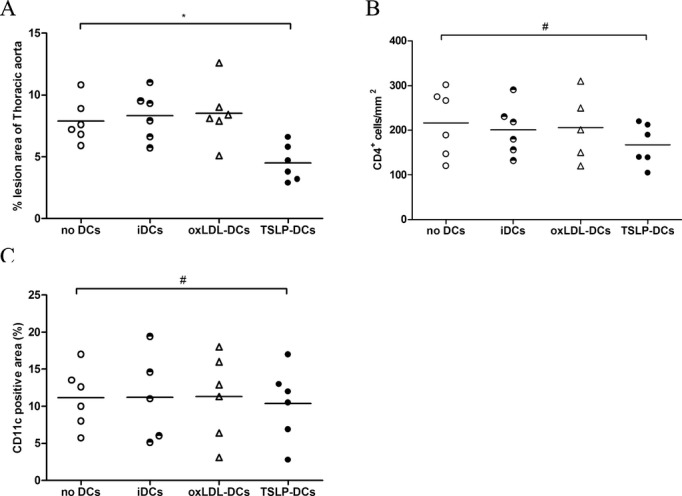
TSLP‐DCs attenuate the development of atherosclerosis (Π). A through C, Quantitative analysis of the percent lesion area of total vessel area (*P=0.0270), number of CD4‐positive cells (#P=0.7448), and percent of CD11c staining area (#P=0.9998) in different groups (no DCs, iDCs, oxLDL‐DCs, and TSLP‐DCs) at 16 weeks. Values are presented as the mean±SD, n=5 to 6. DCs indicates dendritic cells; iDCs, immature DCs; oxLDL, oxidized low‐density lipoprotein; SD, standard deviation; TSLP, thymic stromal lymphopoietin.
TSLP and TSLP‐DCs Induce Th2, CD4+LAP+ Tregs, and CD4+CD25+Foxp3+ Treg Cells, but Suppress Th1 Cells In Vivo
We next investigated whether TSLP atheroprotection was dependent on the induction of Tregs by tolerogenic dendritic cells in vivo. As TSLP‐DC induction of the differentiation of nTregs in the thymus has been proven in humans17 and mice18 and central immunity ultimately affects the development of autoimmunity diseases through peripheral immunity, we examined CD4+ T‐cell subtypes in the spleen 2 weeks after the end of treatment administration. We found that TSLP treatment significantly increased the percentage of Th2 (1.87±0.40% versus 0.69±0.22%, P<0.0001), CD4+LAP+ Tregs (3.92 [25th and 75th percentiles, 2.40 and 5.13] versus 1.22% [25th and 75th percentiles, 0.41% and 1.48%], P=0.0022), and CD4+CD25+Foxp3+ Tregs (11.23±3.01% versus 6.32±1.40%, P=0.0046) in CD4+ T cells of ApoE−/− mice compared with controls (Figure 8B and 8C), but markedly inhibited the percentage of Th1 cells (13.3±1.9% versus 26.8±3.4%, P<0.0001). Furthermore, TSLP did not affect Th17 significantly (Figure 8C). Surprisingly, similar results were discovered in the spleens of mice administered TSLP‐DC treatment (Figure 9). In contrast, oxLDL‐DC injection promoted proinflammatory Th1 cells (29.0±2.6% versus 23.8±2.4%, P=0.0058; Figure 9B) and did not affect the development of CD4+LAP+ Tregs (0.96±0.29% versus 1.04±0.52%, P=0.9760; Figure 9C), and CD4+CD25+Foxp3+ Tregs (7.02 [25th and 75th percentiles, 5.41 and 7.15] versus 6.16% [25th and 75th percentiles, 5.28% and 7.75%], P=0.9580; Figure 9C).
Figure 8.

Effects of TSLP administration on nTregs, CD4+LAP+ Tregs, and Th1, Th2, and Th17 cells in spleens in ApoE−/− mice on days 14. A, CD4+ T‐cell subsets were gated (a). Representative pictures of nTregs (b), CD4+LAP+ Tregs (c), Th1 (d), Th2 (e), and Th17 (f) are shown. Numbers in upper right quadrants indicate percentages of these cells. B, Results of statistical analysis of average percentages of nTregs (**P=0.0046) and Th1 cells in different groups (PBS and TSLP). C, Results of statistical analysis of average percentages of CD4+LAP+ Tregs (median with 25th and 75th percentiles; Mann–Whitney rank sum test; **P=0.0022), and Th2 and Th17 cells (#P=0.5786) in different groups (PBS and TSLP). Six mice were analyzed for each group. Values are presented as the mean±SD. ****P<0.0001. APC indicates allophycocyanin; IFN, interferon; IL, interleukin; LAP, latency‐associated peptide; SD, standard deviation; SSC, side scatter; TSLP, thymic stromal lymphopoietin.
Figure 9.

Effects of TSLP‐DC administration on nTregs, CD4+LAP+ Tregs, and Th1, Th2, and Th17 cells in spleens in ApoE−/− mice on day 14. A, CD4+ T‐cell subsets were gated (a). Representative pictures of nTregs (b), CD4+LAP+ Tregs (c), Th1 (d), Th2 (e), and Th17 (f) are shown. Numbers in upper right quadrants indicate percentages of these cells. B, Results of statistical analysis of average percentages of nTregs (median with 25th and 75th percentiles; Kruskal–Wallis test; *P=0.0374 vs no DCs; #P=0.2596 vs iDCs; *P=0.0162 vs oxLDL‐DCs) and Th1 cells (**P=0.0058; ***P=0.0007) in different groups. C, Results of statistical analysis of average percentages of CD4+LAP+ Tregs (**P=0.0010 vs no DCs; **P=0.0012 vs iDCs; ***P=0.0008), Th2 (median with 25th and 75th percentiles; Kruskal–Wallis test; #P=0.9999; *P=0.0226; **P=0.0066), and Th17 cells (#P=0.9726) in different groups. Six mice were analyzed for each group. Values are presented as the mean±SD. ****P<0.0001. APC indicates allophycocyanin; DCs, dendritic cells; iDCs, immature DCs; IFN, interferon; IL, interleukin; LAP, latency‐associated peptide; oxLDL, oxidized low‐density lipoprotein; SD, standard deviation; TSLP, thymic stromal lymphopoietin.
The Atheroprotective Effect of TSLP Is Associated With Downregulation of Systemic Inflammation
We tested changes in inflammatory cytokines in the spleen, plasma, and descending aorta. In plasma, the levels of TGF‐β1 and IL‐4 were increased and detectable in mice that received TSLP (Figure 10A and 10B) or TSLP‐DCs (Figure 10C and 10D), whereas levels of IFN‐γ and IL‐12 were very low and nearly undetectable. In contrast, oxLDL‐DC injection increased IFN‐γ and IL‐12 levels, and they were detectable (Figure 10C). We found that mRNA expression of TGF‐β1 was slightly upregulated in the spleens and descending aortas of mice that received oxLDL‐DCs compared with controls. mRNA levels were significantly upregulated in mice that received TSLP injection (Figure 10E and 10F) and TSLP‐DC treatment (Figure 10G and 10H). Surprisingly, the expression of another anti‐inflammatory factor, IL‐10, was similar to that of TGF‐β1. Furthermore, oxLDL‐DC administration increased the expression of IFN‐γ in the spleen and aorta, but TSLP and TSLP‐DC treatments inhibited this effect (Figure 10E through 10H). The expression of Foxp3 in aorta was very low in mice from other groups except for the mice administered TSLP (Figure 10E). The injection of oxLDL‐DCs also promoted IL‐12 expression in the spleen and aorta, but TSLP‐DCs did not (Figure 10G and 10H).
Figure 10.

Expression of mRNA and levels of cytokines and antibodies in vivo. A and B, Levels of plasma IFN‐γ (***P=0.0002), IL‐4 (median with 25th and 75th percentiles; Mann–Whitney rank sum test; **P=0.0022), IL‐12 (#P=0.3061), and TGF‐β (median with 25th and 75th percentiles; Mann–Whitney rank sum test; **P=0.0022) in PBS and TSLP groups. C and D, Levels of plasma IFN‐γ (*P=0.0231; **P=0.0035), IL‐4 (median with 25th and 75th percentiles; Kruskal–Wallis test; #P=0.0506), IL‐12 (#P=0.6422; *P=0.0217), and TGF‐β (median with 25th and 75th percentiles; Kruskal–Wallis test,;**P=0.0049) in the groups no DCs, iDC, oxLDL‐DCs, and TSLP‐DCs. E, Expression of IFN‐γ, Foxp3, TGF‐β, IL‐4 (median with 25th and 75th percentiles; Mann–Whitney rank sum test; **P=0.0022), IL‐10 (***P=0.0001), and IL‐12 (#P=0.0513) mRNA in aorta in PBS and TSLP groups. F, Expression of IFN‐γ, Foxp3, TGF‐β (***P=0.0002), IL‐4, IL‐10 (**P=0.0061), and IL‐12 (#P=0.1682) mRNA in spleen in different groups. G, Graphs represent expression of IFN‐γ (**P=0.0012), Foxp3 (median with 25th and 75th percentiles; Kruskal–Wallis test; *P=0.0301), TGF‐β (median with 25th and 75th percentiles; Kruskal–Wallis test; *P=0.0235), IL‐4 (***P=0.0004), IL‐10 (**P=0.0047), and IL‐12 (#P=0.5352; ***P=0.0005) mRNA in spleens of different groups. H, Graphs represent expression of IFN‐γ (*P=0.0171), Foxp3, TGF‐β (**P=0.0045), IL‐4, IL‐10 (***P=0.0003), and IL‐12 (#P=0.0554) mRNA and in aorta. I, Levels of plasma IgM (median with 25th and 75th percentiles; Mann–Whitney rank sum test; *P=0.0286), IgG1, and IgG2a (*P=0.0282). Six mice were analyzed for each group. Values are presented as the mean±SD. ****P<0.0001. DCs indicates dendritic cells; iDCs, immature DCs; IFN, interferon; IL, interleukin; LAP, latency‐associated peptide; OD, optical density; oxLDL, oxidized low‐density lipoprotein; SD, standard deviation; TGF‐β, transforming growth factor‐β; TSLP, thymic stromal lymphopoietin.
OxLDL‐Specific Antibodies Are Induced in the Plasma of ApoE−/− Mice by TSLP Treatment
Atherosclerosis is related to antibody formation of oxidatively modified LDL, and the levels of this antibody can predict the progression of atherosclerosis in humans.26 All the above assayed effects involved TSLP modulating cellular immunity, but we also investigated whether there was a humoral immunity response to TSLP treatment by quantifying plasma antibody titers. Th1 cells induced IgG2a production, whereas Th2 cells facilitated IgG1 and IgE synthesis. Here we assessed the levels of oxLDL‐specific antibodies. Our results indicated that more IgM and IgG1 but less IgG2a were produced in TSLP‐treated mice compared with the controls 2 weeks after TSLP administration (Figure 10I).
Neutralization of TGF‐β In Vivo Abrogates the Effect of TSLP on Atherosclerosis
Our PCR and ELISA data for cytokine production in vivo and in vitro indicated that TGF‐β is increased markedly by TSLP treatment. In addition, previous studies indicated that TGF‐β plays a crucial role in the suppressive function of nTregs27 and CD4+LAP+ Tregs.28 To determine whether TGF‐β is directly involved in inhibiting plaque formation after TSLP treatment, we performed a TGF‐β neutralization study. TSLP‐treated mice that received anti‐TGF‐β neutralizing antibody presented significantly increased atherosclerotic lesion formation and macrophages and CD4+ T‐cell accumulations in the plaques, compared with TSLP‐treated mice receiving isotype‐matched antibodies (Figure 11).
Figure 11.
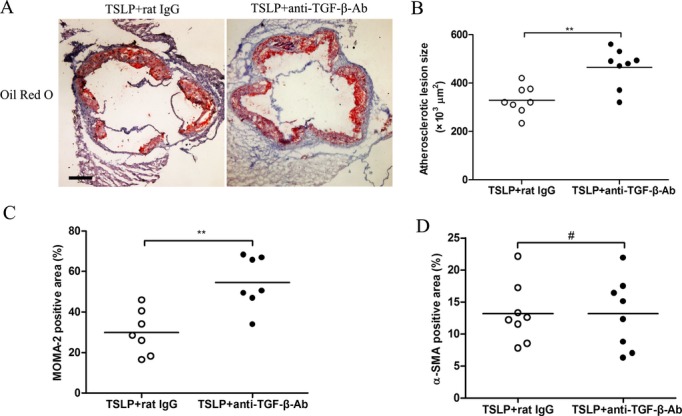
Neutralization of TGF‐β in vivo abrogates the effect of TSLP on atherosclerosis. A, Representative sections of aortic sinus stained with Oil Red O and antibodies specific for MOMA‐2 for macrophages and α‐smooth muscle actin staining in ApoE−/− mice at 16 weeks. Black bar=200 μm. B through D, Quantitative analysis of lesion size (**P=0.0018), MOMA‐2 (**P=0.0023), and α‐SMA staining (#P=0.9962). Values are presented as the mean±SD, n=7 to 9. MOMA indicates monocyte/macrophage; SD, standard deviation; SMA, smooth muscle actin; TGF‐β, transforming growth factor–β; TSLP, thymic stromal lymphopoietin.
Discussion
Recently, CD4+LAP+ Tregs were identified as a new subset of Tregs that suppress atherosclerosis7,29 and colitis28 in mice through the production of TGF‐β. In addition, previous data suggested that TGF‐β plays a crucial role in the suppressive function of nTregs27 and CD4+LAP+ Tregs.28 Furthermore, TSLP can induce differentiation of Tregs30 directly via TSLP receptors on CD4+ T cells and generate Tregs indirectly via tolerogenic DCs, which produce large amounts of TGF‐β.18 These findings suggest that TSLP receptors exist not only on DCs but also on CD4+ T cells. In combination with our results, we will discuss the functional relevance of TSLP, DCs, nTregs/CD4+LAP+ Tregs, and TGF‐β in atherosclerotic mice. In addition to the effects on cellular immunity, we found that humoral immunity is also affected by TSLP.
First, we investigated the expression of TSLP in atherosclerotic mice with ApoE knockout and hypercholesterolemic features. We found that TSLP was nearly absent in ApoE−/− mice but was expressed normally in C57BL/6 mice. This led to doubt about whether the disorder of lipid metabolism contributes to the inhibition of TSLP in atherosclerotic mice compared with C57BL/6 mice. Similarly, Turcot et al31 discovered lower TSLP expression in visceral adipose tissue from obese men compared with those without metabolic syndrome. Many studies have also implicated type 2 cytokines such as IL‐33 as having beneficial effects on obesity and metabolism through inducing the accumulation of Th2 cells and alternatively activated macrophages (M2) in adipose tissue.32 Although these findings are associated with ours, including a slight but not significant triglyceride decrease and obvious weight restriction by TSLP administration, further studies will be needed to validate the function of TSLP in the inflammation in obesity.
In humans and mice, stimuli such as oxLDL25 or LPS18 induce the maturation of dendritic cells through upregulating the expression of MHC II, CD80, CD86, and CD40 and increasing the secretion of IL‐12, IL‐6, and TNF‐α, which induce Th1 differentiation. However, Besin et al18 and Hanabuchi et al33 found that TSLP promotes a phenotype of tolerogenic semimature dendritic cells at a concentration of 20 to 50 ng/mL. Consistent with its effect on DCs in a model of diabetes or in the thymus in those experiments, TSLP induced tDCs in ApoE−/− mice at a concentration of 20 ng/mL but not at a concentration of 2 or 200 ng/mL. Unlike oxLDL‐DCs, the TSLP‐DCs of ApoE−/− mice displayed weaker CD86 expression and blunted their production of inflammatory cytokines (IL‐12p70 and IFN‐γ). Consistent with our results, other groups have found that TSLP switches off the production of IL‐12p70, TNF‐α, and IFN‐γ by dendritic cells in humans.8,34–35 Furthermore, TSLP significantly upregulates the secretion of TGF‐β for DCs and the mean fluorescence intensity of coinhibitory molecule PD‐L1, which plays an important role in the induction of Tregs and in downregulating the proatherogenic T‐cell response and atherosclerosis by limiting APC‐dependent T‐cell activation.36 All these results are signs of functional tDCs.9
Recently, Lu et al37 found that TSLP marginally maintained human naive CD4+ T‐cell survival but did not promote its proliferation. Furthermore, it has been reported that TSLP‐DCs induce the differentiation of naive CD4+ T cells toward Th2 cells that produced IL‐4, IL‐13, and TNF‐α but not IFN‐γ.35 Our results indicated that TSLP‐DCs induced CD4+ T cells to differentiate into Th2 but not to proliferate, compared with oxLDL‐DCs or iDCs. Similar to TSLP‐DCs of secreting TGF‐β, CD4+ T cells cocultured with TSLP‐DCs (4:1) also secreted large amounts of TGF‐β.18 When splenic CD4+CD25− T cells were cocultured with TSLP‐DCs, the percentage of Foxp3+ Tregs or CD4+LAP+ Tregs was significantly increased compared with the cells primed with oxLDL‐DCs or iDCs. Hence, we have reason to believe that CD4+LAP+ Tregs are a major source of TGF‐β among several subtypes of CD4+ T cells. In addition, TSLP‐DC treatment induced stronger expansion of CD4+CD25+ T cells compared with other cell‐type treatments. This means that the expansion and differentiation are both indispensable in the induction of nTregs.
Previously, TSLP, which is involved in allergic disease through Th2 modulation,34–35 was considered an “inflammatory” factor. However, additional studies have indicated that TSLP plays a key role in immune tolerance in several murine sites, including the intestine, thymus, and colon.16–17,30 In our study, TSLP or TSLP‐DC treatment significantly alleviated the extent of atherosclerotic plaque with increased nTregs and CD4+LAP+ Tregs in the spleen. In vivo, we observed large expression of TGF‐β in the plasma, aortas, and spleens of mice treated with TSLP or TSLP‐DCs. It has been reported that CD4+LAP+ Tregs secrete TGF‐β and are also activated by TGF‐β produced by themselves.28 When injected into mice, TSLP enters into tissues through the entire body, including central and peripheral immune organs. Combining these results with our in vitro findings, we infer that TSLP and TGF‐β collectively promoted the differentiation of naive CD4+ T cells into CD4+LAP+ Tregs in the intestinal mucosa, thymus, and lymph nodes before migration to the spleen. This is consistent with the observed dramatic increase of CD4+LAP+ Tregs in the spleen. There are possible explanations for the increased percentage of CD4+CD25+Foxp3+ Tregs and the link between nTregs and CD4+LAP+ Tregs observed in our study. From our above results, we discovered 3 mechanisms involved in the function of TSLP to induce nTregs: (1) the expansion of nTregs by TSLP‐DCs, (2) the induction of the differentiation of CD4+CD25− T cells into CD4+CD25+ Tregs by TSLP‐DCs, and (3) the fostering of nTreg development directly by TSLP. Among these mechanisms, the TGF‐β produced by TSLP‐DCs and CD4+LAP+ Tregs played an important role in inducing expression of the transcription factor Foxp3.27 Given previous findings,17–18,30 it is likely that the increase in nTregs originated from not only the central immune organ (thymus) but also from regions in the periphery (intestinal mucosa, lymph nodes, spleen). Recently, TGF‐β, which is produced by many types of cells in atherosclerotic plaques, has been drawing much attention as a potent protective cytokine in atherosclerosis.38 In particular, the deletion of TGF‐β signaling in T cells accelerated plaque formation and inflammatory cell infiltration. Furthermore, other studies revealed that TGF‐β also suppressed foam cell formation and increased collagen biosynthesis.6,39 TGF‐β in association with an increase of Foxp3+ Tregs in plaques found in our study could establish a noninflammatory environment in atherosclerotic lesions. This led to decreased CD4+ T‐cell infiltration and macrophage‐derived foam cell formation and a slight increase in collagen content although not statistically significant. Although TGF‐β does not promote smooth muscle proliferation, it encourages expression of type I TGF‐β receptors on smooth muscle cells but not type II receptors, which induces collagen production and a stable plaque phenotype.38 This was proven when atheroprotection was abrogated and the percentage of macrophages and CD4+ T‐cell number in the plaques increased after neutralization of TGF‐β. Unlike in previous studies,7 our data did not indicate inhibition of Th17 cells in the TGF‐β environment in atherosclerotic mice.
Furthermore, the increased percentage of Th2 cells in the spleen and increased expression of non‐inflammatory factors IL‐4 and IL‐10 by TSLP or TSLP‐DC treatment implied a differentiation of Th2 cells, which would benefit the progression of atherosclerosis, as Th1 and Th2 cells reciprocally inhibit each other.40 In the present study, Th2 cells or a switch from Th1 to Th2 may have protected against atherosclerosis by limiting the Th1 cell response.41–42 Given the inhibitory effect of Tregs on Th1, it was not difficult to understand the decreased Th1 cells observed in the spleen and the decreased IFN‐γ in the aorta. In the TSLP treatment group, high levels of plasma oxLDL‐specific antibodies, especially Th2‐type IgG1 and IgM, were detected. Recently, Miller et al43 found that IL‐33 reduced atherosclerosis by inducing IL‐5‐dependent IgG1. In rabbit and murine models, it has been shown that immunization with oxLDL induces antibody formation (both IgG and IgM) and protects against the development of atherosclerosis.44 Here, TSLP protected against the development of atherosclerosis partly through the differentiation of Th2 cells and, subsequently, the production of Th2‐type antibodies.
In summary, our study is the first to highlight that TSLP atheroprotection in atherosclerosis is mediated through tolerogenic dendritic cells that increase protective CD4+LAP+ Tregs and nTregs and promote inflammatory Th1 cell change into noninflammatory Th2 cells. This modulation facilitates a Th2 humoral immune response.
Sources of Funding
This work was supported by 3 grants from the National Natural Science Foundations of China (81070237 to Q.Z., 81270354 to Q.Z., and 81160045 to Q.J.).
Disclosures
None.
Acknowledgments
We are particularly grateful to Shunchang Zhou for his expert technical assistance.
References
- 1.Hansson GK, Libby P. The immune response in atherosclerosis: a double‐edged sword. Nat Rev Immunol. 2006; 6:508-519 [DOI] [PubMed] [Google Scholar]
- 2.Zhou X, Nicoletti A, Elhage R, Hansson GK. Transfer of CD4(+) T cells aggravates atherosclerosis in immunodeficient apolipoprotein E knockout mice. Circulation. 2000; 102:2919-2922 [DOI] [PubMed] [Google Scholar]
- 3.Gupta S, Pablo AM, Jiang X, Wang N, Tall AR, Schindler C. IFN‐gamma potentiates atherosclerosis in ApoE knock‐out mice. J Clin Invest. 1997; 99:2752-2761 [DOI] [PMC free article] [PubMed] [Google Scholar]
- 4.Smith E, Prasad KM, Butcher M, Dobrian A, Kolls JK, Ley K, Galkina E. Blockade of interleukin‐17A results in reduced atherosclerosis in apolipoprotein E‐deficient mice. Circulation. 2010; 121:1746-1755 [DOI] [PMC free article] [PubMed] [Google Scholar]
- 5.Ait‐Oufella H, Salomon BL, Potteaux S, Robertson AK, Gourdy P, Zoll J, Merval R, Esposito B, Cohen JL, Fisson S, Flavell RA, Hansson GK, Klatzmann D, Tedgui A, Mallat Z. Natural regulatory T cells control the development of atherosclerosis in mice. Nat Med. 2006; 12:178-180 [DOI] [PubMed] [Google Scholar]
- 6.Mallat Z, Gojova A, Marchiol‐Fournigault C, Esposito B, Kamate C, Merval R, Fradelizi D, Tedgui A. Inhibition of transforming growth factor‐beta signaling accelerates atherosclerosis and induces an unstable plaque phenotype in mice. Circ Res. 2001; 89:930-934 [DOI] [PubMed] [Google Scholar]
- 7.Sasaki N, Yamashita T, Takeda M, Shinohara M, Nakajima K, Tawa H, Usui T, Hirata K. Oral anti‐CD3 antibody treatment induces regulatory T cells and inhibits the development of atherosclerosis in mice. Circulation. 2009; 120:1996-2005 [DOI] [PubMed] [Google Scholar]
- 8.Lanzavecchia A, Sallusto F. The instructive role of dendritic cells on T cell responses: lineages, plasticity and kinetics. Curr Opin Immunol. 2001; 13:291-298 [DOI] [PubMed] [Google Scholar]
- 9.Morelli AE, Thomson AW. Tolerogenic dendritic cells and the quest for transplant tolerance. Nat Rev Immunol. 2007; 7:610-621 [DOI] [PubMed] [Google Scholar]
- 10.Riedl E, Strobl H, Majdic O, Knapp W. TGF‐beta 1 promotes in vitro generation of dendritic cells by protecting progenitor cells from apoptosis. J Immunol. 1997; 158:1591-1597 [PubMed] [Google Scholar]
- 11.Steinbrink K, Wolfl M, Jonuleit H, Knop J, Enk AH. Induction of tolerance by IL‐10‐treated dendritic cells. J Immunol. 1997; 159:4772-4780 [PubMed] [Google Scholar]
- 12.Sato K, Yamashita N, Yamashita N, Baba M, Matsuyama T. Regulatory dendritic cells protect mice from murine acute graft‐versus‐host disease and leukemia relapse. Immunity. 2003; 18:367-379 [DOI] [PubMed] [Google Scholar]
- 13.Tarbell KV, Yamazaki S, Olson K, Toy P, Steinman RM. CD25+ CD4+ T cells, expanded with dendritic cells presenting a single autoantigenic peptide, suppress autoimmune diabetes. J Exp Med. 2004; 199:1467-1477 [DOI] [PMC free article] [PubMed] [Google Scholar]
- 14.Hermansson A, Johansson DK, Ketelhuth DF, Andersson J, Zhou X, Hansson GK. Immunotherapy with tolerogenic apolipoprotein B‐100‐loaded dendritic cells attenuates atherosclerosis in hypercholesterolemic mice. Circulation. 2011; 123:1083-1091 [DOI] [PubMed] [Google Scholar]
- 15.Reche PA, Soumelis V, Gorman DM, Clifford T, Liu M, Travis M, Zurawski SM, Johnston J, Liu YJ, Spits H, de Waal MR, Kastelein RA, Bazan JF. Human thymic stromal lymphopoietin preferentially stimulates myeloid cells. J Immunol. 2001; 167:336-343 [DOI] [PubMed] [Google Scholar]
- 16.Taylor BC, Zaph C, Troy AE, Du Y, Guild KJ, Comeau MR, Artis D. TSLP regulates intestinal immunity and inflammation in mouse models of helminth infection and colitis. J Exp Med. 2009; 206:655-667 [DOI] [PMC free article] [PubMed] [Google Scholar]
- 17.Watanabe N, Wang YH, Lee HK, Ito T, Wang YH, Cao W, Liu YJ. Hassall's corpuscles instruct dendritic cells to induce CD4+CD25+ regulatory T cells in human thymus. Nature. 2005; 436:1181-1185 [DOI] [PubMed] [Google Scholar]
- 18.Besin G, Gaudreau S, Menard M, Guindi C, Dupuis G, Amrani A. Thymic stromal lymphopoietin and thymic stromal lymphopoietin‐conditioned dendritic cells induce regulatory T‐cell differentiation and protection of NOD mice against diabetes. Diabetes. 2008; 57:2107-2117 [DOI] [PMC free article] [PubMed] [Google Scholar]
- 19.Redgrave TG, Roberts DC, West CE. Separation of plasma lipoproteins by density‐gradient ultracentrifugation. Anal Biochem. 1975; 65:42-49 [DOI] [PubMed] [Google Scholar]
- 20.Holven KB, Aukrust P, Holm T, Ose L, Nenseter MS. Folic acid treatment reduces chemokine release from peripheral blood mononuclear cells in hyperhomocysteinemic subjects. Arterioscler Thromb Vasc Biol. 2002; 22:699-703 [DOI] [PubMed] [Google Scholar]
- 21.Inaba K, Inaba M, Deguchi M, Hagi K, Yasumizu R, Ikehara S, Muramatsu S, Steinman RM. Granulocytes, macrophages, and dendritic cells arise from a common major histocompatibility complex class II‐negative progenitor in mouse bone marrow. Proc Natl Acad Sci USA. 1993; 90:3038-3042 [DOI] [PMC free article] [PubMed] [Google Scholar]
- 22.Chang MK, Binder CJ, Miller YI, Subbanagounder G, Silverman GJ, Berliner JA, Witztum JL. Apoptotic cells with oxidation‐specific epitopes are immunogenic and proinflammatory. J Exp Med. 2004; 200:1359-1370 [DOI] [PMC free article] [PubMed] [Google Scholar]
- 23.Daugherty A, Whitman SC. Quantification of atherosclerosis in mice. Methods Mol Biol. 2003; 209:293-309 [DOI] [PubMed] [Google Scholar]
- 24.Rimoldi M, Chieppa M, Salucci V, Avogadri F, Sonzogni A, Sampietro GM, Nespoli A, Viale G, Allavena P, Rescigno M. Intestinal immune homeostasis is regulated by the crosstalk between epithelial cells and dendritic cells. Nat Immunol. 2005; 6:507-514 [DOI] [PubMed] [Google Scholar]
- 25.Perrin‐Cocon L, Coutant F, Agaugue S, Deforges S, Andre P, Lotteau V. Oxidized low‐density lipoprotein promotes mature dendritic cell transition from differentiating monocyte. J Immunol. 2001; 167:3785-3791 [DOI] [PubMed] [Google Scholar]
- 26.Salonen JT, Yla‐Herttuala S, Yamamoto R, Butler S, Korpela H, Salonen R, Nyyssonen K, Palinski W, Witztum JL. Autoantibody against oxidised LDL and progression of carotid atherosclerosis. Lancet. 1992; 339:883-887 [DOI] [PubMed] [Google Scholar]
- 27.Chen W, Jin W, Hardegen N, Lei KJ, Li L, Marinos N, McGrady G, Wahl SM. Conversion of peripheral CD4+CD25‐ naive T cells to CD4+CD25+ regulatory T cells by TGF‐beta induction of transcription factor Foxp3. J Exp Med. 2003; 198:1875-1886 [DOI] [PMC free article] [PubMed] [Google Scholar]
- 28.Oida T, Zhang X, Goto M, Hachimura S, Totsuka M, Kaminogawa S, Weiner HL. CD4+CD25‐ T cells that express latency‐associated peptide on the surface suppress CD4+CD45RBhigh‐induced colitis by a TGF‐beta‐dependent mechanism. J Immunol. 2003; 170:2516-2522 [DOI] [PubMed] [Google Scholar]
- 29.Zhong Y, Wang X, Ji Q, Mao X, Tang H, Yi G, Meng K, Yang X, Zeng Q. CD4+LAP + and CD4 +CD25 +Foxp3 + regulatory T cells induced by nasal oxidized low‐density lipoprotein suppress effector T cells response and attenuate atherosclerosis in ApoE−/− mice. J Clin Immunol. 2012; 32:1104-1117 [DOI] [PubMed] [Google Scholar]
- 30.Spadoni I, Iliev ID, Rossi G, Rescigno M. Dendritic cells produce TSLP that limits the differentiation of Th17 cells, fosters Treg development, and protects against colitis. Mucosal Immunol. 2012; 5:184-193 [DOI] [PubMed] [Google Scholar]
- 31.Turcot V, Bouchard L, Faucher G, Garneau V, Tchernof A, Deshaies Y, Perusse L, Marceau S, Biron S, Lescelleur O, Biertho L, Vohl MC. Thymic stromal lymphopoietin: an immune cytokine gene associated with the metabolic syndrome and blood pressure in severe obesity. Clin Sci (Lond). 2012; 123:99-109 [DOI] [PubMed] [Google Scholar]
- 32.Miller AM, Asquith DL, Hueber AJ, Anderson LA, Holmes WM, McKenzie AN, Xu D, Sattar N, McInnes IB, Liew FY. Interleukin‐33 induces protective effects in adipose tissue inflammation during obesity in mice. Circ Res. 2010; 107:650-658 [DOI] [PMC free article] [PubMed] [Google Scholar]
- 33.Hanabuchi S, Ito T, Park WR, Watanabe N, Shaw JL, Roman E, Arima K, Wang YH, Voo KS, Cao W, Liu YJ. Thymic stromal lymphopoietin‐activated plasmacytoid dendritic cells induce the generation of FOXP3+ regulatory T cells in human thymus. J Immunol. 2010; 184:2999-3007 [DOI] [PMC free article] [PubMed] [Google Scholar]
- 34.Soumelis V, Reche PA, Kanzler H, Yuan W, Edward G, Homey B, Gilliet M, Ho S, Antonenko S, Lauerma A, Smith K, Gorman D, Zurawski S, Abrams J, Menon S, McClanahan T, de Waal‐Malefyt RR, Bazan F, Kastelein RA, Liu YJ. Human epithelial cells trigger dendritic cell mediated allergic inflammation by producing TSLP. Nat Immunol. 2002; 3:673-680 [DOI] [PubMed] [Google Scholar]
- 35.Ito T, Wang YH, Duramad O, Hori T, Delespesse GJ, Watanabe N, Qin FX, Yao Z, Cao W, Liu YJ. TSLP‐activated dendritic cells induce an inflammatory T helper type 2 cell response through OX40 ligand. J Exp Med. 2005; 202:1213-1223 [DOI] [PMC free article] [PubMed] [Google Scholar]
- 36.Gotsman I, Grabie N, Dacosta R, Sukhova G, Sharpe A, Lichtman AH. Proatherogenic immune responses are regulated by the PD‐1/PD‐L pathway in mice. J Clin Invest. 2007; 117:2974-2982 [DOI] [PMC free article] [PubMed] [Google Scholar]
- 37.Lu N, Wang YH, Wang YH, Arima K, Hanabuchi S, Liu YJ. TSLP and IL‐7 use two different mechanisms to regulate human CD4+ T cell homeostasis. J Exp Med. 2009; 206:2111-2119 [DOI] [PMC free article] [PubMed] [Google Scholar]
- 38.Grainger DJ. Transforming growth factor beta and atherosclerosis: so far, so good for the protective cytokine hypothesis. Arterioscler Thromb Vasc Biol. 2004; 24:399-404 [DOI] [PubMed] [Google Scholar]
- 39.Lutgens E, Gijbels M, Smook M, Heeringa P, Gotwals P, Koteliansky VE, Daemen MJ. Transforming growth factor‐beta mediates balance between inflammation and fibrosis during plaque progression. Arterioscler Thromb Vasc Biol. 2002; 22:975-982 [DOI] [PubMed] [Google Scholar]
- 40.Mosmann TR, Coffman RL. TH1 and TH2 cells: different patterns of lymphokine secretion lead to different functional properties. Annu Rev Immunol. 1989; 7:145-173 [DOI] [PubMed] [Google Scholar]
- 41.Paigen B, Morrow A, Brandon C, Mitchell D, Holmes P. Variation in susceptibility to atherosclerosis among inbred strains of mice. Atherosclerosis. 1985; 57:65-73 [DOI] [PubMed] [Google Scholar]
- 42.Huber SA, Sakkinen P, David C, Newell MK, Tracy RP. T helper‐cell phenotype regulates atherosclerosis in mice under conditions of mild hypercholesterolemia. Circulation. 2001; 103:2610-2616 [DOI] [PubMed] [Google Scholar]
- 43.Miller AM, Xu D, Asquith DL, Denby L, Li Y, Sattar N, Baker AH, McInnes IB, Liew FY. IL‐33 reduces the development of atherosclerosis. J Exp Med. 2008; 205:339-346 [DOI] [PMC free article] [PubMed] [Google Scholar]
- 44.Hulthe J. Antibodies to oxidized LDL in atherosclerosis development—clinical and animal studies. Clin Chim Acta. 2004; 348:1-8 [DOI] [PubMed] [Google Scholar]