

Abstract
Background
Long‐chain polyunsaturated omega‐3 fatty acids (n‐3 PUFA) demonstrated antiarrhythmic potential in experimental studies. In a large multinational randomized trial (OPERA), perioperative fish oil supplementation did not reduce the risk of postoperative atrial fibrillation (PoAF) in cardiac surgery patients. However, whether presupplementation habitual plasma phospholipid n‐3 PUFA, or achieved or change in n‐3 PUFA level postsupplementation are associated with lower risk of PoAF is unknown.
Methods and Results
In 564 subjects undergoing cardiac surgery between August 2010 and June 2012 in 28 centers across 3 countries, plasma phospholipid levels of eicosapentaenoic acid (EPA), docosapentaenoic acid (DPA), and docosahexaenoic acid (DHA) were measured at enrollment and again on the morning of cardiac surgery following fish oil or placebo supplementation (10 g over 3 to 5 days, or 8 g over 2 days). The primary endpoint was incident PoAF lasting ≥30 seconds, centrally adjudicated, and confirmed by rhythm strip or ECG. Secondary endpoints included sustained (≥1 hour), symptomatic, or treated PoAF; the time to first PoAF; and the number of PoAF episodes per patient. PoAF outcomes were assessed until hospital discharge or postoperative day 10, whichever occurred first. Relative to the baseline, fish oil supplementation increased phospholipid concentrations of EPA (+142%), DPA (+13%), and DHA (+22%) (P<0.001 each). Substantial interindividual variability was observed for change in total n‐3 PUFA (range=−0.7% to 7.5% after 5 days of supplementation). Neither individual nor total circulating n‐3 PUFA levels at enrollment, morning of surgery, or change between these time points were associated with risk of PoAF. The multivariable‐adjusted OR (95% CI) across increasing quartiles of total n‐3 PUFA at enrollment were 1.0, 1.06 (0.60 to 1.90), 1.35 (0.76 to 2.38), and 1.19 (0.64 to 2.20); and for changes in n‐3 PUFA between enrollment and the morning of surgery were 1.0, 0.78 (0.44 to 1.39), 0.89 (0.51 to 1.55), and 1.01 (0.58 to 1.75). In stratified analysis, demographic, medication, and cardiac parameters did not significantly modify these associations. Findings were similar for secondary PoAF endpoints.
Conclusions
Among patients undergoing cardiac surgery, neither higher habitual circulating n‐3 PUFA levels, nor achieved levels or changes following short‐term fish oil supplementation are associated with risk of PoAF.
Clinical Trial Registration
URL: Clinicaltrials.gov Unique identifier: NCT00970489
Keywords: biomarker, cardiac surgery, omega‐3 fatty acids, postoperative atrial fibrillation, randomized controlled trial
Introduction
Postoperative atrial fibrillation (PoAF) is a major complication of cardiac surgery and can cause hemodynamic disturbances, thromboembolic events, cognitive impairment, extended hospital stay, and increased health care use and costs.1 Current prophylactic therapy such as perioperative β‐blockers and amiodarone partially reduce overall incidence of PoAF, and postoperative anticoagulation can increase bleeding risk.1–2 Despite decades of improvement in medical and surgical care, the incidence of PoAF remains largely unchanged,1,3 and novel preventive measures are urgently needed.
Seafood‐derived long‐chain omega‐3 polyunsaturated fatty acids (n‐3 PUFA) reduced susceptibility to atrial arrhythmia in animal disease models.4–6 Yet, in large randomized trials including the Omega‐3 Fatty Acids for Prevention of Postoperative Atrial Fibrillation (OPERA) trial, short‐term perioperative fish oil supplementation did not reduce PoAF.7–9 However, several important questions were not addressed by these studies. First is whether higher habitual circulating levels of n‐3 PUFA, which through long‐term improvement in CVD risk factors such as lowering blood pressure and direct myocardial membrane effects,10 could be associated with lower risk of PoAF. Second, it is unknown if subjects who achieve the highest levels of n‐3 PUFA following supplementation, or who experience the greatest changes in levels, could be at lower risk of PoAF. For instance, the achieved level of n‐3 PUFA may be most relevant given potential tissue concentration‐dependent effects of n‐3 PUFA on cardiac ion channels.11–12
We addressed these key gaps in knowledge by investigating the association of circulating plasma phospholipid n‐3 PUFA with PoAF in a subset of 564 subjects in the OPERA trial. We assessed levels of circulating n‐3 PUFA at recruitment (reflecting habitual levels prior to supplementation), achieved levels following supplementation on the morning of cardiac surgery (reflecting incorporation into circulating phospholipids), and the within‐subject change between these time points (reflecting differences in subjects' responses to supplementation). Use of objective n‐3 PUFA biomarkers also allowed us to separately evaluate total n‐3 PUFA as well as each individual long‐chain n‐3 PUFA, including eicosapentaenoic acid (EPA), docosapentaenoic acid (DPA), and docosahexaenoic acid (DHA), which may have partly differing and complementary biologic activities.13
Methods
Subjects and Study Design
This investigation was performed as a prospectively designed ancillary study of the OPERA trial, the design of which has been reported in detail.7,14 Briefly, OPERA enrolled 1516 patients undergoing cardiac surgery in 28 medical centers in the United States, Italy, and Argentina. Inclusion criteria included age (≥18 years), presence of sinus rhythm on the screening electrocardiogram (ECG) and being scheduled for cardiac surgery on the next day or later (ie, excluding emergent surgery). Patients were excluded if they had a known allergy or intolerance to fish oil or olive oil (placebo), regularly used fish oil supplements, were currently pregnant, or had an existing or planned cardiac transplant or ventricular assist device. The study was approved by the institutional review boards of all participating centers and all patients provided written informed consent.
Fish Oil Supplementation
Following enrollment, participants were block randomized to supplementation with fish oil (≈465 mg EPA and ≈375 mg DHA as ethyl esters per 1 g capsule; Omacor, Pronova Biopharma) or matched placebo (olive oil), stratified by enrolling medical center and planned valve surgery (yes/no). The total preoperative loading dose was 10 g divided over 3 to 5 days (or 8 g divided over 2 days), including on the morning of surgery. The loading time frame was designed to be flexible to maximize enrollment of all possible patients; for each patient, the dose was divided over the maximum number of days possible, based on the date of enrollment and the date of planned surgery. After cardiac surgery, patients continued to receive 2 g/day until hospital discharge or postoperative day 10, whichever occurred first, at which time administrative censoring occurred for follow‐up of PoAF.
Fatty Acid Analysis
In 17 study centers that agreed to participate in this ancillary study, fasting blood was collected from subjects using standardized kits and techniques, including at enrollment and on the morning of cardiac surgery. EDTA anticoagulated plasma samples were stored at −70°C at each study center and then shipped on dry ice to a central sample repository for long‐term storage at −80°C. Following completion of the trial, plasma phospholipid n‐3 PUFA were measured as percent of total phospholipid fatty acids by the Fred Hutchinson Cancer Research Institute (Seattle, WA). Plasma total lipids were extracted,15 and phospholipids isolated by thin‐layer chromatography. Fatty acid methyl esters were subsequently prepared by direct transesterification according to Lepage and Roy,16 and analyzed by gas chromatography (Agilent 5890 gas chromatograph flame ionization detector, Agilent Technologies; fused silica capillary column SP‐2560 [100 m×0.25 mm; 0.2 μm], Supelco; initial oven temperature 160°C for 16 minutes, ramp 3°C/min to 240°C, hold, 15 minutes). Interassay coefficients of variation were <3% for EPA, DPA, and DHA. A total of 564 and 550 subjects had available samples for n‐3 PUFA measurement at recruitment and on the morning of cardiac surgery, respectively; and 523 had available samples at both time points.
Covariates
Standardized data were collected on other risk factors for PoAF including demographics, anthropometric parameters, lifestyle habits, cardiovascular risk factors, medical and surgical history, major comorbidities, outpatient and inpatient medications, laboratory measures, and echocardiographic parameters including left ventricular (LV) ejection fraction and left atrial (LA) diameter. Details of the surgical procedure and daily follow‐up and discharge information were also recorded. Information on usual habitual fish intake at enrollment was obtained using validated semi‐quantitative food frequency questionnaires in US and Italian patients17–18; dietary data was not collected for subjects in Argentina.
Outcomes
Suspected episodes of PoAF were documented, including duration, clinical information, and confirmatory rhythm strip or 12‐lead ECG, and reviewed by a centralized events committee of cardiac eletrophysiologists. The primary endpoint was the occurrence of PoAF of at least 30 seconds duration. We also ascertained PoAF that was sustained (≥1 hour), symptomatic, or treated with pharmacological or electrical cardioversion; the time to first PoAF, and the number of PoAF episodes per patient. Outcomes were assessed until hospital discharge or postoperative day 10, whichever occurred first.
Statistical Analysis
We evaluated EPA, DPA, and DHA individually, and also their sum (total long‐chain n‐3 PUFA). Associations of n‐3 PUFA with demographic and medical variables were assessed by linear regressions or Pearson chi‐square tests. The treatment effect of fish oil supplementation on circulating n‐3 PUFA concentrations on the morning of surgery was investigated using linear regression, adjusting for n‐3 PUFA levels at enrollment. The interindividual variability for change in levels of n‐3 PUFA was expressed as the coefficient of variation (CV, %), calculated as (SDn‐3 PUFA/meann‐3 PUFA)×100. The n‐3 PUFA concentrations were evaluated in quartiles as indicator variables, and their associations with incident PoAF were investigated using multivariable‐adjusted logistic regression. The n‐3 PUFA concentrations as a percent of total phospholipid fatty acids analyzed were also examined as continuous variables. Tests of linear trend were conducted by assigning to participants the median value in each quartile and assessing this as a single continuous variable. We also examined possible nonlinear relationship between n‐3 PUFA exposures and risk of PoAF nonparametrically using restricted cubic splines, after excluding participants with extreme values (<1st or >99th percentile) to minimize the effects of outliers. Cox proportional hazards and Poisson regression were used to assess the association of n‐3 PUFA with the secondary endpoints of time to first incident PoAF and the number of PoAF episodes per patient, respectively. To minimize confounding, we adjusted for age, sex, country, body mass index, prevalent hypertension, prevalent diabetes, prevalent coronary heart disease, prevalent chronic renal failure, prevalent heart failure, smoking, dyslipidemia, statin medication use, LV ejection fraction, LA diameter, and logistic Euroscore.19 As randomized assignment to fish oil supplementation did not alter risk of PoAF in OPERA,7 we did not adjust for treatment group assignment in the primary analysis. In sensitivity analysis, additional adjustment for treatment assignment did not materially alter the observed associations. We did not adjust for dietary covariates. Missing covariates (<3%) were imputed by best‐subset regression using demographic/risk variables. For LA diameter (32% missing), we used a missing indicator category. Results were similar excluding those with missing covariate values.
Effect modification were evaluated in stratified analyses for several subgroups including age (<median, ≥median), sex, country, perioperative beta‐blocker and statin use, preoperative LA diameter (<median, ≥median), and preoperative LV ejection fraction (<median, ≥median). For each subgroup, fatty acids were assessed in stratum‐specific quartiles as indicator variables. The significance of potential effect modification was tested using the Wald test for a multiplicative interaction term between the fatty acid quartiles (evaluated as ordinal variables) and the stratification variable. All P values were 2 tailed (α=0.05), and analyses were performed with Stata 12.1 (Stata Corp).
Results
The 564 subjects were enrolled in the United States (57.4%), Italy (31.7%), and Argentina (10.8%), with approximately half (51.4%) of the subjects assigned the fish oil treatment. At baseline, DHA was the most abundant n‐3 PUFA (mean±SD, 3.15±1.1% of the total plasma phospholipid fatty acids), compared with DPA (0.84±0.19%) and EPA (0.67±0.49%). Demographic and medical characteristics at baseline according to plasma phospholipid EPA, DPA, and DHA are shown in Table 1. Subjects from Italy tended to have higher EPA and DHA than subjects from the US or Argentina, whereas those from the US had higher DPA than subjects from Italy or Argentina. Self‐reported fish consumption was higher in Italy (2.2±1.6 servings/week) than in the US (1.1±2.1 servings/week), and was also positively associated with plasma phospholipid EPA and DHA (r=0.21 and 0.50, respectively), but not DPA (r=−0.16). Subjects with higher n‐3 PUFA levels were less likely to smoke; EPA and DHA levels were also positively associated with LA diameter. Other baseline characteristics demonstrated varied associations with each n‐3 PUFA. For example, EPA was associated with less renal failure and higher ejection fraction, DHA was associated with older age and more dyslipidemia, and DPA was unassociated with most covariates. Baseline demographic and medical characteristics were very similar between patients with plasma fatty acid data included in the current analyses, compared to those without blood samples (Table 2).
Table 1.
Baseline Characteristics According to Baseline Plasma Phospholipid EPA, DPA, and DHA among 564 Participants in the OPERA Trial
| Quartiles of EPA | Quartiles of DPA | Quartiles of DHA | ||||||||||
|---|---|---|---|---|---|---|---|---|---|---|---|---|
| Q1 | Q2 | Q3 | Q4 | Q1 | Q2 | Q3 | Q4 | Q1 | Q2 | Q3 | Q4 | |
| Percent of total fatty acids | 0.31±0.06 | 0.47±0.04 | 0.63±0.05 | 1.26±0.66 | 0.63±0.06 | 0.76±0.03 | 0.89±0.04 | 1.10±0.14 | 1.96±0.30 | 2.64±0.16 | 3.34±0.24 | 4.65±0.76 |
| Range | 0.09 to 0.39 | 0.40 to 0.54 | 0.54 to 0.74 | 0.74 to 3.97 | 0.38 to 0.70 | 0.70 to 0.82 | 0.82 to 0.97 | 0.97 to 2.02 | 0.86 to 2.38 | 2.38 to 2.93 | 2.93 to 3.78 | 3.79 to 7.29 |
| Number of subjects | 141 | 142 | 140 | 141 | 141 | 141 | 141 | 141 | 141 | 141 | 141 | 141 |
| Country, % | ||||||||||||
| US (n=324) | 67.4 | 64.1 | 54.3 | 44.0* | 39.0 | 48.2 | 68.1 | 74.5* | 86.5 | 70.2 | 46.8 | 26.2* |
| Italy (n=179) | 15.6 | 27.5 | 35.7 | 48.2 | 44.7 | 37.6 | 27.0 | 17.7 | 7.1 | 18.4 | 35.5 | 66.0 |
| Argentina (n=61) | 17.0 | 8.5 | 10 | 7.8 | 16.3 | 14.2 | 5.0 | 7.8 | 6.4 | 11.4 | 17.7 | 7.8 |
| Fish, servings/week | 1.16±2.48 | 1.38±2.58 | 1.26±2.12 | 1.94±2.35* | 1.45±1.61 | 1.79±3.05 | 1.16±2.06 | 1.37±2.59 | 0.41±0.79 | 1.23±2.39 | 1.87±2.93 | 2.43±2.66* |
| Age, y | 61.3±13.9 | 62.4±11.6 | 63.1±12.8 | 63.4±12.5 | 64.2±11.6 | 61.4±12.4 | 62.5±13.1 | 62.2±13.7 | 57.1±13.8 | 61.3±13.3 | 65.6±10.6 | 66.3±10.6* |
| Sex, % male | 78.0 | 66.9 | 75.7 | 67.4 | 71.6 | 73.1 | 68.8 | 74.5 | 65.3 | 78.0 | 74.5 | 70.2 |
| Planned valve surgery, % | 53.2 | 54.2 | 57.9 | 58.2 | 60.3 | 53.2 | 54.6 | 55.3 | 61.0 | 55.3 | 53.2 | 53.9 |
| Current smoking, % | 17.9 | 17.8 | 10.9 | 8.6* | 17.1 | 13.9 | 13.2 | 10.8 | 22.1 | 13.1 | 12.9 | 7.2* |
| Diabetes mellitus, % | 35.5 | 28.2 | 28.6 | 26.2 | 28.4 | 34.8 | 22.0 | 33.3 | 31.2 | 25.5 | 39.7 | 22.0 |
| Body mass index, kg/m2 | 28.5±6.7 | 29.3±6.7 | 29.0±5.6 | 29.0±5.1 | 29.0±6.0 | 29.3±6.4 | 29.2±6.3 | 28.4±5.6 | 30.0±7.2 | 28.7±6.4 | 28.4±4.6 | 28.7±5.8 |
| Waist circumference, cm | 99.7±15.6 | 99.3±15.0 | 99.7±13.6 | 99.5±16.7 | 102±14.3 | 101±16.7 | 98.6±15.2 | 96.8±14.4* | 97.0±16.1 | 102±15.4 | 97.0±13.9 | 102±15.2 |
| Hypertension, % | 76.6 | 75.4 | 73.6 | 81.6 | 79.4 | 70.9 | 78.7 | 78.0 | 71.6 | 69.5 | 82.3 | 83.7* |
| COPD, % | 16.3 | 17.6 | 12.9 | 12.8 | 12.1 | 12.1 | 19.9 | 15.6 | 22.0 | 10.6 | 15.6 | 11.4 |
| Dyslipidemia, % | 61.0 | 61.3 | 60.7 | 70.2 | 64.5 | 57.5 | 64.5 | 66.7 | 50.4 | 64.5 | 66.7 | 71.6* |
| Chronic renal failure, % | 12.1 | 4.9 | 7.1 | 1.4* | 9.2 | 5.7 | 4.3 | 6.4 | 5.7 | 5.7 | 8.5 | 5.7 |
| Coronary heart disease, % | 46.8 | 50 | 37.1 | 41.8 | 44.7 | 43.3 | 40.4 | 47.5 | 37.6 | 47.5 | 46.8 | 44.0 |
| Prior myocardial infarction, % | 26.2 | 27.5 | 17.9 | 18.4 | 19.9 | 22.7 | 23.4 | 24.1 | 19.9 | 25.5 | 25.5 | 19.2 |
| Prior PCI, % | 12.1 | 16.2 | 15 | 12.1 | 9.2 | 14.2 | 14.2 | 17.7* | 13.5 | 17.7 | 10.6 | 13.5 |
| Prior arrhythmias, % | 14.9 | 15.5 | 15.7 | 10.6 | 12.1 | 12.8 | 17.7 | 14.2 | 16.3 | 12.8 | 15.6 | 12.1 |
| Prior atrial fibrillation, % | 9.2 | 9.9 | 9.3 | 5.7 | 7.8 | 7.1 | 10.6 | 8.5 | 10.6 | 7.8 | 8.5 | 7.1 |
| Congestive heart failure, % | 23.4 | 21.8 | 19.3 | 15.6 | 24.1 | 15.6 | 19.2 | 21.3 | 27.7 | 16.3 | 17.7 | 18.4 |
| EF, % | 52.8±12.9 | 55.7±10.9 | 57.4±10.2 | 59.0±9.9* | 55.3±11.2 | 55.6±11.5 | 57.3±10.7 | 56.6±11.6 | 55.4±11.4 | 55.7±11.2 | 56.4±11.6 | 57.3±10.8 |
| LA diameter, mm | 41.7±6.9 | 41.1±7.4 | 43.6±8.3 | 43.5±8.2* | 41.9±8.6 | 41.7±7.4 | 43.5±7.2 | 43.0±7.6 | 41.5±6.9 | 41.6±8.0 | 43.3±7.9 | 43.7±8.1* |
| β‐blocker, % | 58.2 | 52.8 | 52.9 | 49.7 | 53.2 | 56.7 | 52.5 | 51.1 | 55.3 | 51.1 | 56.7 | 50.4 |
| Statins, % | 54.6 | 58.5 | 55 | 56.7 | 53.9 | 51.8 | 60.3 | 58.9 | 42.6 | 55.3 | 66.0 | 61.0* |
| ACE inhibitor, % | 36.9 | 30.3 | 33.6 | 39.0 | 36.2 | 43.3 | 31.9 | 28.4* | 31.2 | 33.3 | 39.0 | 36.2 |
| Aspirin, % | 64.5 | 63.4 | 63.6 | 53.9 | 61.7 | 61.0 | 56.7 | 66.0 | 58.2 | 68.1 | 68.8 | 50.4 |
| Antiarrhythmics, % | 3.6 | 6.3 | 5.7 | 2.8 | 4.3 | 5.0 | 5.0 | 4.3 | 5.7 | 2.1 | 6.4 | 4.3 |
| Logistic Euroscore, units | 8.1±10 | 6.5±8.5 | 5.3±4.9 | 5.5±6.1* | 6.5±7.7 | 5.0±5.6 | 6.9±8.7 | 6.9±8.7 | 7.1±9.6 | 5.3±6.2 | 6.8±8.6 | 6.1±6.4 |
Values are mean±SD for continuous variables and percent for categorical variables. ACE indicates angiotensin‐converting enzyme; COPD, chronic obstructive pulmonary disease; DHA, docosahexaenoic acid; DPA, docosapentaenoic acid; EF, ejection fraction; EPA, eicosapentaenoic acid; LA, left atrial; n‐3 PUFA, n‐3 polyunsaturated fatty acids; OPERA, omega‐3 fatty acids for prevention of postoperative atrial fibrillation; PCI, percutaneous coronary intervention.
P<0.05 for trend across quartiles.
P<0.001 by Pearson chi‐square test.
Table 2.
Baseline Characteristics for Subjects With and Without Plasma Fatty Acid Measurement in the OPERA Trial
| Characteristics | Plasma Fatty Acid Data Available | |
|---|---|---|
| No (n=952), Excluded From the Current Analyses | Yes (n=564), Included in the Current Analyses | |
| Age, y | 64.4±12.3 | 62.6±12.7 |
| Sex, % male | 688 (72.3) | 406 (72.0) |
| Planned valve surgery, % | 470 (49.4) | 315 (55.9) |
| Current smoking, % | 119 (12.5) | 76 (13.5) |
| BMI, kg/m2 | 27.8±5.3 | 29.0±6.1 |
| Hypertension, % | 702 (73.7) | 433 (76.8) |
| Dyslipidemia, % | 580 (60.9) | 357 (63.3) |
| Diabetes mellitus,% | 226 (23.7) | 167 (29.6) |
| Chronic obstructive pulmonary disease, % | 86 (9.0) | 84 (14.9) |
| Chronic renal failure, % | 60 (6.3) | 36 (6.4) |
| Prior myocardial infarction, % | 239 (25.1) | 127 (22.5) |
| Prior percutaneous coronary intervention, % | 101 (10.6) | 78 (13.8) |
| Prior arrhythmias, % | 111 (11.7) | 80 (14.2) |
| Prior atrial fibrillation, % | 66 (6.9) | 48 (8.5) |
| Congestive heart failure, % | 303 (31.8) | 113 (20.0) |
| Ejection fraction, % | 57.0±11.4 | 56.2±11.3 |
| LA diameter, mm | 41.9±7.6 | 42.5±7.8 |
| β‐blockers, % | 576 (60.5) | 301 (53.4) |
| Statins,% | 546 (57.4) | 317 (56.2) |
| ACE inhibitors, % | 361 (37.9) | 197 (34.9) |
| Aspirin, % | 428 (45.0) | 346 (61.4) |
| Logistic EuroScore, units | 6.1±7.7 | 6.3±7.8 |
Values are mean±SD for continuous variables and percent for categorical variables. ACE indicates angiotensin‐converting enzyme; BMI, body mass index; LA, left atrial; OPERA, omega‐3 fatty acids for prevention of postoperative atrial fibrillation.
Compared with the placebo group, fish oil supplementation increased EPA, DPA, DHA, and total n‐3 PUFA levels (Figure 1A). The proportional changes differed: in the fish oil supplemented group, EPA increased by nearly 150%, DPA by 13%, and DHA by 21.9% (P<0.001 each compared with placebo groups and with adjustment for baseline n‐3 PUFA concentrations). Given its higher starting concentration, DHA remained the predominant n‐3 PUFA postsupplementation. On average, total n‐3 PUFA increased by 38% in the fish oil supplemented group (P<0.001) between enrollment and the morning of surgery. However, substantial interindividual variability was observed for change in n‐3 PUFA (Figure 1B). For example, in subjects who received 5 days of fish oil loading, the median (minimum, maximum) of change in total n‐3 PUFA as percent of plasma phospholipid fatty acid was 2.4 (−0.7, 7.5), with a coefficient of variation of 64.3%. Considerable interindividual variability was also observed for changes in individual n‐3 PUFA (not shown).
Figure 1.
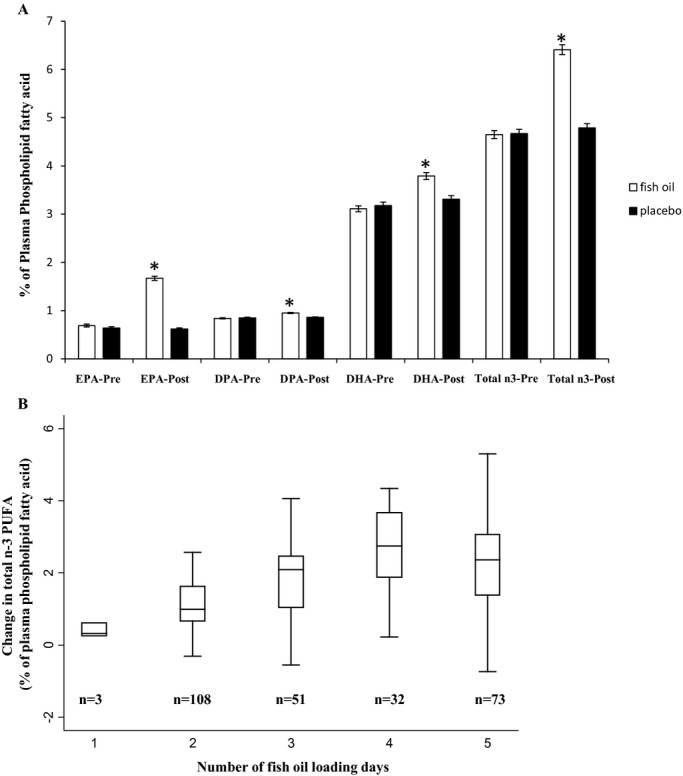
A, Plasma phospholipid concentrations of individual and total n‐3 PUFA in the OPERA trial. Subjects (n=523) received 1 to 5 days of fish oil (8 to 10 g) (white bars) or placebo (black bars). n‐3 PUFA are expressed as percentage of total plasma phospholipid fatty acids analyzed and results are presented as mean±SE of each group. *P<0.001 comparing the fish oil to placebo groups, with adjustment for baseline n‐3 PUFA concentrations. B, Change in plasma phospholipid total n‐3 PUFA concentrations in subjects who received fish oil (n=267). Data were stratified by the number of fish oil loading days presurgery. The top, middle, and lower lines of each box represent the 75th, median, and 25th percentile, respectively. The lines extending above and below the box indicate the most extreme value within the 75th percentile+1.5×(interquartile range) and 25th percentile−1.5×(interquartile range), respectively. The coefficient of variation of the change in total n‐3 PUFA were 49.1%, 66.0%, 53.8%, 43.2%, and 64.3% for subjects who received 1 to 5 days of fish oil supplementation, respectively. DHA indicates docosahexaenoic acid; DPA, docosapentaenoic acid; EPA, eicosapentaenoic acid; n‐3 PUFA, n‐3 polyunsaturated fatty acids; OPERA, omega‐3 fatty acids for prevention of postoperative atrial fibrillation; SE, standard error.
The primary endpoint occurred in 177 (32%) subjects. Neither individual nor total circulating n‐3 PUFA concentrations at enrollment, on the morning of surgery, or the change between these time points were associated with risk of PoAF (Table 3). For example, the OR (95% CI) comparing the lowest to the highest quartiles of total n‐3 PUFA at recruitment were 1.0 (reference), 1.06 (0.60 to 1.90), 1.35 (0.76 to 2.38), and 1.19 (0.64 to 2.20) (P‐trend=0.55). Findings were similar when the analyses were restricted to subjects in the fish oil treatment group, and also when n‐3 PUFA levels and changes were evaluated continuously as percent of total plasma phospholipid fatty acids (not shown). Similar results were also observed in analyses restricted to subjects with below median levels of total plasma n‐3 PUFA after fish oil supplementation period (275 subjects, 75 incident PoAF cases). For example, in these subjects the OR (95% CI) per 1% higher plasma total n‐3 PUFA on the morning of surgery was 1.31 (0.81 to 2.12). Semiparametric restricted cubic splines analyses demonstrated little evidence of overall or nonlinear associations of phospholipid n‐3 PUFA with risk of PoAF (Figure 2). All findings were similar for the secondary PoAF endpoints (data not shown). Results were similar excluding those with missing covariate values.
Table 3.
Multivariable‐Adjusted Risk of Postoperative Atrial Fibrillation According to Plasma Phospholipid Long‐Chain n‐3 PUFAs in the OPERA Trial*
| Quartiles of Fatty Acid Levels | P Value for Trend* | ||||
|---|---|---|---|---|---|
| 1st | 2nd | 3rd | 4th | ||
| Presupplementation (enrollment) concentrations | |||||
| Total long‐chain n‐3 PUFA | |||||
| % Phospholipid fatty acid | 3.25±0.37 | 3.99±0.19 | 4.79±0.31 | 6.61±1.32 | 0.55 |
| Number of cases/n | 34/142 | 37/140 | 51/141 | 51/141 | |
| Odds ratio (95% CI) | 1.0 (reference) | 1.06 (0.60 to 1.90) | 1.35 (0.76 to 2.38) | 1.19 (0.64 to 2.20) | |
| DHA | |||||
| % Phospholipid fatty acid | 1.96±0.30 | 2.64±0.16 | 3.34±0.24 | 4.65±0.76 | 0.70 |
| Number of cases/n | 33/141 | 40/141 | 54/141 | 46/141 | |
| Odds ratio (95% CI) | 1.0 (reference) | 1.11 (0.62 to 1.99) | 1.41 (0.78 to 2.54) | 0.89 (0.46 to 1.70) | |
| DPA | |||||
| % Phospholipid fatty acid | 0.63±0.06 | 0.76±0.03 | 0.89±0.04 | 1.10±0.14 | 0.85 |
| Number of cases/n | 45/141 | 41/141 | 48/141 | 39/141 | |
| Odds ratio (95% CI) | 1.0 (reference) | 1.04 (0.61 to 1.79) | 1.30 (0.75 to 2.24) | 1.02 (0.58 to 1.80) | |
| EPA | |||||
| % Phospholipid fatty acid | 0.31±0.06 | 0.47±0.04 | 0.63±0.05 | 1.26±0.66 | 0.20 |
| Number of cases/n | 37/141 | 38/142 | 48/140 | 50/141 | |
| Odds ratio (95% CI) | 1.0 (reference) | 1.04 (0.59 to 1.84) | 1.30 (0.74 to 2.26) | 1.40 (0.79 to 2.49) | |
| Postsupplementation (morning of surgery) concentrations | |||||
| Total long‐chain n‐3 PUFA | |||||
| % Phospholipid fatty acid | 3.60±0.47 | 4.84±0.33 | 6.00±0.33 | 8.03±1.18 | 0.29 |
| Number of cases/n | 33/138 | 45/137 | 48/138 | 51/137 | |
| Odds ratio (95% CI) | 1.0 (reference) | 1.36 (0.76 to 2.43) | 1.51 (0.84 to 2.72) | 1.43 (0.78 to 2.62) | |
| DHA | |||||
| % Phospholipid fatty acid | 2.14±0.35 | 3.00±0.23 | 3.83±0.28 | 5.25±0.80 | 0.66 |
| Number of cases/n | 33/138 | 42/137 | 50/138 | 52/137 | |
| Odds ratio (95% CI) | 1.0 (reference) | 1.12 (0.62 to 2.01) | 1.26 (0.69 to 2.30) | 1.16 (0.59 to 2.27) | |
| DPA | |||||
| % Phospholipid fatty acid | 0.68±0.07 | 0.83±0.04 | 0.96±0.04 | 1.17±0.12 | 0.23 |
| Number of cases/n | 46/139 | 36/137 | 50/137 | 45/137 | |
| Odds ratio (95% CI) | 1.0 (reference) | 0.81 (0.46 to 1.42) | 1.34 (0.78 to 2.32) | 1.24 (0.71 to 2.17) | |
| EPA | |||||
| % Phospholipid fatty acid | 0.39±0.09 | 0.67±0.09 | 1.25±0.23 | 2.31±0.48 | 0.68 |
| Number of cases/n | 43/141 | 41/134 | 51/138 | 42/137 | |
| Odds ratio (95% CI) | 1.0 (reference) | 0.86 (0.49 to 1.50) | 1.25 (0.73 to 2.14) | 1.01 (0.58 to 1.75) | |
| Change between morning of surgery and enrollment concentrations | |||||
| Total long‐chain n‐3 PUFA | |||||
| % Phospholipid fatty acid | −0.26±0.67 | 0.32±0.14 | 1.05±0.34 | 2.77±0.89 | 0.69 |
| Number of cases/n | 43/131 | 39/131 | 40/131 | 44/130 | |
| Odds ratio (95% CI) | 1.0 (reference) | 0.78 (0.44 to 1.39) | 0.89 (0.51 to 1.55) | 1.01 (0.58 to 1.75) | |
| DHA | |||||
| % Phospholipid fatty acid | −0.17±0.36 | 0.18±0.07 | 0.48±0.11 | 1.17±0.45 | 0.45 |
| Number of cases/n | 39/131 | 35/132 | 43/130 | 49/130 | |
| Odds ratio (95% CI) | 1.0 (reference) | 0.83 (0.47 to 1.48) | 1.06 (0.59 to 1.88) | 1.15 (0.65 to 2.03) | |
| DPA | |||||
| % Phospholipid fatty acid | −0.08±0.11 | 0.02±0.02 | 0.09±0.02 | 0.23±0.11 | 0.98 |
| Number of cases/n | 39/131 | 47/131 | 38/131 | 42/130 | |
| Odds ratio (95% CI) | 1.0 (reference) | 1.02 (0.58 to 1.80) | 0.88 (0.50 to 1.57) | 1.02 (0.58 to 1.79) | |
| EPA | |||||
| % Phospholipid fatty acid | −0.21±0.33 | 0.03±0.04 | 0.53±0.25 | 1.62±0.47 | 0.93 |
| Number of cases/n | 48/131 | 39/131 | 37/131 | 42/130 | |
| Odds ratio (95% CI) | 1.0 (reference) | 1.01 (0.57 to 1.80) | 0.83 (0.47 to 1.45) | 1.03 (0.59 to 1.79) | |
CI indicates confidence interval; DHA, docosahexaenoic acid; DPA, docosapentaenoic acid; EPA, eicosapentaenoic acid; LA, left atrial; n‐3 PUFA, n‐3 polyunsaturated fatty acids; OPERA, omega‐3 fatty acids for prevention of postoperative atrial fibrillation.
Adjusted for age (years), gender (male/female), country (Italy, US, Argentina), body mass index (kg/m2), prevalent hypertension (yes/no), prevalent diabetes (yes/no), prevalent coronary heart disease (yes/no), prevalent chronic renal failure (yes/no), prevalent heart failure (yes/no), smoking (never or former/current), dyslipidemia (yes/no), statin medication use (yes/no), ejection fraction (%), LA diameter (tertiles), and logistic Euroscore (continuous).
Linear trend was tested by assigning to participants the median value in each quartile and assessing this as a continuous variable. All findings were similar when fatty acid concentrations were evaluated in their natural units as continuous exposures.
Figure 2.
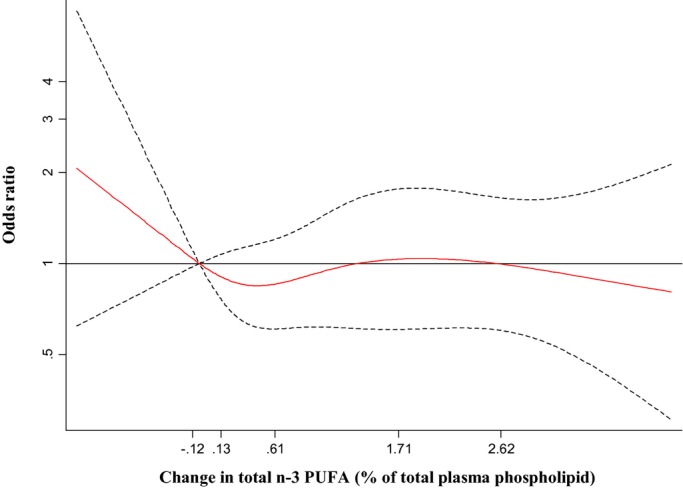
Multivariable‐adjusted association of change in plasma phospholipid total long‐chain n‐3 PUFA with risk of postoperative atrial fibrillation, evaluated by restricted cubic splines. Adjusted for age (years), gender (male/female), country (US, Italy, Argentina), body mass index (kg/m2), prevalent hypertension (yes/no), prevalent diabetes (yes/no), prevalent coronary heart disease (yes/no), prevalent chronic renal failure (yes/no), prevalent heart failure (yes/no), smoking (never or former/current), dyslipidemia (yes/no), statin medication use (yes/no), ejection fraction (%), LA diameter (tertiles), and logistic Euroscore (continuous). The solid red line and dashed black lines represent the odds ratio and 95% CIs, respectively, in comparison to the reference level representing the median value of the lowest quartile (12.5th percentile). The values shown on the x‐axis correspond to the 10th, 25th, 50th, 75th, and 90th percentiles for changes in total n‐3 PUFA. There was little evidence of either overall association (Wald‐test P=0.70) or nonlinearity (P=0.50). CI indicates confidence interval; n‐3 PUFA, n‐3 polyunsaturated fatty acids.
In stratified analysis, the relationship between n‐3 PUFA concentrations and PoAF was similar in most key subgroups defined by demographics, medication use, or LV and LA parameters (Table 4). Greater baseline total n‐3 PUFA appeared to be associated with higher risk of PoAF in subjects not using statins (n=247, extreme quartile OR=2.97; 95% CI, 1.02 to 8.60), but not in subjects using statins (n=317, extreme quartile OR=0.51, 95% CI, 0.22 to 1.17); although this potential interaction did not achieve statistical significance (P=0.06).
Table 4.
Multivariable Adjusted Association of Plasma Phospholipid Total Long‐Chain n‐3 PUFAs With Risk of Postoperative Atrial Fibrillation, According to Prespecified Subgroups*
| Quartiles of Fatty Acid Levels (Odds Ratios) | P Value for Trend* | P Value for Interaction* | ||||
|---|---|---|---|---|---|---|
| 1st | 2nd | 3rd | 4th | |||
| Enrollment n‐3 PUFA concentrations | ||||||
| Country* | ||||||
| Italy (n=179) | 1.0 (reference) | 2.25 (0.84 to 6.04) | 0.96 (0.35 to 2.64) | 2.32 (0.86 to 6.26) | 0.16 | 0.61 |
| US (n=324) | 1.0 (reference) | 2.46 (1.11 to 5.48) | 1.71 (0.74 to 3.94) | 1.92 (0.83 to 4.45) | 0.36 | |
| Age, y | ||||||
| <64 (n=272) | 1.0 (reference) | 1.93 (0.73 to 5.07) | 2.70 (1.02 to 7.13) | 3.27 (1.15 to 9.34) | 0.04 | 0.35 |
| ≥64 (n=292) | 1.0 (reference) | 0.91 (0.45 to 1.87) | 0.88 (0.42 to 1.82) | 0.77 (0.35 to 1.65) | 0.50 | |
| Sex | ||||||
| Women (n=158) | 1.0 (reference) | 2.59 (0.74 to 9.14) | 2.28 (0.66 to 7.84) | 1.17 (0.31 to 4.34) | 0.68 | 0.65 |
| Men (n=406) | 1.0 (reference) | 0.95 (0.48 to 1.89) | 1.32 (0.68 to 2.57) | 1.31 (0.63 to 2.71) | 0.34 | |
| Statins | ||||||
| No (n=247) | 1.0 (reference) | 2.14 (0.81 to 5.66) | 3.02 (1.10 to 8.29) | 2.97 (1.02 to 8.60) | 0.10 | 0.06 |
| Yes (n=317) | 1.0 (reference) | 0.68 (0.32 to 1.47) | 0.77 (0.36 to 1.64) | 0.51 (0.22 to 1.17) | 0.15 | |
| β‐blockers | ||||||
| No (n=263) | 1.0 (reference) | 0.98 (0.40 to 2.39) | 1.33 (0.57 to 3.14) | 1.75 (0.69 to 4.41) | 0.16 | 0.13 |
| Yes (n=301) | 1.0 (reference) | 0.93 (0.42 to 2.09) | 1.27 (0.57 to 2.80) | 0.69 (0.29 to 1.65) | 0.41 | |
| Ejection fraction, % | ||||||
| <60 (n=270) | 1.0 (reference) | 1.69 (0.70 to 4.08) | 2.31 (0.98 to 5.42) | 1.91 (0.75 to 4.87) | 0.25 | 0.35 |
| ≥60 (n=294) | 1.0 (reference) | 0.80 (0.36 to 1.78) | 0.98 (0.43 to 2.24) | 0.83 (0.35 to 1.94) | 0.75 | |
| LA diameter, mm | ||||||
| <42 (n=166) | 1.0 (reference) | 4.87 (1.23 to 19.3) | 7.02 (1.73 to 28.5) | 3.30 (0.67 to 16.2) | 0.63 | 0.24 |
| ≥42 (n=218) | 1.0 (reference) | 0.59 (0.23 to 1.53) | 1.26 (0.50 to 3.15) | 1.09 (0.41 to 2.94) | 0.57 | |
| Morning of surgery n‐3 PUFA concentrations | ||||||
| Country* | ||||||
| Italy (n=176) | 1.0 (reference) | 0.96 (0.36 to 2.56) | 1.33 (0.49 to 3.62) | 1.58 (0.59 to 4.19) | 0.28 | 0.85 |
| US (n=319) | 1.0 (reference) | 0.83 (0.37 to 1.86) | 1.35 (0.62 to 2.94) | 1.25 (0.58 to 2.74) | 0.35 | |
| Age, y | ||||||
| <64 (n=269) | 1.0 (reference) | 0.79 (0.31 to 2.0) | 1.27 (0.52 to 3.07) | 1.82 (0.72 to 4.61) | 0.12 | 0.90 |
| ≥64 (n=282) | 1.0 (reference) | 1.93 (0.89 to 4.17) | 1.26 (0.57 to 2.76) | 1.45 (0.66 to 3.22) | 0.70 | |
| Sex | ||||||
| Women (n=151) | 1.0 (reference) | 2.07 (0.59 to 7.32) | 1.31 (0.35 to 4.95) | 1.96 (0.52 to 7.33) | 0.53 | 0.81 |
| Men (n=399) | 1.0 (reference) | 1.30 (0.65 to 2.58) | 1.67 (0.84 to 3.33) | 1.49 (0.73 to 3.02) | 0.27 | |
| Statins | ||||||
| No (n=232) | 1.0 (reference) | 1.07 (0.40 to 2.84) | 2.01 (0.75 to 5.35) | 2.04 (0.76 to 5.46) | 0.10 | 0.14 |
| Yes (n=318) | 1.0 (reference) | 0.85 (0.39 to 1.89) | 1.38 (0.65 to 2.94) | 0.89 (0.39 to 2.03) | 0.99 | |
| β‐blockers | ||||||
| No (n=249) | 1.0 (reference) | 2.95 (1.16 to 7.50) | 2.62 (1.0 to 6.88) | 3.11 (1.17 to 8.26) | 0.07 | 0.09 |
| Yes (n=301) | 1.0 (reference) | 0.79 (0.36 to 1.77) | 0.91 (0.41 to 2.04) | 0.81 (0.35 to 1.88) | 0.70 | |
| Ejection fraction, % | ||||||
| <60 (n=261) | 1.0 (reference) | 0.91 (0.37 to 2.21) | 2.0 (0.85 to 4.66) | 1.34 (0.56 to 3.23) | 0.30 | 0.67 |
| ≥60 (n=289) | 1.0 (reference) | 1.01 (0.43 to 2.35) | 1.21 (0.51 to 2.87) | 1.31 (0.54 to 3.15) | 0.48 | |
| LA diameter, mm | ||||||
| <42 (n=162) | 1.0 (reference) | 3.34 (1.0 to 11.1) | 3.10 (0.85 to 10.7) | 2.67 (0.73 to 9.73) | 0.30 | 0.48 |
| ≥42 (n=210) | 1.0 (reference) | 0.89 (0.33 to 2.37) | 1.13 (0.42 to 3.04) | 1.92 (0.69 to 5.30) | 0.15 | |
| Change in total n‐3 PUFA concentrations | ||||||
| Country* | ||||||
| Italy (n=167) | 1.0 (reference) | 1.35 (0.50 to 3.62) | 1.12 (0.42 to 2.97) | 1.13 (0.43 to 2.99) | 0.96 | 0.99 |
| US (n=301) | 1.0 (reference) | 0.72 (0.33 to 1.57) | 0.52 (0.23 to 1.15) | 0.98 (0.47 to 2.08) | 0.81 | |
| Age, y | ||||||
| <64 (n=256) | 1.0 (reference) | 1.45 (0.59 to 3.56) | 1.06 (0.43 to 2.63) | 1.51 (0.62 to 3.65) | 0.51 | 0.62 |
| ≥64 (n=267) | 1.0 (reference) | 0.81 (0.38 to 1.74) | 1.17 (0.56 to 2.45) | 0.82 (0.39 to 1.75) | 0.74 | |
| Sex | ||||||
| Women (n=144) | 1.0 (reference) | 0.67 (0.20 to 2.27) | 1.03 (0.30 to 3.49) | 0.85 (0.26 to 2.86) | 0.99 | 0.98 |
| Men (n=379) | 1.0 (reference) | 0.84 (0.43 to 1.65) | 1.03 (0.54 to 1.98) | 0.94 (0.49 to 1.82) | 0.97 | |
| Statins | ||||||
| No (n=226) | 1.0 (reference) | 1.44 (0.55 to 3.74) | 1.13 (0.44 to 2.96) | 1.49 (0.59 to 3.74) | 0.53 | 0.64 |
| Yes (n=297) | 1.0 (reference) | 0.58 (0.26 to 1.30) | 0.92 (0.43 to 1.97) | 0.98 (0.46 to 2.11) | 0.56 | |
| β‐blockers | ||||||
| No (n=242) | 1.0 (reference) | 0.95 (0.39 to 2.29) | 1.03 (0.42 to 2.51) | 1.23 (0.52 to 2.93) | 0.55 | 0.66 |
| Yes (n=281) | 1.0 (reference) | 0.68 (0.30 to 1.52) | 0.74 (0.34 to 1.60) | 0.89 (0.42 to 1.91) | 0.94 | |
| Ejection fraction, % | ||||||
| <60 (n=246) | 1.0 (reference) | 0.52 (0.22 to 1.22) | 0.77 (0.34 to 1.76) | 0.64 (0.28 to 1.48) | 0.61 | 0.24 |
| ≥60 (n=277) | 1.0 (reference) | 1.39 (0.60 to 3.21) | 1.07 (0.46 to 2.52) | 1.58 (0.70 to 3.58) | 0.35 | |
| LA, mm | ||||||
| <42 (n=151) | 1.0 (reference) | 0.74 (0.22 to 2.51) | 0.65 (0.19 to 2.26) | 1.31 (0.40 to 4.27) | 0.44 | 0.63 |
| ≥42 (n=204) | 1.0 (reference) | 0.79 (0.32 to 1.97) | 0.97 (0.38 to 2.46) | 0.95 (0.38 to 2.36) | 0.93 | |
LA indicates left atrial; n‐3 PUFA, n‐3 polyunsaturated fatty acids.
Subjects were classified by stratum‐specific quartiles for each characteristic. Odds ratios were determined by logistic regression, adjusted for age (years), gender (male/female), country (US, Italy, Argentina), body mass index (kg/m2), prevalent hypertension (yes/no), prevalent diabetes (yes/no), prevalent coronary heart disease (yes/no), prevalent chronic renal failure (yes/no), prevalent heart failure (yes/no), smoking (never or former/current), dyslipidemia (yes/no), statin medication use (yes/no), ejection fraction (%), left –atrial diameter (tertiles), and logistic Euroscore (continuous). Corresponding factors were removed from the multivariable model when they were also the stratification variable.
Linear trend was tested by assigning to participants the median value in each quartile and assessing this as a continuous variable. Findings were similar when fatty acid concentrations were evaluated in their natural units as continuous exposures.
Interaction was tested by the Wald test for a multiplicative interaction term (assigning to participants the median value in each quartile of total n‐3 PUFA×stratifying variable).
Analyses were not conducted for subjects from Argentina due to small numbers (n=61). Subjects were grouped by country‐specific quartiles, and due to the distributional differences in n‐3 PUFA levels between Italy and the US, the odds ratios in this analysis are not directly comparable to the results in the overall analyses presented in Table 2.
Discussion
In this large study of cardiac surgery patients from the US, Italy, and Argentina, higher circulating levels of individual and total phospholipid n‐3 PUFA were not associated with risk of PoAF, whether assessed at baseline, as achieved levels following short‐term supplementation, or as achieved changes in levels. Notably, perioperative fish oil supplementation did produce significant increases in circulating n‐3 PUFA level, with the largest absolute increases in DHA and the largest relative increases in EPA. These findings suggest that neither higher habitual circulating levels of n‐3 PUFA, nor achieved levels or changes following short‐term supplementation, are associated with risk for PoAF.
PoAF share some common risk factors with non‐surgical AF, for example, age, hypertension, and congestive heart failure.20 These risk factors may each lead to atrial structural remodeling, providing a substrate that predisposes to AF.21 In addition, PoAF appears to be promoted by surgery‐related changes including inflammation, oxidative stress, and sympathetic activation.20 In animal experiments and human studies, n‐3 PUFA favorably affects several physiologic pathways including systemic and cardiac hemodynamics, myocardial metabolic efficiency, and atrial fibrosis.10,22–23 In addition, in 2 prior prospective cohort studies, circulating levels of habitual DHA and total n‐3 PUFA were inversely associated with long‐term risk of incident (new‐onset) AF among generally healthy ambulatory adults.24–25 These prior studies suggest that n‐3 PUFA may favorably influence risk for AF. Although habitual circulating n‐3 PUFA was not associated with PoAF in the current study, our data do not exclude the possibility that n‐3 PUFA may have benefits specific to long‐term risk factors for ambulatory AF.
Some of the beneficial cardiac effects of n‐3 PUFA may be dependent upon incorporation into cardiac membrane phospholipids, for example related to altered membrane fluidity, membrane protein function, and gene regulation.10 Interindividual variation in the extent of n‐3 PUFA incorporation into phospholipids following supplementation may therefore influence their potential antiarrhythmic properties. Consistent with prior studies in subjects with atherosclerosis,26 we observed large interindividual variability in the changes in n‐3 PUFA following fish oil supplementation. However, neither achieved nor changes in n‐3 PUFA levels were associated with PoAF. The changes in plasma phospholipid n‐3 PUFA in the current study are consistent with findings in other cardiac surgery populations.27–28 Yet, whereas changes in circulating phospholipid n‐3 PUFA correspond to myocardial membrane changes following at least 1 week of fish oil supplementation,27 the extent to which more short‐term supplementation, such as provided in OPERA, influences myocardial phospholipids is unknown. For example, it is possible that achieved changes in plasma phospholipid fatty acids are incompletely reflected in myocardial membrane phospholipids after 1 to 5 days, which might limit efficacy of perioperative fish oil supplementation for influencing risk of PoAF.
We observed nonsignificant trends for the differences in the association of n‐3 PUFA with PoAF depending on age and statin use. However, such exploratory subgroup results require confirmation in other studies and should be interpreted with caution, as these differences may likely be due to chance, especially given the multiple tests conducted in these exploratory analyses. Nevertheless, as limited prior studies suggested n‐3 PUFA supplementation on a background of statin therapy could lead to additional benefits such as reduction in triglycerides and oxidative stress,29–30 our results highlight the need for future studies to assess if the association of circulating n‐3 PUFA biomarkers with PoAF may be modified by certain demographic or clinical characteristics such as statin therapy.
Our analysis has several strengths. The prospective design reduced the likelihood of selection bias. We used a highly accurate and reproducible assay to assess plasma phospholipid n‐3 PUFA that reduced error and misclassification of these exposures, and allowed assessment of individual n‐3 PUFA. The detailed and careful adjudication of PoAF events by a centralized events committee lowered the likelihood of misclassified outcomes. We collected information on many well‐measured covariates to allow detailed adjustment to control for confounding. OPERA subjects were recruited from different countries with varied population characteristics (eg, differences in habitual fish intake), which increases generalizability.
Limitations should also be considered. Although we adjusted for major demographic, lifestyle, and clinical risk factors, it is possible that unmeasured or imprecisely measured factors could have caused residual confounding. The OPERA trial was powered to investigate the effect of perioperative fish oil treatment on the risk of PoAF, and not for the current nested n‐3 PUFA biomarker study. Additionally, although the current analysis represents by far the largest study using objective biomarkers of n‐3 PUFA in cardiac surgery patients, these measures were only available in a subset of OPERA subjects, reducing statistical power, and may narrow the generalizability of our findings. However, demographic characteristics of subjects with fatty acid data included in the current analysis were largely similar to other subjects in the OPERA trial, which suggests sample availability is unlikely to have substantially affected generalizability of our results. Only preoperative plasma n‐3 PUFA was available in our study, and we were not able to examine the potential relationship between PoAF and postoperative changes in n‐3 PUFA, which should be examined in future studies. Our findings are applicable to cardiac surgery patients and short‐term fish oil supplementation, and findings may differ in other populations at risk for AF or with longer‐term supplementation.
In summary, we found that baseline levels of circulating n‐3 PUFA were not associated with risk of PoAF in patients undergoing cardiac surgery. We also found considerable interindividual variation in responses to short‐term fish oil supplementation, but that neither achieved n‐3 PUFA levels nor changes in n‐3 PUFA levels were associated with PoAF.
Acknowledgment
We wish to thank Pho Q. Diep and Junitta B. Guzman for their technical support of the plasma fatty acids assay.
Sources of Funding
This work was supported by the National Heart, Lung, and Blood Institute, National Institutes of Health (1 RC2 HL101816).
Disclosures
Drs Mozaffarian and Marchioli report receiving funding from GlaxoSmithKline, Sigma Tau, Pronova, and the National Institutes of Health for the OPERA trial, an investigatorinitiated, not‐for‐profit, randomized clinical trial of fish oil supplements for the prevention of postsurgical complications. Dr. Mozaffarian reports ad hoc travel reimbursement or honoraria from Bunge, Pollock Institute, Quaker Oats, and Life Sciences Research Organization; ad hoc consulting fees from McKinsey Health Systems Institute, Foodminds, Nutrition Impact, Amarin, Omthera, and Winston and Strawn LLP; scientific advisory board membership for Unilever North America, and royalties from UpToDate.
References
- 1.Mitchell LB. Canadian Cardiovascular Society atrial fibrillation guidelines 2010: prevention and treatment of atrial fibrillation following cardiac surgery. Can J Cardiol. 2011; 27:91-97 [DOI] [PubMed] [Google Scholar]
- 2.Burgess DC, Kilborn MJ, Keech AC. Interventions for prevention of post‐operative atrial fibrillation and its complications after cardiac surgery: a meta‐analysis. Eur Heart J. 2006; 27:2846-2857 [DOI] [PubMed] [Google Scholar]
- 3.Hogue CW, Jr, Creswell LL, Gutterman DD, Fleisher LA. Epidemiology, mechanisms, and risks: American College of Chest Physicians guidelines for the prevention and management of postoperative atrial fibrillation after cardiac surgery. Chest. 2005; 128:9S-16S [DOI] [PubMed] [Google Scholar]
- 4.Mayyas F, Sakurai S, Ram R, Rennison JH, Hwang ES, Castel L, Lovano B, Brennan ML, Bibus D, Lands B, Barnard J, Chung MK, Van Wagoner DR. Dietary omega3 fatty acids modulate the substrate for post‐operative atrial fibrillation in a canine cardiac surgery model. Cardiovasc Res. 2011; 89:852-861 [DOI] [PMC free article] [PubMed] [Google Scholar]
- 5.Ramadeen A, Laurent G, dos Santos CC, Hu X, Connelly KA, Holub BJ, Mangat I, Dorian P. n‐3 Polyunsaturated fatty acids alter expression of fibrotic and hypertrophic genes in a dog model of atrial cardiomyopathy. Heart Rhythm. 2010; 7:520-528 [DOI] [PubMed] [Google Scholar]
- 6.Kitamura K, Shibata R, Tsuji Y, Shimano M, Inden Y, Murohara T. Eicosapentaenoic acid prevents atrial fibrillation associated with heart failure in a rabbit model. Am J Physiol Heart Circ Physiol. 2011; 300:H1814-H1821 [DOI] [PubMed] [Google Scholar]
- 7.Mozaffarian D, Marchioli R, Macchia A, Silletta MG, Ferrazzi P, Gardner TJ, Latini R, Libby P, Lombardi F, O'Gara PT, Page RL, Tavazzi L, Tognoni G. Fish oil and postoperative atrial fibrillation: the Omega‐3 Fatty Acids for Prevention of Post‐operative Atrial Fibrillation (OPERA) randomized trial. JAMA. 2012; 308:2001-2011 [DOI] [PMC free article] [PubMed] [Google Scholar]
- 8.Mozaffarian D, Wu JH, de Oliveira Otto MC, Sandesara CM, Metcalf RG, Latini R, Libby P, Lombardi F, O'Gara PT, Page RL, Silletta MG, Tavazzi L, Marchioli R. Fish oil and post‐operative atrial fibrillation: a meta‐analysis of randomized controlled trials. J Am Coll Cardiol. 2013; 61:2194-2196 [DOI] [PMC free article] [PubMed] [Google Scholar]
- 9.Mariani J, Doval HC, Nul D, Varini S, Grancelli H, Ferrante D, Tognoni G, Macchia A. N‐3 polyunsaturated fatty acids to prevent atrial fibrillation: updated systematic review and meta‐analysis of randomized controlled trials. J Am Heart Assoc. 2013; 2:e005033. [DOI] [PMC free article] [PubMed] [Google Scholar]
- 10.Mozaffarian D, Wu JH. Omega‐3 fatty acids and cardiovascular disease: effects on risk factors, molecular pathways, and clinical events. J Am Coll Cardiol. 2011; 58:2047-2067 [DOI] [PubMed] [Google Scholar]
- 11.McLennan PL. Myocardial membrane fatty acids and the antiarrhythmic actions of dietary fish oil in animal models. Lipids. 2001; 36suppl:S111-S114 [DOI] [PubMed] [Google Scholar]
- 12.Li GR, Sun HY, Zhang XH, Cheng LC, Chiu SW, Tse HF, Lau CP. Omega‐3 polyunsaturated fatty acids inhibit transient outward and ultra‐rapid delayed rectifier K+currents and Na+current in human atrial myocytes. Cardiovasc Res. 2009; 81:286-293 [DOI] [PubMed] [Google Scholar]
- 13.Mozaffarian D, Wu JH. (n‐3) fatty acids and cardiovascular health: are effects of EPA and DHA shared or complementary? J Nutr. 2012; 142:614S-625S [DOI] [PMC free article] [PubMed] [Google Scholar]
- 14.Mozaffarian D, Marchioli R, Gardner T, Ferrazzi P, O'Gara P, Latini R, Libby P, Lombardi F, Macchia A, Page R, Santini M, Tavazzi L, Tognoni G. The omega‐3 fatty acids for prevention of post‐operative atrial fibrillation trial: rationale and design. Am Heart J. 2011; 162:56.e3-63.e3 [DOI] [PMC free article] [PubMed] [Google Scholar]
- 15.Folch J, Lees M, Sloane Stanley GH. A simple method for the isolation and purification of total lipids from animal tissues. J Biol Chem. 1957; 226:497-509 [PubMed] [Google Scholar]
- 16.Lepage G, Roy CC. Direct transesterification of all classes of lipids in a one‐step reaction. J Lipid Res. 1986; 27:114-120 [PubMed] [Google Scholar]
- 17.Feskanich D, Rimm EB, Giovannucci EL, Colditz GA, Stampfer MJ, Litin LB, Willett WC. Reproducibility and validity of food intake measurements from a semiquantitative food frequency questionnaire. J Am Diet Assoc. 1993; 93:790-796 [DOI] [PubMed] [Google Scholar]
- 18.Pisani P, Faggiano F, Krogh V, Palli D, Vineis P, Berrino F. Relative validity and reproducibility of a food frequency dietary questionnaire for use in the Italian EPIC centres. Int J Epidemiol. 1997; 26suppl 1:S152-S160 [DOI] [PubMed] [Google Scholar]
- 19.Roques F, Michel P, Goldstone AR, Nashef SA. The logistic EuroSCORE. Eur Heart J. 2003; 24:881-882 [DOI] [PubMed] [Google Scholar]
- 20.Maesen B, Nijs J, Maessen J, Allessie M, Schotten U. Post‐operative atrial fibrillation: a maze of mechanisms. Europace. 2012; 14:159-174 [DOI] [PMC free article] [PubMed] [Google Scholar]
- 21.Nattel S, Burstein B, Dobrev D. Atrial remodeling and atrial fibrillation: mechanisms and implications. Circ Arrhythm Electrophysiol. 2008; 1:62-73 [DOI] [PubMed] [Google Scholar]
- 22.Ramadeen A, Dorian P. How are n‐3 LCPUFAS antiarrhythmic? A reassessment of n‐3 LCPUFAs in cardiac disease. Cardiol Res Pract. 2012; 2012:746709. [DOI] [PMC free article] [PubMed] [Google Scholar]
- 23.Ramadeen A, Connelly KA, Leong‐Poi H, Hu X, Fujii H, Laurent G, Domenichiello AF, Bazinet RP, Dorian P. Docosahexaenoic acid, but not eicosapentaenoic acid, supplementation reduces vulnerability to atrial fibrillation. Circ Arrhythm Electrophysiol. 2012; 5:978-983 [DOI] [PubMed] [Google Scholar]
- 24.Virtanen JK, Mursu J, Voutilainen S, Tuomainen TP. Serum long‐chain n‐3 polyunsaturated fatty acids and risk of hospital diagnosis of atrial fibrillation in men. Circulation. 2009; 120:2315-2321 [DOI] [PubMed] [Google Scholar]
- 25.Wu JH, Lemaitre RN, King IB, Song X, Sacks FM, Rimm EB, Heckbert SR, Siscovick DS, Mozaffarian D. Association of plasma phospholipid long‐chain omega‐3 fatty acids with incident atrial fibrillation in older adults: the cardiovascular health study. Circulation. 2012; 125:1084-1093 [DOI] [PMC free article] [PubMed] [Google Scholar]
- 26.Kohler A, Bittner D, Low A, von Schacky C. Effects of a convenience drink fortified with n‐3 fatty acids on the n‐3 index. Br J Nutr. 2010; 104:729-736 [DOI] [PubMed] [Google Scholar]
- 27.Metcalf RG, James MJ, Gibson RA, Edwards JR, Stubberfield J, Stuklis R, Roberts‐Thomson K, Young GD, Cleland LG. Effects of fish‐oil supplementation on myocardial fatty acids in humans. Am J Clin Nutr. 2007; 85:1222-1228 [DOI] [PubMed] [Google Scholar]
- 28.Heidarsdottir R, Arnar DO, Skuladottir GV, Torfason B, Edvardsson V, Gottskalksson G, Palsson R, Indridason OS. Does treatment with n‐3 polyunsaturated fatty acids prevent atrial fibrillation after open heart surgery? Europace. 2010; 12:356-363 [DOI] [PubMed] [Google Scholar]
- 29.Ballantyne CM, Bays HE, Kastelein JJ, Stein E, Isaacsohn JL, Braeckman RA, Soni PN. Efficacy and safety of eicosapentaenoic acid ethyl ester (AMR101) therapy in statin‐treated patients with persistent high triglycerides (from the ANCHOR study). Am J Cardiol. 2012; 110:984-992 [DOI] [PubMed] [Google Scholar]
- 30.Takaki A, Umemoto S, Ono K, Seki K, Ryoke T, Fujii A, Itagaki T, Harada M, Tanaka M, Yonezawa T, Ogawa H, Matsuzaki M. Add‐on therapy of EPA reduces oxidative stress and inhibits the progression of aortic stiffness in patients with coronary artery disease and statin therapy: a randomized controlled study. J Atheroscler Thromb. 2011; 18:857-866 [DOI] [PubMed] [Google Scholar]