

Abstract
Background
Reciprocal relationships between endothelial dysfunction and insulin resistance result in a vicious cycle of cardiovascular, renal, and metabolic disorders. The mechanisms underlying these impairments are unclear. The peptide hormones prokineticins exert their angiogenic function via prokineticin receptor‐1 (PKR1). We explored the extent to which endothelial PKR1 contributes to expansion of capillary network and the transcapillary passage of insulin into the heart, kidney, and adipose tissues, regulating organ functions and metabolism in a specific mice model.
Methods and Results
By combining cellular studies and studies in endothelium‐specific loss‐of‐function mouse model (ec‐PKR1−/−), we showed that a genetically induced PKR1 loss in the endothelial cells causes the impaired capillary formation and transendothelial insulin delivery, leading to insulin resistance and cardiovascular and renal disorders. Impaired insulin delivery in endothelial cells accompanied with defective expression and activation of endothelial nitric oxide synthase in the ec‐PKR1−/− aorta, consequently diminishing endothelium‐dependent relaxation. Despite having a lean body phenotype, ec‐PKR1−/− mice exhibited polyphagia, polydipsia, polyurinemia, and hyperinsulinemia, which are reminiscent of human lipodystrophy. High plasma free fatty acid levels and low leptin levels further contribute to the development of insulin resistance at the later age. Peripheral insulin resistance and ectopic lipid accumulation in mutant skeletal muscle, heart, and kidneys were accompanied by impaired insulin‐mediated Akt signaling in these organs. The ec‐PKR1−/− mice displayed myocardial fibrosis, low levels of capillary formation, and high rates of apoptosis, leading to diastolic dysfunction. Compact fibrotic glomeruli and high levels of phosphate excretion were found in mutant kidneys. PKR1 restoration in ec‐PKR1−/− mice reversed the decrease in capillary recruitment and insulin uptake and improved heart and kidney function and insulin resistance.
Conclusions
We show a novel role for endothelial PKR1 signaling in cardiac, renal, and metabolic functions by regulating transendothelial insulin uptake and endothelial cell proliferation. Targeting endothelial PKR1 may serve as a therapeutic strategy for ameliorating these disorders.
Keywords: cardiovascular disease, endothelial dysfunction, GPCR, insulin resistance, prokineticin, renal function
Introduction
Endothelial dysfunction is a hallmark of cardiovascular disorders characterized by inadequate vasodilatation and/or paradoxical vasoconstriction of the coronary and peripheral arteries.1 Endothelial dysfunction also contributes to the impairment of insulin function by altering the transcapillary passage of insulin to target tissues.2 Lower levels of capillary network expansion, with an attenuation of microcirculatory blood flow to metabolically active tissues, contribute to the impairment of insulin‐stimulated glucose and lipid metabolism.3 Therapeutic interventions improving endothelial function have been shown to decrease metabolic and cardiovascular abnormalities in animal4 and clinical investigations.5 The identification of endothelial factors linking cardiovascular and metabolic disorders is therefore important to understand the pathogenesis of metabolic syndrome.
Prokineticins are potent angiogenic factors. Prokineticins 1 and 2 are widely distributed in mammalian tissues6 and human blood cells.7 They act as survival/mitogenic factors in various cell types, including endothelial cells (ECs),8 neuronal cells,9 lymphocytes, hematopoietic stem cells,10 and cardiomyocytes.11 They exert their biological effects by stimulating 2 closely related receptors, prokineticin receptor‐1 (PKR1) and PKR2.12–13 Both receptors use several G protein–signaling pathways and are ubiquitously expressed in mammalian tissues.12–14 A different role of prokineticin‐2 has recently been described in ECs: the activation of PKR1 signaling promotes angiogenesis, and the activation of PKR2 induces fenestration in cardiac ECs.15 Moreover, the 2 receptors may have different expression profiles. For example, human aortic ECs express only PKR1, and human hepatic sinusoidal ECs express only PKR2. However, the extents to which endothelial prokineticin signals affect heart, kidney, and adipose functions and the contribution of angiogenesis and insulin uptake to particular diseases have yet to be investigated.
The objectives of the present study were to determine the role of the endothelial PKR1 in cardiovascular, renal, and metabolic hemostasis with particular emphasis on endothelial proliferation as a first step of angiogenesis and transcapillary insulin transport. We generated a vascular EC‐specific PKR1 knockout mouse (ec‐PKR1−/−) with the Cre‐loxP system and demonstrated how PKR1 loss leads metabolic, cardiovascular, and renal disorders. Our data support the emerging concepts that the endothelium is a useful potential target for treatments to combat insulin resistance, diabetes, and cardiovascular diseases.
Methods
Generation of ec‐PKR1−/−
The ec‐PKR1−/− were generated using the Cre‐loxP system. Mice harboring a PKR1 gene flanked by loxP sites (PKR1lox/lox) were bred with transgenic mice expressing the Cre recombinase under control of the tie2 promoter‐enhancer. The latter mice (B6.Cg‐TgTie2‐Cre 12F1v/J) were purchased from the Jackson Laboratories. Earlier studies on tie2‐cre transgenic mice have shown that tie2 expression is limited to vascular ECs and endocardial cushions.16 Note that PKR1 is not expressed in the endocardial cushions.11 As a result of this breeding, all mice in these experiments have a C57Bl/6 genetic background. PKR1lox/lox mice, in which exon 2 of the PKR1 gene is flanked by loxP sites, have been previously described.17 In the progeny of this cross, all mice have a tie2‐Cre:PKR1lox/WT genotype. The resulting mice were bred with PKR1lox/lox mice to generate tie2‐Cre:PKR1lox/lox mice (named, for the sake of simplicity, ec‐PKR1−/− as they harbor a homozygous deletion of PKR1 in ECs). Littermates from the same breeding pairs PKR1lox/lox mice without tie2‐Cre transgene (L2/L2) were used as controls. Animals were housed on a 12‐hour light/dark cycle and were fed a standard rodent chow. Note that the life span of the mutant mice was reduced by 11%. All protocols for animal use, surgery, and euthanasia were reviewed and approved by the French Animal Care Committee and were in accordance with European guidelines. All experiments were carried out in male mice (≈150 mice) at the different ages (6, 12, 24, and 36 weeks).
Isolation and Culture of ECs
ECs were isolated by using a magnetic labeling procedure using Dynabeads (Invitrogen) and a biotinylated antibody against an EC surface antigen (the vascular endothelial growth factor receptor FLK1; eBioscience), as described in the manufacturer's protocol.18 Mouse aorta, heart, kidney, and adipose tissues were removed from control and ec‐PKR1−/− mice, cut into pieces (≈1 mm3) in buffer ([in mmol/L] NaCl 116, KCl 0.8, NaH2PO4 1, glucose 5.5, HEPES 20) containing 0.5 mg/mL collagenase type V and 1 mg/mL pancreatinine and incubated for 45 minutes at 37°C. After digestion, ECs were labeled with the Flk1 antibody and separated from the remainder of the cells and debris through capture with magnetic beads. ECs were then cultured in DMEM Glutamax (Invitrogen) containing 4.5 g/L glucose and 20% fetal calf serum, nonessential amino acids, 2 mmol/L glutamine, 10 μg/mL heparin, 100 μg/mL endothelial cell growth supplements (ECGS) (Tebu‐Bio). EC identity was confirmed by positive staining with a platelet‐endothelial cell adhesion molecule (PECAM‐1) antibody (Santa Cruz Biotechnology). Primary mouse cardiac glomerular ECs were also purchased from Cellbiologics Inc and used up for to 3 passages. Bone marrow cells were isolated from mice pelvic and femoral bones as described (www.bi‐protocol.org).
Cell proliferation and in vitro angiogenesis assays were performed as previously described.15 Insulin uptake in ECs in vitro19 and vivo20 was performed as described. ECs were incubated with serum‐free medium for 6 hour at 37°C, followed by incubation with 100 nm/L FITC‐insulin (Invitrogen) for the indicated time period (0 to 30 minutes) at 37°C. Next, the cells were fixed in methanol at −20°C for 10 minutes, and blocking of antigenic sites was performed with PBS containing 10% donkey serum and 0.5% Triton X‐100 for 1 hour at room temperature. Cells were incubated with the primary antibody (rabbit polyclonal anti‐FITC, 1:100 dilution; Invitrogen) overnight at 4°C, and with a secondary Alexa488‐conjugated antibody for 1 hour at room temperature.19 Cells were washed and mounted with Vectashield (Vector laboratories) containing DAPI and then analyzed by fluorescence microscopy. Fluorescence intensity of individual cells reflecting FITC insulin uptake was quantified using the National Institutes of Health ImageJ 1.37v software. At least 10 cells in 5 high‐power microscopy fields (×40) were analyzed for each time point (0 to 30 minutes). For in vivo insulin uptake analysis, 100 mU/kg body weight FITC‐insulin was injected intravenously. Mice were killed 10 minutes thereafter, and their tissues were collected and cryoconserved. For the time zero point, after non–FITC‐labeled insulin injection, the mice were immediately killed and and their tissues were collected and cryoconserved. Immunostaining for FITC and PECAM‐1 was performed on sectioned tissues. Images were acquired at a resolution of 1024×1024 pixels and stored in 24‐bit tagged image format file format. Fluorescence intensity of individual blood vessels reflecting FITC‐insulin uptake was quantified using ImageJ software. At least 5 blood vessels in 5 high‐power microscopy fields (×40) were analyzed.
Histological and Electron Microscopy Analyses
For histology, organs were removed from 3‐, 12‐, or 24‐week‐old mice, dissected, and frozen for cryosectioning (5 μm), and the sections were stained with Mallory tetrachrome. For electron microscopy, all organs were fixed by immersion in glutaraldehyde, postfixed by incubation in osmium tetroxide, and embedded in epoxy resin, using routine methods.11,21 Glomerular pathology analyses were based on the assessment of 50 glomeruli analyzed on kidney cross sections. Tubule damages (consisting of at least one of the following: dilatation, atrophy, necrosis) were assessed by scoring 100 proximal tubules on kidney cross sections on randomly chosen high‐power microscopy fields (×40).
Echocardiography and Blood Pressure Assessment
Systolic function in 12‐ and 24‐week‐old male mice (n=6 for each group) was assessed by echocardiography in M‐mode (Sonos 5500, Hewlett‐Packard, with a 15‐MHz linear transducer) and 2‐dimensional measurements.21 We calculated mean measurements for 6 selected cardiac cycles from at least 2 independent scans performed in a randomized blind fashion, with papillary muscles used as a point of reference to ensure that all scans were carried out at the same level. Mean systolic blood pressureand heart rate were obtained from tail cuff measurements on 24‐week‐old mice by using the Visitech System (Physiological Research Instruments).
Terminal Deoxynucleotidyl Transferase dUTP Nick End Labeling Assay and Immunohistochemistry
Terminal deoxynucleotidyl transferase dUTP nick end labeling (TUNEL) assays were performed with an in situ cell death detection kit (Roche), according to the manufacturer's instructions.11 We acquired 6 to 10 images per sections (at least 10 sections) in organ (3 animals per genotype group, n=3) with use of a fluorescence microscope. The TUNEL labeling index was calculated as the mean number of DAPI‐stained TUNEL‐positive (i.e., it is the percentage of TUNEL‐positive cells among total [DAPI‐labeled] cells) nuclei/glomerulus, for 50 glomeruli per kidney (n=3), or of DAPI‐stained TUNEL‐positive nuclei in 10 high‐power microscopic fields (×40) per heart, adipose tissue, or pancreatic sections (n=3), for the various groups of mice. For immunofluorescence staining of structural proteins, frozen tissue sections were fixed with 3.7% formaldehyde for 10 minutes, blocked, and stained with primary antibodies against PECAM‐1 (Santa Cruz), α–smooth muscle actin (α‐SMA) (Sigma), PKR1 (monoclonal antibody raised at Institut de Génétique et de Biologie Moléculaire et Cellulaire, Illkirch, France), PKR2 (Abcam), zona occludens‐1 (Invitrogen), collagen IV (Abcam), CD68 (Serotec), Insulin (Santa Cruz), and caveolin‐1 (Cav‐1; Santa Cruz). Antibody binding was detected by incubation with fluorescein‐, Alexa555‐, Alexa488‐, and Alexa594‐conjugated secondary antibodies. Finally, the nuclei were stained with DAPI. Fluorescence was analyzed on a Leica fluorescence microscopy.11,21 We determined the number of PECAM‐1–positive, DAPI‐stained cells per heart, pancreas, kidney, adipose tissue, muscle, and liver by systematically counting 6 to 10 microscopy fields on 10 sections per organ analyzed (3 mice per genotype). For staining the tissue section for Oil Red O, cryosections (5 μm) were fixed in 10% formalin for 30 minutes, and then washed in distilled water and stained with 0.5% Oil Red O in isopropanol (Sigma Aldrich) for 30 minutes to identify neutral lipids, cholesterol, and fatty acids (red color). Slides were then covered in aqueous mount under a coverslip. Images from the stained slides of mice were initially acquired using a 24‐bit file format. ImageJ 1.37v software (NIH) was used to convert bright‐field (24‐bit) images of Oil Red O staining to 8‐bit images. Threshold values were chosen that maximize selection of the Oil Red O–positive tissue while minimizing background interference. Thus, the total number of lipid drops from each image (percentage) was quantified in the at least 20 random fields from each samples.
RNA Extraction, Quantification, and RT‐PCR Analysis
Total RNA was isolated from adult mouse organs with TRIReagent (Molecular Research Center) and treated with DNase, using the RNase‐Free DNase Set (Fermentas), as previously described.21 The GAPDH and β‐actin housekeeping genes were used as internal controls.21–22 All primer sequences are given in Table 1. Results were analyzed with use of Bio‐Rad qPCR software, version 2.0. Primer sequences are shown in Table 1.
Table 1.
Primers
| Genes | Forward Primer (5′→3′) | Reverse Primer (5′→3′) |
|---|---|---|
| L2/L2 | GACTGGACATCTAGTGGTAGTCAGG | GGGTGTGAGGTGGGATTAAGTCAC |
| Tie‐2 | ATTCTCGTGGAACTGGATGG | GGACAGGTAATGGTTGTCTGG |
| PPAR α | ACGATGCTGTCCTCCTTGATG | GTGTGATAAAGCCATTGCCGT |
| PPAR γ | CGAGAAGGAGAAGCTGTTGG | GAAACTGGCACCCTTGAAAA |
| C/EBPα | CAAGAACAGCAACGAGTACCG | GTCACTGGTCAACTCCAGCAC |
| HIF 1α | TACAAGGCAGCAGAAACCTAC | TGTGCAATTGTGGCTACC |
| VEGF | CTTCCTACAGCACAGCAGATGTGAA | TGGTGACATGGTTAATCGGTCTTTC |
| Col 1a1 | GCCAAGAAGACATCCCTGAAG | TGTGGCAGATACAGATCAAGC |
| Col 1a2 | CACCCCAGCGAAGAACTCATA | GCCACCATTGATAGTCTCTCC |
| Col 3a1 | TTTGTGCAAAGTGGAACCTG | TGGACTGCTGTGCCAAAATA |
| LOX | CCACAGCATGGACGAATTCA | AGCTTGCTTTGTGGCCTTCA |
| meNOS | TACGCACCCAGAGCTTTTCT | GAACTGGAGGGGAGGAAGAC |
| Arg 1 | CAGAAGAATGGAAGAGTCAG | CAGATATGCAGGGAGTCACC |
| Arg 2 | TGATTGGCAAAAGGCAGAGG | CTAGGAGTAGGAAGGTGGTC |
| Gata 4 | TCTCACTATGGGCACAGCAG | GCGATGTCTGAGTGACAGGA |
| ANF | CCTGTGTACAGTGCGGTGTC | CCTGCTTCCTCAGTCTGCTC |
| α MHC | GAGATTTCTCCAACCCAG | TCTGACTTTCGGAGGTACT |
| β MHC | CTACAGGCCTGGGCTTACCT | TCTCCTTCTCAGACTTCCGC |
| FATP 1 | GGCTCCTGGAGCAGGAACA | ACGGAAGTCCCAGAAACCAA |
| FATP 4 | GGCTTCCCTGGTGTACTATGGAT | ACGATGTTTCCTGCTGAGTGGTA |
| Fabp 4 | CAGAAGTGGGATGGAAAGTCG | CGACTGACTATTGTAGTGTTTGA |
| IRS1 | AGCCCAAAAGCCCAGGAGAATA | TTCCGAGCCAGTCTCTTCTCTA |
| IR | ATGAGGCCAACCTTCCTGGAA | ACGGGACATTCTCCATGTCT |
| Flk‐1 | GATCACCATTCATCGCCTCT | AAACATCTTCGCCACAGTCC |
| NCX‐1 | TGAGAGGGACCAAGATGATGAGGAA | TGACCCAAGACAAGCAATTGAAGAA |
| Nephrin | GACCGGGACACAAGAAGCTC | GATGTCCCCTCAGCTCGAAG |
| NaPi II a | AGACACAACAGAGGCTTC | CACAAGGAGGATAAGACAAG |
| TGF β | CTAATGGTGGACCGCAACAAC | CGGTTCATGTCATGGATGGTG |
| β actin | CATCTTGGCCTCACTGTCCA | GGGCCGGACTCATCGTACT |
| GAPDH | TGAGGCCGGTGCTGAGTATGTCG | CCACAGTCTTCTGGGTGGCAGTG |
| Cav‐1 | CTCGAGATGTCTGGGGGCAAATACG | GAATTCTATCTCTTTCTGCGTGCTG |
Biochemical Analyses on Blood and Urine Samples
Blood samples and urine samples were collected and analyzed as outlined on the Institute of Mouse Clinic (ICS) website (http://www.ics-mci.fr/).
Contractility of Isolated Aortic Rings
Aortic segments dissected free of fat were mounted on a wire‐myograph (DMT) as previously described.23 Briefly, wires were inserted into the lumen of the arteries and fixed to a force transducer and a micrometer. Arteries were bathed in a physiological salt solution (PSS) of the following composition (in mmol/L): CaCl2 1.8, KCl 2.7, MgCl2 0.5, NaCl 136.9, NaHCO3 11.9, NaH2PO41.2, d‐glucose 5.5, and HEPES 10. The pH of the solution was 7.4. The isometric tension was recorded using a force–displacement transducer so that isometric force measurements could be performed (Biopac) and recorded using the Acknowledge data acquisition and analysis software (Biopac). The aortic rings were allowed to equilibrate for 30 minutes, during which time the bathing PSS solution was replaced at 15 minutes intervals. Subsequently, 10 mN tension was applied to each ring (representing the optimum stretch in this preparation)23 and allowed to equilibrate for an additional 1 hour (with PSS solution replaced at 15 minutes intervals). After equilibration, to test the contractile response of the tissue, each ring was exposed to 125 mmol/L KCl. Cumulative concentration–response curves were then obtained for the responses to 0.01 to 10 μmol/L phenylephrine, 0.01 to 10 μmol/L acetylcholine (after preconstriction with phenylephrine to 50% of the maximum determined from the phenylephrine concentration–response curves).24
Insulin Stimulation of Akt Activity and Nitric Oxide Synthetase Activity Detected by Western Blot Assay
Animals were anesthetized with 1% pentobarbital, followed by an intraperitoneal (i.p.) injection of insulin (150 mU/g, Umaline Rapide). Ten minutes after injection, mice were killed and tissues were harvested for protein extraction. Tissue samples were homogenized in lysis buffer composed of 50 mmol/L Tris‐HCl, pH 6.8, 1 mmol/L EDTA, pH 8.0, 1% NP‐40, 1 mmol/L NA3VO4, 0.1% SDS, 100 mmol/L NaCl, and phosphatase and protease inhibitors. Homogenized samples were incubated under agitation for 1 hour at 4°C, then centrifuged at 13 000 rpm at 4°C to obtain protein extracts. The protein concentration was measured by use of BCA assay (Thermo Scientifc) as described in the manufacturer's instructions. Approximately 100 μg of protein for each sample was separated by 12% SDS‐PAGE, transferred to a PVDF membrane, and incubated with anti–phospho‐Akt Ser473 (Cell Signaling; 1:1000 dilution), anti–phospho‐Akt Thr308 (Santa Cruz; 1:1000 dilution), or anti‐Akt antibody (Cell Signaling; 1:1000 dilution).
To investigate insulin‐mediated NOS activity, ECs from control and mutant mice were incubated with insulin (10 nmol/L) for 5 minutes.25 Then, the lysed cell samples were subjected to Western blot analysis using phospho–endothelial nitric oxide synthesis (eNOS) (Ser1177) and eNOS antibodies (Cell Signaling). Samples were treated with peroxidase‐conjugated secondary antibody (Santa‐Cruz; 1:5000 dilution), and immunoreactivity was detected by using the ECL chemiluminescent detection kit according to the manufacturer's specifications (Amersham Pharmacia). The intensity of the resulting bands was quantified by use of ImageJ software.
Intraperitoneal Insulin Tolerance Test and Intraperitoneal Glucose Tolerance Test
At 12, 24, and 36 weeks of age, the mice underwent an intraperitoneal insulin tolerance test (ITT) after a 4‐hour fast or an intraperitoneal glucose tolerance test (GTT) without fasting. insulin (Umuline Rapide [Lilly, France], 0.75 unit/kg body weight), or glucose (1 mg/g body weight) in normal saline (0.9% NaCl) was administered intraperitoneally. Blood samples were taken from the tail vein at 0, 15, 30, 60, 90, and 120 minutes after loading, and plasma glucose levels were measured using a Countour TS glucometer (Bayer). For measurement of the plasma insulin levels, 4 hour after fasting, 2 mg/g glucose was administered intraperitoneally. Blood samples were taken at 0 and 15 minutes for measurement of plasma glucose and insulin levels.26 Plasma glucose levels were measured using the glucose oxidation method, and insulin levels using an ELISA kit, as standardly performed and outlined on the MCI website (http://www.ics-mci.fr/test_glucose_tolerance.html).
Adenovirus Preparation and Injection
Adenovirus encoding PKR1 were generated as described previusly.11 Briefly 107 pfu/μL PKR1 or control adenovirus (nonrecombinant) was injected 2 times at a 1‐week interval via the tail vein of control and mutant mice. All the experiments were performed 2 to 3 weeks after the infections.
PKR1 and Cav‐1 Knockdown
Knockdown of PKR111 and Cav‐127 uing small interfering RNA (siRNA) was performed on the ECs as described prreviously. The oligonucleotide pairs of Cav‐1 siRNA‐1, siRNA‐2, and siRNA‐3 were used, and the sequences of the sense strands of Cav‐1 siRNA‐1, siRNA‐2, and siRNA‐3 are 5′‐CCAUCAAUUUGGAGACUAUtt‐3′, 5′‐CCACUCAGCAACUGAAUGAtt‐3′, and 5′‐GUACCUGAGUCUCCAGAAAtt‐3′, respectively. To check for specificity, negative control siRNAs was used: 5′‐ACGACTAGCCTGAACTCAA‐3′. ECs were incubated in a 6‐well tissue culture dishes without antibiotics and 24 hours before transfection, resulting in a 60% to 80% confluency. Control siRNAs and specific Cav‐1 siRNAs (100 nmol/L) were mixed with Lipofectamine TM2000 (Invitrogen) according to manufacturer's recommendation and added to the cells, respectively. After 6 hours at 37°C, the medium was changed, and the cells were cultivated in DMSO containing 10% FCS for 72 hours.
Statistical Analysis
Data are expressed as mean±SEM. Statistical comparisons for all experiments were performed using Mann–Whitney (for 2 groups) and Kruskal–Wallis (for >2 groups) tests. Exceptionally, statistical comparisons for Oil red O staining of mouse tissues and CD68 staining of macrophages, PECAM‐1 and α‐SMA staining of vessels, TUNEL staining of mouse tissues, and insulin staining of pancreas were performed using the unpaired Student's t test and ANOVA. P<0.05 was considered statistically significant for all tests.
Results
Inactivation of the PKR1 Gene by tie2‐cre–Mediated Deletion Leads to PKR1 Loss in ECs
The genotype of each mouse was confirmed with PCR on tail biopsy samples (Figure 1A). Primer sequences are given in Table 1. The ec‐PKR1−/− mice harbor the tie2‐Cre transgene and are homozygous for the PKR1 floxed allele (PKR1lox/lox). Control mice are tie2‐Cre negative and they are PKR1lox/+. The endothelium‐specific ablation of PKR1 were checked in ec‐PKR1 mice, by carrying out double fluorescence staining for the endothelial marker protein PECAM‐1 (red) and PKR1 (green) in the aorta and primary aortic ECs. PKR1 protein was detected in control (L2/L2+/+) mouse aorta (Figure 1B, upper panel) and ECs (Figure 1B, lower panel) but not in ec‐PKR1−/− mouse aorta and ECs. It has been argued that the tie2‐promoter might be also active in in bone marrow–derived cells, monocytes, and neutrophils,28–29 but we ruled out this possibility by showing normal PKR1 protein levels (Figure 1C) as well as normal PKR1 transcript (Figure 1D, right panel) in BM isolated from ec‐PKR1−/− mice and mRNA expression in peripheral blood cells of ec‐PKR1−/− mice (Figure 1D, left panel). PKR1 loss did not alter the expression of PKR2 in the glomerular ECs (Figure 1E and 1F). Note that PKR2 is not expressed in the aortic ECs. Taken together, we conclude that ec‐PKR1−/− mice lack PKR1 specifically in ECs.
Figure 1.
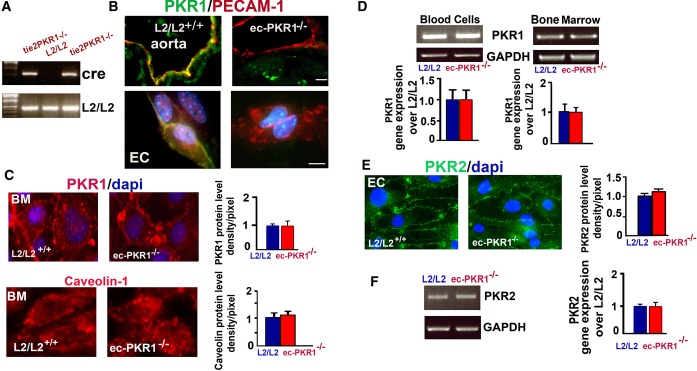
Generation of endothelium‐specific PKR1 loss in mice. A, Representative genotype analysis of ec‐PKR1−/− mice. Genomic DNA was amplified with oligonucleotide primers detecting tie2‐Cre and PKR1lox/lox alleles. The ec‐PKR1−/− mice harbor the tie2‐Cre transgene and are homozygous for the PKR1 floxed allele (PKR1lox/lox). Control mice are tie2‐Cre negative and they are PKR1lox/+. B, Double staining for PKR1 and PECAM‐1 in the aorta and isolated aorta ECs (lower panel), showing the loss of PKR1 exclusively from ec‐PKR1−/− aortas and ECs. C, Immunostaining analyses for PKR1 antibody revealed that PKR1 protein levels were not altered in bone marrow (BM) derived from ec‐PKR1−/− mice. Caveolin‐1 levels remained unaltered in ec‐PKR1−/− BM. D, Blood cells and BM derived from L2/L2 and ec‐PKR1−/− mice expressed the same level of PKR1 mRNA detected by RT‐PCR (illustration) and quantitative PCR (qPCR) (histogram). E, PKR2 immunostaining of ECs, as well as F, RT‐PCR (illustration) and qPCR (histogram) analyses on RNA derived from ECs, revealed that the protein and transcript levels of PKR2 remained unaltered in ECs of ec‐PKR1−/− mice (P>0.05). DAPI indicates 4',6‐diamidino‐2‐phenylindole, a marker of nucleus; EC, endothelial cell; ec‐PKR1−/−, endothelium‐specific PKR1 knockout mice; L2/L2, PKR1+/+; PECAM‐1, platelet–endothelial cell adhesion molecule 1; PKR, prokineticin receptor.
EC‐Specific PKR1 Ablation Triggers Defects in Endothelial Relaxation, Proliferation, and Capillary Formation
The ec‐PKR1−/− mouse aortas displayed abundant microaneurysms and high levels of macrophage infiltration (Figure 2A). Electron microscopy demonstrated the vacuolization of ECs with macrophage attachments (Figure 2B). A tight junction protein, zona occludens‐1 immunostaining revealed a disrupted endothelial organization in the mutant ECs (Figure 2C). Endothelium‐dependent (acetylcholine) relaxation differed significantly between control and mutant mice at the age of 24 weeks (Figure 2D). The eNOS, arginase‐1, and arginase‐2 deficiencies observed in mutant aorta may impair relaxation (Figure 2E). PECAM‐1 expression was similar in both groups of mice. However, contraction in response to phenylephrine or a calcium channel opener (U46619) and endothelium‐independent (sodium nitroprusside) relaxation in aortic rings were similar in mutant and control mice (Figure 2F). The endothelium‐specific loss of PKR1 did not, therefore, alter aortic vasomotor responses (Table 2), despite the progressive impairment of endothelium‐dependent relaxation.
Figure 2.
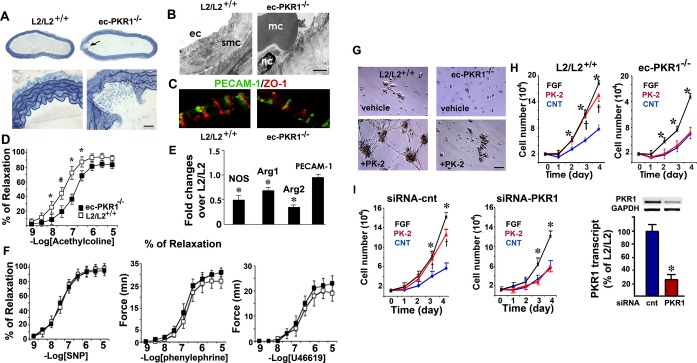
The loss of PKR1 in ECs affects endothelial function in vivo and in vitro. A, Histological analyses of aortas from control (L2/L2+/+) and ec‐PKR1−/− mice. Aortic rupture (arrow) was observed only in mutants (upper and lower panels). B, Electron microscopy showed defective endothelial structures, vacuolar structures, and the attachment of macrophages (mc) to ECs of the ec‐PKR1−/− aortas at the age of 24 weeks. Smc, smooth muscle cells; nc, nucleus. C, Impaired ZO‐1 staining shows a junctinal defects in ECs. D, Impaired acetylcholine‐induced relaxation in ec‐PKR1−/− aortas (n=6), as shown by comparison with L2/L2+/+ aortas (n=6). E, RT‐qPCR analyses of RNA samples from L2/L2+/+ and ec‐PKR1−/− aortas, showing a reduction of the expression of the NOS, arginase 1, arginase 2 genes, and an unaltered expression of PECAM‐1 gene in ec‐PKR1−/− aortas (*P<0.001). F, Relaxation in response to endothelium‐independent (sodium nitroprusside), or contraction in response to phenylephrine and calcium channel opener (U46619), in aortic rings were similar in the 2 groups of mice, that is, in ec‐PKR1−/− aortas (n=6) compared with control aortas (n=6). G, Representative in vitro assay of angiogenesis in response to prokineticin‐2 (PK2) on Matrigel, with endothelial cells derived from control (L2/L2+/+) and ec‐PKR1−/− hearts. H, Rate of proliferation of ECs derived from L2/L2+/+ or ec‐PKR1−/− hearts in response to FGF or prokineticin‐2, showing the impaired proliferation rate of mutant ECs (n=3, P>0.05); *(for FGF) indicate a significant difference from control (blue) (P<0.05) in ECs derived from aortas. I, Analysis of cell proliferation in response to PK‐2 and FGF in primary glomerular ECs transfected with a control siRNA (left panel) or a PKR1 siRNA (right panel) reveals a reduced proliferation rate of EC expressing low level of PKR1; *(for FGF) indicate a significant difference from control (blue) (P<0.05). RT‐PCR analyses show that transfection of EC with siRNA for PKR1 reduces PKR1 levels in these cells by 75%. Data are expressed as mean±SEM (n=3). Arg indicates arginase; Cnt, control; EC, endothelial cell; ec‐PKR1−/−, endothelium‐specific PKR1 knockout mice; FGF, fibroblast growth factor; NOS, nitric oxide synthase; PECAM‐1, platelet–endothelial cell adhesion molecule 1; PK‐2, prokineticin 2; PKR1, prokineticin receptor 1; siRNA, small‐interfering RNA; SNT, sodium nitroprusside; ZO‐1, zona occludens 1.
Table 2.
Ecocardiographic Analyses of 12‐ and 24‐Week‐Old Male Mice
| L2/L2+/+ | ec‐PKR1−/− | |
|---|---|---|
| Echocardiographic analyses (12‐week‐old mice, n=8 for each group) | ||
| Heart rate, bpm | 549.08±7.73 | 531.91±15.754 |
| LVEDD, mm | 3.85±0.08 | 4.39±0.120* |
| LVESD, mm | 2.11±0.07 | 2.37±0.109 |
| Septal wall thickness, mm | 0.93±0.05 | 0.85±0.032 |
| Fractional shortening, % | 45.13±1.21 | 46.05±1.945 |
| Ejection fraction, % | 0.834±0.01 | 0.83±0.017 |
| Echocardiographic analyses (24‐week‐old mice, n=6 for each group) | ||
| Heart rate | 440±37.9 | 461±32.48 |
| MAP, mm Hg | 102±15 | 115±10 |
| Diastolic parameters | ||
| LVEDD, mm | 3.91±0.159 | 4.46±0.218* |
| LVPW, mm | 1.009±0.035 | 0.878±0.068* |
| LV vol, μL | 67.22±7.137 | 92.055±10.626* |
| Systolic parameters | ||
| LVESD, mm | 2.726±0.201 | 3.272±0.291* |
| LVPW, mm | 1.39±0.086 | 1.225±0.142 |
| LV vol, μL | 29.17±3.47 | 45.94±5.54* |
| Ejection fraction, % | 58.10±4.51 | 52.49±5.35 |
| Fractional shortening, % | 36.67±3.26 | 27.28±3.39* |
| E wave, mm/s | 835±56.5 | 784±30.18 |
| A wave, mm/s | 498±69 | 435±39 |
| E/A ratio | 1.736±0.18 | 1.986±0.23 |
| IVRT, ms | 23.21±2.62 | 21±2.12 |
| IVCT, ms | 18.93±3.05 | 16.66±1.53 |
ec‐PKR1−/− indicates endothelium‐specific PKR1 knockout mice; E/A ratio, early (E) to late (A) ventricular filling velocities; IVCT, isovolumetric contraction time; IVRT, isovolumetric relaxation time; LV vol, left ventricular volume; LVEDD, left ventricular end‐diastolic diameter; LVESD, left ventricular end‐systolic diameter; LVPW, left ventricular posterior wall; MAP, mean arterial pressure. *P<0.05.
Control primary ECs formed capillary‐like structures in response to prokineticin‐2 on Matrigel, and these structures connected to anastomozing networks within 16 hours of culture (Figure 2G). In contrast, ec‐PKR1−/− ECs largely failed to generate tubes, instead forming aggregates of cells. The proliferation rate was increased by 8‐fold in the ECs derived from control mouse aorta, 4 days after treatment with prokineticin‐2 (10 nmol/L) and fibroblast growth factor (25 ng/mL). No visible prokineticin‐2–mediated EC proliferation was detected in the absence of PKR1 in aortic ECs from ec‐PKR1−/−mice. The fibroblast growth factor response also differed considerably between mutant and wild‐type cells (Figure 2H). The siRNA‐mediated knockdown of PKR1 expression in primary glomerular ECs induced a defect in the responses to prokineticin (10 nmol/L) (Figure 2I). The defective angiogenesis resulting from the impairment of mutant EC proliferation provided the first clue to the mechanisms potentially accounting for the phenotype of mice lacking endothelial PKR1.
The EC‐Specific Ablation of PKR1 Triggers Insulin Resistance and Impaired Endothelial Insulin Uptake
The ec‐PKR1−/− mice had symptoms of polyphagia, polydipsia, and polyuria at the age of 24 weeks, despite having a similar body weight to wild‐type mice (Figure 3A). Moreover, ec‐PKR1−/− mice had high levels of urinary glucose excretion (Figure 3B, left panel) and high basal serum insulin concentrations (0 minutes) (Figure 3B, right panel). Control mice displayed a significant increase in serum insulin concentration 20 minutes after glucose injection, whereas no such increase was observed in mutant mice (Figure 3B, right panel), indicating an impairment of glucose‐induced insulin secretion in the mutant mice. GTTs revealed a delayed response to hyperglycemia, with significant increases in blood glucose concentrations observed at 30, 90, and 120 minutes in ec‐PKR1−/− mice at the age of 24 weeks (Figure 3C, upper panel). These mutant mice also had higher glucose levels in the ITT (Figure 3C, lower panel). These changes in GTT and ITT were not significant in younger mutant mice (12 weeks old). Thus, ec‐PKR1−/− mice were significantly less sensitive to insulin than control mice, as shown by their higher glucose concentrations in the GTT and ITT and their prediabetic state at the ages of 24 and 36 weeks. Our mice model exhibit hyperinsulinemia and postprandial hyperglycemia as characteristics of type 2 diabetes.
Figure 3.

The loss of PKR1 leads to insulin resistance and impaired insulin uptake. A, Metabolic cage analyses revealed that ec‐PKR1−/− mice had greater intakes of food (g/24 h) and water (mL/24 h) and a greater urine volume (mL/24 h) than control (L2/L2+/+) mice at the age of 24 weeks. The data shown are means±SEM (n=6 for all groups, *P<0.05). Body weight (g) was similar in all groups. B, Urinary glucose concentration was higher in the mutant mice. Serum insulin concentration was higher in the mutant mice (n=6 for all the groups, *P<0.05). Glucose‐induced insulin release was significant in control mice (†P<0.05) but impaired in mutant mice, 20 minutes after glucose injection. C, GTT and ITT analyses show impaired glucose clearance and insulin tolerance in the ec‐PKR1−/− mice at the age of 24 weeks (n=6 for each group, *P<0.05). D, Representative illustration of insulin uptake in the blood vessels of the adipose tissue, kidney and heart, 10 minutes after FITC‐insulin intravenous injection into L2/L2+/+ and ec‐PKR1−/− mice. E, The histogram shows that FITC insulin uptake was significantly lower in ec‐PKR1−/− blood vessels than in control blood vessels (n=4, *P<0.05). F, Representative illustration of insulin uptake by ECs derived from the heart (card‐EC), glomerulus (glom‐EC), and adipocytes (adip‐EC) of mutant and control animals, 30 minutes after insulin‐FITC loading. No insulin uptake was observed in mutant ECs (histogram, n=3, *P<0.05). Scale bar=30 μm. G, The infection of glomerular ECs with an adenovirus carrying PKR1 cDNA (Adv‐PKR1) increased insulin uptake within 30 minutes, as shown by comparison with Adv‐control–infected glomerular ECs. Scale bar=10 μm. H, Prokineticin‐2 (PK‐2) promoted higher levels of insulin uptake in Adv‐PKR1–infected cells than Adv‐control–infected cells, indicating an essential role for PKR1 in insulin uptake (n=5 for all groups, *P<0.05). Adip indicates adipose; Card, cardiac; EC, endothelial cell; ec‐PKR1−/−, endothelium‐specific PKR1 knockout mice; glom, glomeruli; AGTT, glucose tolerance test; ITT, insulin tolerance test; FITC, fluorescein isothiocyanate.
We then investigated insulin delivery to ECs, a rate‐limiting step in the peripheral action of insulin potentially contributing to insulin resistance.30–31 FITC‐insulin immunoreactivity (detected with an antibody against FITC) was observed in the ECs and innermost layer of the blood vessel wall in control cardiac, renal, and adipose tissues 10 minutes after its administration. No fluorescence of vessel ECs was detected after non–FICT‐insulin injection. However, FICT‐insulin uptake in the ECs of the mutant adipose tissue, heart, and kidney was severely affected (Figure 3D and 3E). Thus, the transcapillary transport of insulin was defective in the mutant endothelial wall.
We then investigated the role of PKR1 in insulin uptake in isolated ECs. Isolated ECs from the cardiac, glomerular, and adipose tissues of control mice took up FITC‐insulin within 30 minutes (Figure 3F, left panel and histogram). However, very little insulin was taken up by ECs derived from the mutant cardiac, glomerular, and adipose tissues (Figure 3F, right panel and histogram). We then investigated the effect of PKR1 overexpression in cultured glomerular endothelial cells (glomEC‐PKR1) on FITC‐insulin uptake. We confirmed that total PKR1 expression (endogenous+infected with adenovirus carrying PKR1 cDNA) was significantly higher (50%±5% higher) in the transfected cells than in the control cells. The glomEC‐PKR1 cells took up 2.5±0.18 times more FITC‐insulin than control cells infected with adenovirus‐control (glomEC), over a 30‐minute period (Figure 3G). We investigated the role of PKR1 in insulin uptake further, by treating these cells with prokineticin‐2. This treatment (10 nmol/L prokineticin‐2) induced the uptake of twice as much FITC‐insulin, in a time‐dependent manner, in glomEC‐PKR1 cells as in glomECs (Figure 3H) (*P<0.05 for each), highlighting the role of PKR1 as a positive regulator of insulin uptake.
Next, we investigated whether insulin signaling is altered in mutant ECs. We also found an impaired insulin‐mediated NOS activation in all mutant ECs (Figure 4A and histograms). The eNOS protein levels in all mutant ECs were also lower, consistent with reduced NOS transcriptional levels (Figure 2E).
Figure 4.
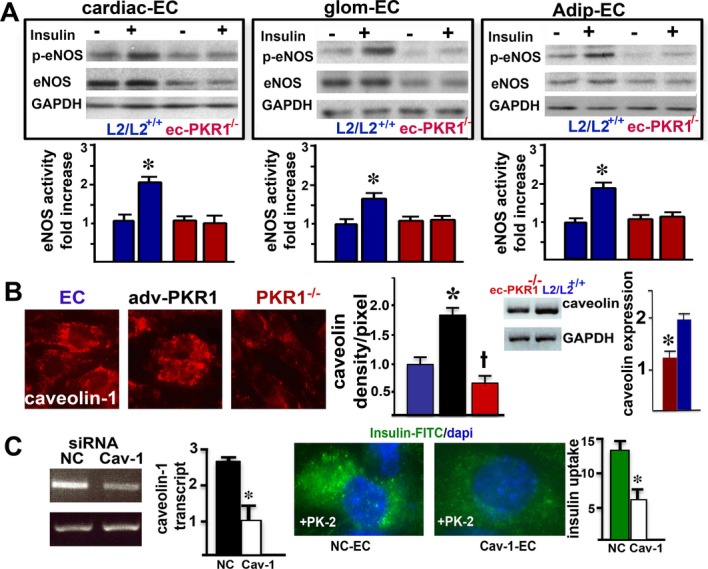
Impaired eNOS activity and caveolin‐1 levels in mutant endothelial cells. A, eNOS was phosphorylated at serine 1177, 5 minutes after insulin (10 nmol/L) treatment of cardiac endothelial cells (cEC), glomerular EC (glom ECs) and adipocyte tissue ECs (adip ECs) from control mice. In contrast, insulin was not able to induce phosphorylation of eNOS in any of the mutant ECs. Note that total eNOS level were reduced in mutant cECs, glom ECs and adip ECs by 60±7%, 55±8%, and 40±5%, respectively (n=3, *P<0.05). B, Representative illustration of calveolin‐1 levels. The histogram shows the regulation of calveolin‐1 levels by the PKR1 expression level in ECs (blue), ECs overexpressing PKR1 (black) and PKR1‐mutant ECs (red) (†*P<0.05). RT‐PCR analyses showed that mutant aortas contained less caveolin‐1 than control aortas (n=4, *P<0.05). C, Calveolin‐1 siRNA reduced caveolin‐1 expression by 75% in ECs within 72 hours. Caveolin‐1 knockdown by siRNA (Cav‐1‐EC) in Adv‐PKR1–expressing cells had a lower prokineticin‐2–mediated insulin uptake within 15 minutes, compared with ECs expressing a nonspecific siRNA (NC‐EC) (*P<0.05). Adv‐PKR1 indicates adenovirus carrying prokineticin receptor 1; ec‐PKR1−/−, endothelium‐specific PKR1 knockout mice; eNOS, endothelial nitric oxide synthase; siRNA, small‐interfering RNA.
Cav‐1 plays an important role in angiogenesis,32 insulin uptake,27 and G protein–coupled receptor trafficking.33 We therefore investigated the levels of this compound in control ECs, ECs overexpressing PKR1, and ECs lacking PKR1. Cal‐1 levels were closely correlated with PKR1 expression levels (Figure 4B and histogram). Thus, ec‐PKR1 mutant mice had low concentrations of Cav‐1 in their aortas (Figure 4B, right panel). Cal‐1 knockdown by siRNA for Cav‐1 in ECs diminished insulin uptake in ECs overexpressing PKR1, indicating that Cav‐1 acts as an intermediary between PKR1 and insulin trafficking (Figure 4C).
EC‐Specific Ablation of PKR1 Induces Lipodystrophy
We investigated the pathological consequences of impaired EC proliferation and insulin uptake in the tissues to which insulin is targeted. The ec‐PKR1−/− mice had a lower white abdominal fat mass (1.281±0.19 g) than control mice (1.93±0.19 g, n=6, P<0.05) at the age of 36 weeks. This is consistent with the slightly lower body weights of mutant mice (35.5±1.06 g) than of control mice (37.6±1.39 g) at the age of 36 weeks. The ec‐PKR1−/− mice mouse adipocytes were heterogeneous in size and were interspersed with very pronounced “streaks” (Figure 5A) composed of CD68‐positive macrophages (Figure 5B). Electron microscopy showed the diameter of the mutant vessels to be highly variable in ec‐PKR1−/− adipocytes, which also had small numbers of mitochondria (Figure 5C). GTT revealed a delayed response to hyperglycemia, with significant increases in blood glucose concentrations observed at 15, 30, and 60 minutes in ec‐PKR1−/− mice at the ages of 36 weeks (Figure 5D, left panel). These mutant mice also had higher glucose levels in the ITT (Figure 5D, right panel). Mutant mice displayed significantly lower levels of capillary formation than control mice, as shown by PECAM‐1 staining at the age of 36 weeks (Figure 5E). Indeed, hypoxia‐inducible factor 1α (HIF1α) transcription were 80%±5.2% higher in ec‐PKR1−/− adipocytes than in control adipocytes, whereas the expression of proangiogenic genes, such as that encoding vascular endothelial growth factor (VEGF), was unaffected (Figure 5F). The ec‐PKR1−/− mice displayed higher levels of fibrillar collagen deposition in adipose tissue (Figure 5G), partly due to higher levels of expression of HIF1α−regulated fibrotic genes, such as those encoding lysyl oxidase (LOX) and collagens 1a1, 1a2, and 3a (Figure 5F). TUNEL assays showed apoptosis levels to be higher in mutant than in control adipose tissue (Figure 5H and histogram). The lower levels of free fatty acid (FFA) transporters FATP‐1, FATP‐4, and FABP in mutant adipocytes (Figure 5I) are associated with the higher serum FFA concentrations in mutant than in control mice (L2/L2+/+) (Figure 5I, middle). Consistent with the observed lipodystrophy, circulating leptin concentrations were also found to be 50% lower in ec‐PKR1−/− mice than in control (L2/L2) mice (Figure 5I, right). Levels of mRNA encoding insulin receptor substrate‐1 and insulin receptor were also lower in mutant adipoytes than in control cells, by a factor of 1.5±0.1. Mutant adipocytes were resistant to the action of insulin, as shown by the significantly lower levels of threonine and serine phosphorylation of Akt following insulin stimulation (Figure 5J). Thus, ec‐PKR1−/− mice display lipodystrophy accompanied by peripheral insulin resistance.
Figure 5.

Impaired structures, capillary formation, and insulin signaling in ec‐PKR1 adipocytes. A, Semi‐thin sections of adipose tissue showing the heterogeneity of mutant adipocyte size. The arrow shows streaks in the mutant adipocytes. B, CD68 staining on cryosectioned adipose tissue revealed a high level of macrophage infiltration in the interstitial area of adipose tissue in ec‐PKR1−/− mice (illustration and histogram, n=3, *P<0.01). C, Electron microscopy analyses revealed a loss of mitochondria (mtc) and small blood vessel (bv) structures in mutant adipocytes. D, GTT and ITT analyses show impaired glucose clearance and insulin tolerance in the ec‐PKR1−/− mice at the age of 36 weeks (n=6 for each group, *P<0.05). E, PECAM‐1 immunostaining on cryosectioned adipocytes, showing capillary regression in mutant adipocytes. Scale bar=10 μm. F, RT‐PCR analyses demonstrated an increase in the expression of HIF1α but not of VEGF in mutant adipocytes (n=3, *P<0.05). RT‐qPCR showed the higher levels of fibrotic gene expression in ec‐PKR1−/− adipocytes than in control L2/L2+/+adipocytes (n=3, *P<0.05; scale bar=20 μm). G, Double‐staining of collagen VI and α‐SMA on cryosectioned adipocytes, showing higher levels of collagen deposition in the mutant adipocytes (illustration and histogram, *P<0.01). H, TUNEL staining of an adipocyte section showing a greater abundance of apoptotic cells in mutant adipocytes than in control adipocytes (*P<0.01). Scale bar=10 μm. I, qPCR analysis showed lower levels of expression of the insulin receptor (IR), insulin receptor substrate (IRS) and free fatty acid (FFA) transporter (FABP, FATP1 and 4) genes (n=3, *P<0.05). Serum FFA concentrations were higher, but leptin concentrations were lower in ec‐PKR1−/− than in L2/L2+/+ mice (n=6 for all groups, *P<0.05). J, Western blot analyses showed an impairment of Akt phosphorylation (Ser473 and Thr308) 10 minutes after insulin administration (i.p.) in ec‐PKR1−/− adipocytes (n=3, †*P<0.05). ec‐PKR1−/− indicates endothelium‐specific PKR1 knockout mice; GTT, glucose tolerance test; HIF1α, hypoxia‐inducible factor 1; ITT, insulin tolerance test; PECAM‐1, platelet–endothelial cell adhesion molecule 1; PKR1, prokineticin receptor 1; TUNEL, terminal deoxynucleotidyl transferase dUTP nick end labeling; SMA, smooth muscle actin; VEGF, vascular endothelial growth factor.
EC‐Specific Ablation of PKR1 Triggers Heart Defects
We next investigated how the cardiovascular system was affected by investigating heart structure and function in ec‐PKR1−/− mice at the ages of 12 and 24 weeks. Posterior wall thickness was thinner in of ec‐PKR1−/− mice (0.84±0.02 mm) than in control mice (0.75±0.03 mm) at the age of 12 weeks (n=8, P>0.05). Despite an increase in left ventricular end‐systolic diameter, no detectable changes in the heart functions were found in the ec‐PKR1−/− mice at this age (Table 2). Histological analysis of the hearts of 24‐week‐old mice revealed the reduced the ventricular wall in ec‐PKR1−/− mice (Figure 6A). Semi‐thin sections showed cellular disorganization and disruption in the mutant hearts (Figure 6B). Electron microscopy showed undulating ECs, myofibril disorganization, short sarcomeres, and swollen mitochondria. Echocardiography showed the left ventricular end‐systolic and end‐systolic diameters are significantly higher in 24‐week‐old mutants than in controls (Figure 6C). Consistent with this finding, left ventricular volume was significantly greater during diastole and systole (Figure 6C and Table 2). Shortening fractions (indicators of left ventricular contractility) differed significantly between mutant and control mice at 24 weeks (Table 2). RT‐qPCR analysis showed expression levels of the col1a1, col1a2, and col3A genes to be higher in mutant mice than in controls, consistent with the development of severe cardiac fibrosis in the mutant mice (Figure 6D). Levels of expression of hypertrophic genes, such as those encoding atrial natriuretic factor and the β/α–myosin heavy chain, were higher in mutant than in control hearts (Figure 6D). The level of capillary formation in hearts was significantly lower in mutant mice than in control mice (Figure 6E). TUNEL‐positive myocardial cells (green) were abundant in mutant hearts (Figure 6F), and infiltrating CD68‐positive macrophages (red) were twice as frequent in mutant as in control hearts (Figure 6G, lower panel and histogram). Insulin‐mediated Akt phosphorylation levels were lower in mutant hearts than in control hearts (Figure 6H). The ec‐PKR1−/− mice had significantly higher levels of myocardial lipid accumulation than control mice, as shown by Oil Red O staining (Figure 6I). The mutants displayed an evident loss of capillaries from the skeletal muscle (Figure 6J). Lower levels of insulin signaling and lipid accumulation in the skeletal muscle of ec‐PKR1−/− mice were shown in Figure 6J and 6K. The lipid accumulation (Figure 7A) and capillary levels (Figure 7B) in the liver of ec‐PKR1−/− mice were unaffected by the loss of endothelial‐PKR1, because hepatic sinusoidal ECs express only PKR2 receptors.15 In contrast, transcript levels for FFA transporters and insulin receptor were similar in the liver (Figure 7C), heart, and skeletal muscles (Figure 7D) of mutant and control mice. Note that transcript levels of uncoupling proteins UCP2 and UCP3 (as mediators of thermogenesis and energy balance in skeletal muscle) were similar in ec‐PKR1 and control heart and skeletal muscles (Figure 7D).
Figure 6.
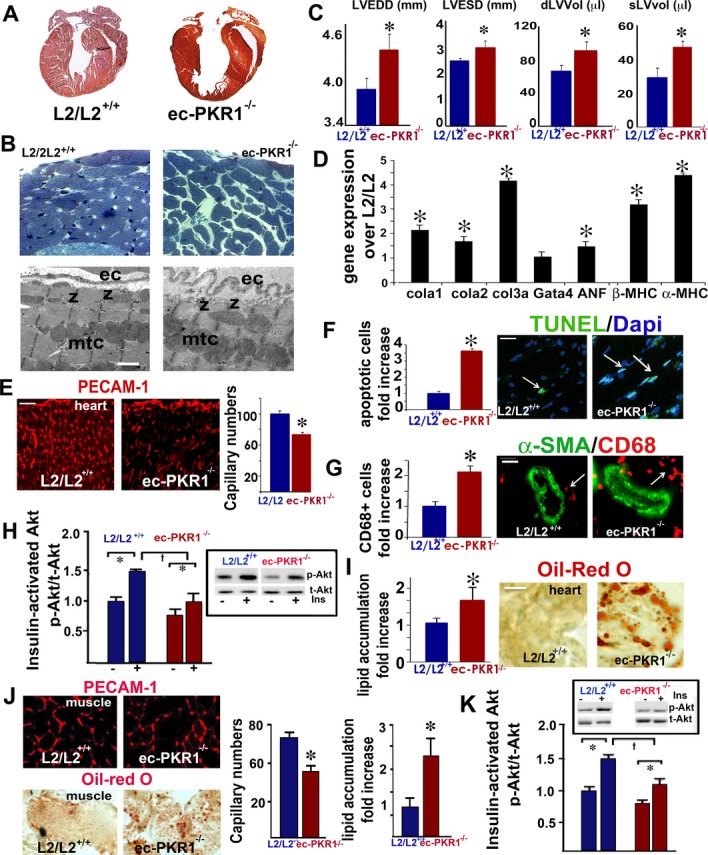
Impaired heart structure and function in mutant mice. A, Histological analysis, with Mallory tetrachrome staining, of L2/L2+/+ and ec‐PKR1−/− heart sections, showing a thinner ventricular wall in ec‐PKR1−/− hearts (n=5). B, Semi‐thin sections of hearts, demonstrating higher levels of cellular disarray in the subepicardium and myocardium of ec‐PKR1−/− mice. Electron microscopy revealed undulating ECs, shortened sarcomeres (z bands) and swollen mitochondria (mtc). C, Echocardiographic analyses showed left ventricular internal diameters and volume in diastole to be greater in ec‐PKR1−/− hearts (n=6, *P<0.05). D, RT‐qPCR showed higher levels of hypertrophic (Gata 4, α‐ and β‐myosin heavy chain) and fibrotic (collagens 1a, 2, and 3a) gene expression in ec‐PKR1−/− hearts (*P<0.05, n=3). E, Capillary regression in mutant hearts, detected by PECAM‐1 staining (*P<0.05; scale bar=20 μm). F, Illustrations and the histogram show larger numbers of TUNEL‐stained apoptotic nuclei in ec‐PKR1−/− heart sections (*P<0.05, n=4). Scale bar=20 μm. G, Illustrations and the histogram show higher levels of CD68‐positive macrophage infiltration around the blood vessels of the ec‐PKR1−/− hearts (*P<0.05). Scale bar=10 μm. H, Western‐blot analyses demonstrating an impairment of Akt phosphorylation (Ser473) 10 minutes after insulin administration (i.p.) in mutant hearts, with respect to control hearts (n=3, †*P<0.05). I, Oil Red O staining showing lipid accumulation in the ec‐PKR1−/− hearts (*P<0.05). Scale bar=20 μm. J, Lower levels of capillary formation, as shown by PECAM‐1 staining, and higher levels of lipid accumulation, as shown by Oil Red O staining, were detected in the ec‐PKR1−/− skeletal muscles (*P<0.05). Scale bar=10 μm. K, Western‐blot analyses demonstrating an impairment of Akt phosphorylation (Ser473) 10 minutes after insulin administration (i.p.) in mutant hearts with respect to control hearts (n=3, †*P<0.05). ANF indicates atrial natriuretic factor; EC, endothelial cell; ec‐PKR1−/−, endothelium‐specific PKR1 knockout mice; MHC, myosin heavy chain; PECAM‐1, platelet–endothelial cell adhesion molecule 1; PKR1, prokineticin receptor 1; TUNEL, terminal deoxynucleotidyl transferase dUTP nick end labeling.
Figure 7.
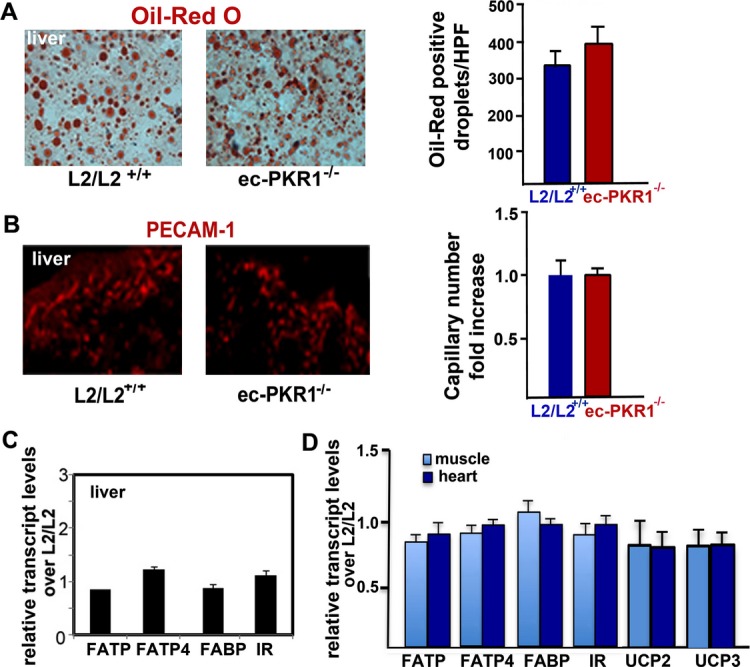
No pathological alteration in the mutant livers. A, Illustration of Oil Red O staining of liver from control and mutant mice, demonstrating no difference in lipid accumulation in liver cells (histogram, P>0.05). B, Illustration of PECAM‐1 staining of liver of control and mutant mice, demonstrating no difference in capillary formation in the liver of both genotypes (histogram, P>0.05). C, Expression of FFA transporters and insulin receptor detected by qPCR was not altered in mutant liver (n=3, P>0.05). D, qPCR analyses revealed that expression of FFA transporters (FATP1, FATP4, and FABP), insulin receptor (IR), uncoupling proteins (UCP2 and UCP3) was not altered in mutant skeletal muscle and heart (n=3, P>0.05). ec‐PKR1−/− indicates endothelium‐specific PKR1 knockout mice; FFA, free fatty acid; PECAM‐1, platelet–endothelial cell adhesion molecule 1; qPCR, quantitative PCR.
EC‐Specific Ablation of PKR1 Triggers Renal Defects
We extended these cellular studies to an in vivo system, by investigating kidney structure and function in ec‐PKR1−/− mice at the age of 12 and 24 weeks. Clear dilatation of the Bowman's spaces was observed in most of the mutant glomeruli, with a compact glomerulus, glomerular fibrosis, and enlarged tubular structures in 12‐week‐old mice (Figure 8A and 8B). Electron microscopy of the mutant kidneys showed dilated tubules, with a swollen necrotic nucleus, abnormal mitochondria, and incorrect organization of podocytes within the glomerular structures (Figure 8C). At 12 weeks, ec‐PKR1−/− mice had higher levels of absolute renal phosphate (Pi) excretion than control mice (Figure 8D), indicating abnormal tubular function. PECAM staining revealed that the level of capillary formation in the kidneys was significantly lower in mutant mice than in control mice (Figure 8E and histogram). Tubular defects were evident, with lower levels of transcripts for sodium‐calcium (NCX‐1) and sodium phosphate (NaPi‐IIa) exchangers than in control mice. Low levels of the glomerular slit diaphragm protein nephrin may have resulted in abnormal podocyte architectures in mutants (Figure 8F). The morphological changes were associated with higher levels of the inflammatory cytokine transforming growth factor‐β in mutant kidneys at the age of 24 weeks. The glomeruli of mutant kidneys contained significantly larger numbers of TUNEL‐positive cells (green) than those of control kidneys (Figure 8G and histogram). Insulin‐mediated Akt phosphorylation (serine 473) was significantly impaired in mutant kidneys at the age of 24 weeks (Figure 8H). Lipids accumulated ectopically in the kidneys of ec‐PKR1−/− mice, as shown by Oil Red O staining (Figure 8I). All urinary ion levels (mmol/L) were lower in ec‐PKR1−/− mice than in controls, because of high rates of urine flow over a period of 24 hour at the age of 24 weeks (Table 3). Thus, endothelial‐PKR1 regulates glomerular and tubular capillary formation and renal metabolism and functions.
Figure 8.
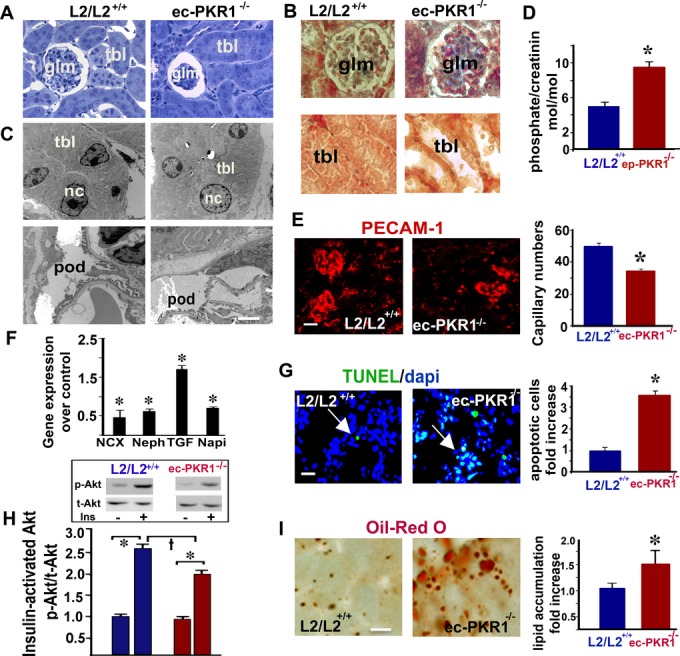
Impaired kidney structure and function in mutant mice. A, Semi‐thin sections of kidneys showing a compact glomerulus (glm) and larger than control Bowman's capsules in mutant kidneys (n=5). B, Mallory tetrachrome staining of kidney sections showing hemorrhage (red) and glomerular fibrosis (blue) in the glomerula of ec‐PKR1−/− kidneys (upper panel). Large loss of tubular cells from mutant tubules. C, Electron microscopy analyses on kidney samples revealed a lower cellular content of tubules (tbl) and abnormal podocyte (pod) structures and necrotic nuclei (nc) in ec‐PKR1−/− kidneys (lower image). D, The histogram shows that levels of phosphate excretion in the urine of L2/L2+/+ mice were higher than those of L2/L2+/+mice. The data shown are means±SEM, n=6 for each group, at the age of 24 weeks (*P<0.05). E, PECAM‐1 analyses on cryosectioned kidneys revealed capillary regression in both the glomerular and interstitial areas (n=3, *P<0.05). Scale bar=10 μm. F, qPCR analyses on the kidney samples revealed that ec‐PKR1−/− kidneys had higher levels of TGF‐β and lower levels of nephrin, NaPi, and NCX mRNA. (n=3, *P<0.05). G, Representative illustration of TUNEL analyses on kidneys. The histogram and images show larger numbers of TUNEL‐positive apoptotic cells (green) in ec‐PKR1−/− glomeruli (*P<0.05). Scale bar=10 μm. H, Western‐blot analyses demonstrating an impairment of Akt phosphorylation (Ser473), 10 minutes after insulin administration (i.p.), in ec‐PKR1−/− kidneys (n=3, †*P<0.05). I, Oil Red O staining showing lipid accumulation in the ec‐PKR1−/− kidneys (*P<0.05). Scale bar=20 μm. ec‐PKR1−/− indicates endothelium‐specific PKR1 knockout mice; NaPi, transcripts for sodium phosphate; NCX‐1, transcripts for sodium‐calcium; PECAM‐1, platelet–endothelial cell adhesion molecule 1; qPCR, quantitative polymerase chain reaction; TGF, transforming growth factor; TUNEL, Terminal deoxynucleotidyl transferase dUTP nick end labeling.
Table 3.
Urine Analyses of 12‐ and 24‐Week‐Old Mice
| Urine Analysis | 12 Weeks | 24 Weeks | ||
|---|---|---|---|---|
| Control (L2/L2) | Mutant (ecPKR1−/−) | Control (L2/L2) | Mutant (ecPKR1−/−) | |
| Urea, mmol/L | 1217±86 | 1316±65 | 1532.0±276.68 | 801.0±137.96 |
| Urea, μmol/24 h per g | 71.66±5 | 62.50±6 | 50.98±13.00 | 95.46±3.66* |
| Creatinine, μmol/L | 4857±26 | 5947±21 | 4760.00±1108 | 2345.00±412.56 |
| Creatinine, nmol/24 h per g | 291.12±20 | 276.71±22 | 136.135±20 | 278.072±11* |
| Urea/creatinine, mol/mol | 247.3±7 | 220.3±6 | 352.951±53 | 343.537±5.70 |
| Phosphate, mmol/L | 23.90±2.5 | 55.46±4.0* | 69.762±15 | 35.560±5.60 |
| Phosphate/creatinine, mol/mol | 5.003±0.51 | 9.502±0.69* | 14.570±1.2 | 14.548±1.77 |
| Ca, mmol/L | 1.774±0.22 | 1.481±0.09 | 2.978±0.87 | 2.840±0.64 |
| Ca/creatinine, mol/mol | 0.364±0.04 | 0.251±0.01 | 0.629±0.07 | 1.243±0.21 |
| Na, mmol/L | 161±11 | 170±10 | 127.200±25 | 71.00±16.42 |
| Na/creatinine, mol/mol | 33.19±1.22 | 28.61±1.28 | 28.974±4.6 | 29.419±1.89 |
| K, mmol/L | 278±18 | 296±13 | 268.640±36.5 | 165.400±27.36 |
| K/creatinine, mol/mol | 56.88±1.31 | 49.79±1.19 | 64.054±10.1 | 71.453±1.94 |
| Cl, mmol/L | 188±12.34 | 198±12.03 | 147.400±34.3 | 71.750±13.01 |
| Cl/creatinine, mol/mol | 38.58±1.29 | 33.21±1.47 | 32.578±5.12 | 30.877±1.25 |
| Glucose, mmol/L | 1.813±0.12 | 2.238±0.12 | 2.360±0.35 | 2.000±0.38 |
| Glucose, μmol/24 h | 1.161±0.15 | 1.952±0.28* | 2.915±1.23 | 7.518±0.59* |
| Glucose/creatinine, mol/mol | 0.393±0.03 | 0.376±0.01 | 0.613±0.20 | 0.845±0.03 |
| Glucose balance, μmol/g | 0.117±0.01 | 0.106±0.01 | 0.095±0.04 | 0.236±0.02* |
ec‐PKR1−/− indicates endothelium‐specific PKR1 knockout mice.
P<0.05.
EC‐Specific Ablation of PKR1 Triggers Hypertrophy of Pancreas β Cells
We investigated whether insulin resistance induced a compensatory expansion of β‐cell mass leading to hyperinsulinemia in mutants, by determining the number of pancreatic β cells and insulin levels in ec‐PKR1−/− and L2/L2+/+ mice. The number of insulin‐positive beta cells did not differ significantly between these 2 groups of mice (Figure 9A and 9B, left panel, *P<0.05). In contrast, insulin‐positive cells were larger in the mutant pancreas, as demonstrated by β‐catenin staining (Figure 9A, lower panel, and 9B, right panel, *P<0.05). Thus, insulin resistance in ec‐PKR1−/− induced a compensatory hypertrophy of β cells, leading to hyperinsulinemia.
Figure 9.
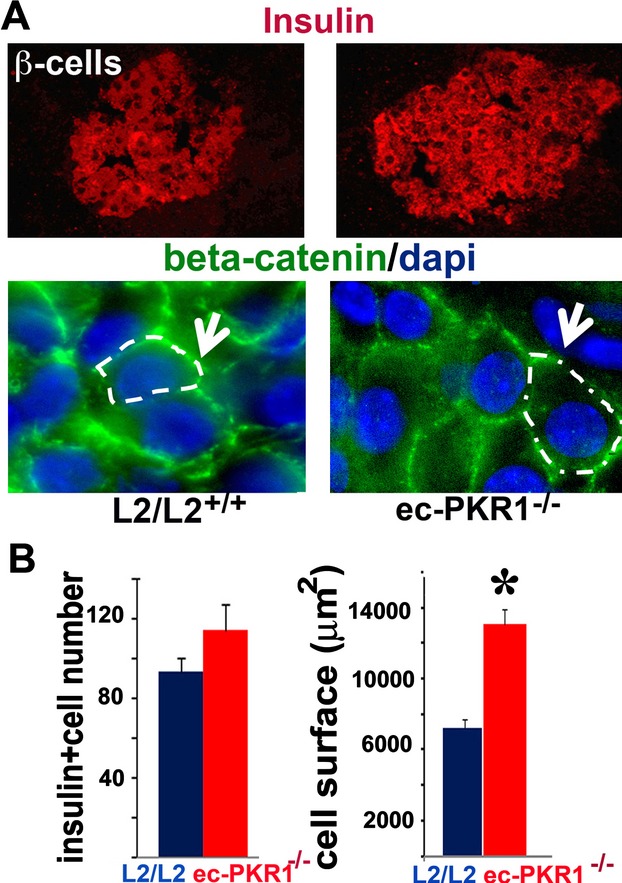
Hypertophic β cells in mutant pancreas. A, Immunostaining for insulin and β‐catenin revealed a higher intensity of the insulin signal and a larger Langerhans islet area, respectively, in the mutant pancreas. B, The histograms show the numbers of insulin‐positive cells, together with a quantification of the area covered by these cells (P<0.05). ec‐PKR1−/− indicates endothelium‐specific PKR1 knockout mice; L2/2, control mice.
Reversal of the Disorders in ecPKR1−/− Mice by the Forced Expression of PKR1
We investigated whether it was possible to rescue this phenotype by forced PKR1 expression in ec‐PKR1−/− mice. It has been shown that, when delivered intravenously directly into the bloodstream, adenoviruses first encounter the heart and lungs and then travel to the periphery via the aorta and arteries before being distributed to the liver, spleen, and kidneys.34 A recombinant adenovirus carrying PKR1 cDNA (Adv‐PKR1) was delivered intravenusly to ec‐PKR1−/− and control mice. This intravenous injection of Adv‐PKR1 led to a tripling of PKR1 levels in the adipocytes of control mice 2 weeks after infection. The aortic ECs clearly expressed PKR1 after the infection of ec‐PKR1−/− mice with Adv‐PKR1 (Figure 10A). In each case, L2/L2 mice infected with the Adv‐control were identical to untreated mice. The difference in capillary formation in the adipose tissues control and mutant mice was abolished by Adv‐PKR1 treatment (Figure 10B and histogram). Endothelial insulin uptake in mutant mice was restored by Adv‐PKR1 infection (Figure 10C). The rescue of PKR1 expression by the injection of an adenovirus into ec‐PKR1−/− mice resulted in lower levels of food and water intake and urine volume than in ec‐PKR1−/− mice treated with Adv‐control (Figure 10D). Similarly, glucose intolerance and insulin resistance in ec‐PKR1−/− mice were clearly attenuated by PKR1 replacement (Figure 10E). Consistent with this finding, the serum insulin and creatine phosphokinase concentrations of mutant mice after PKR1 gene replacement were similar to those of control mice treated with Adv‐PKR1 or Adv‐control (Figure 10F). The genes involved in FFA (FABP, FATP1, and FATP4) uptake and insulin signaling (insulin receptor and insulin receptor substrate‐1), were significantly more strongly expressed in the adipocytes of ec‐PKR1−/− mice treated with Adv‐PKR1 than in those treated with Adv‐control (Figure 10G). The strong expression of hypertrophic markers in mutant hearts was significantly decreased by the Adv‐PKR1 treatment of mutant mice (Figure 10H). Similarly, the differences in expression of the NaPi, NCX, TGF‐β, nephrin, and FLK1 genes in between mutant and control kidneys were abolished by the treatment of mutant mice with AdV‐PKR1 (Figure 10I). Thus, forced PKR1 expression in the ec‐PKR1−/− mice rescued the observed phenotype.
Figure 10.
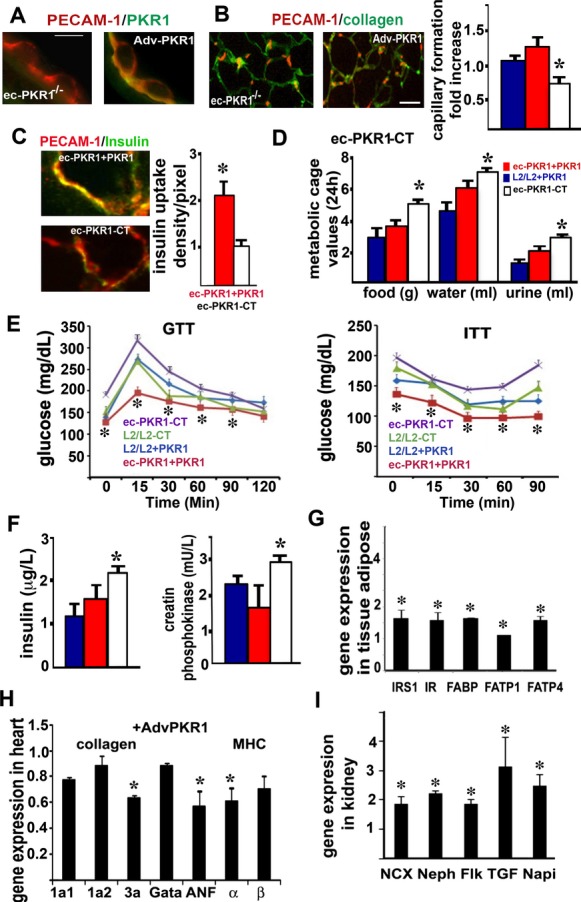
Rescue of the mutant phenotype by PKR1 gene transfer. A, PKR1 staining showing mutant endothelial cells expressing PKR1 (green) after infection with adv‐PKR1. Scale bar=50 μm. B, The representative illustration and histogram show PECAM‐1–positive capillary formation by ec‐PKR1−/− adipocytes, for Adv‐PKR1 (ec‐PKR1+PKR1) – and Adv‐control (ec‐PKR1‐CT) –infected ec‐PKR1−/− adipocytes (*P<0.05). Scale bar=10 μm. C, FITC‐insulin uptake by PECAM‐1–positive ECs (red) from blood vessels derived from ec‐PKR1 aortas after infection with Adv‐PKR1 or Adv‐control. D, Food intake, water intake, and urine volume abnormalities disappeared after the treatment of ec‐PKR1−/− mice with Adv‐PKR1 (n=6). E, The reintroduction of the PKR1 gene rescues metabolic alterations, such as glucose (GTT) and insulin (ITT) tolerance tests, in ec‐PKR1+PKR1 mice, as shown by comparison with ec‐PKR1‐CT mice at the age of 40 weeks (n=6, *P<0.05). F, Insulin concentrations and creatine phosphokinase levels in ec‐PKR1+PKR1 mice and ec‐PKR1‐CT mice (n=6). G, Pattern of expression of the genes encoding insulin signaling molecules (IRS1, IR) and FFA transporters (FABP, FATP1, and FATP4) in ec‐PKR1+PKR1 adipocytes and ec‐PKR1‐CT adipocytes (n=3, P>0.05). H, The pattern of expression of genes encoding ANF, collagen, and MHC in mutant hearts was normalized by the forced expression of PKR1 (n=3, *P<0.05). I, Differences in the levels of expression of the genes encoding NCX, nephrin, TGFβ, and NaPi in mutant kidneys were abolished by the treatment of ec‐PKR1−/− mice with Adv‐PKR1 (n=3, *P<0.05). Adv‐PKR1 indicates adenovirus carrying prokineticin receptor 1; ANF, atrial natriuretic factor; EC, endothelial cell; ec‐PKR1−/−, endothelium‐specific PKR1 knockout mice; FFA, free fatty acid; MHC, myosin heavy chain; NCX‐1, transcripts for sodium‐calcium; PECAM‐1, platelet–endothelial cell adhesion molecule 1; PKR1, prokineticin receptor 1.
Discussion
Our results highlight a novel role for endothelial‐PKR1 signaling in cardiac, renal, and metabolic functions by orchestrating the survival, proliferation, and insulin uptake of the ECs. Moreover, PKR1 loss in the endothelium results in capillary refraction, the impairment of endothelium‐dependent relaxation, apoptosis, fibrosis, and changes in insulin signaling, leading to lypodystrophy, insulin resistance, and heart and kidney defects (Figure 11).
Figure 11.
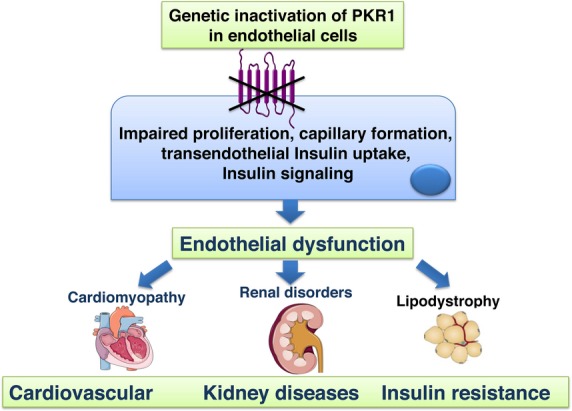
Schematic illustration of phenotype of endothelium‐specific PKR1 knockout mice (ec‐PKR1−/− mice). Loss of prokineticin receptor 1 (PKR1) in endothelial cells leads to endothelial dysfunction characterized by defects in endothelial proliferation rate, capillary formation, transendothelial insulin uptake, and insulin signaling (eg, nitric oxide synthase [NOS] Akt activity) leading to cardiomyopathy, renal disorders, lypodystrophy. At the later age, insulin resistance was evident in these mutant mice.
The defective tube formation by ECs derived from ec‐PKR1−/− mice results from impaired EC proliferation—an important step in angiogenesis.35 The impaired capillary formation observed in the ec‐PKR1−/− heart, kidney, and adipose tissue identifies PKR1 as a regulator of angiogenic programs in adult tissues. These findings are supported by in vitro studies showing that PKR1 signaling regulates the survival, proliferation, and migration of ECs.15,36 Prokineticin‐2 can also induce proliferation, migration, and angiogenesis in isolated cardiac ECs, by activating Gα11/MAPK and Akt kinases. We show here that PKR1 in ECs is involved in regulating endothelium‐derived relaxation, capillary formation, and insulin uptake. Mice lacking the eNOS gene develop modest hypertension while still young. However, blood pressure in male NOS−/− mice decreases at older ages, due to cardiac dysfunction.37 Blood pressure changes despite the presence of low levels of NOS in the endothelium are probably masked by the cardiac dysfunction in ec‐PKR1−/− mice. Similarly, altered eNOS activation and weak insulin action have recently been demonstrated in the endothelium of patients with diabetes mellitus.38 A nitric oxide deficiency of endothelial origin is thought to be the primary defect linking insulin resistance and endothelial dysfunction.39 Concomitantly, we found an impaired insulin uptake and insulin‐mediated eNOS activation in all mutant ECs. Thus, impaired insulin delivery in ECs may lead to defective NOS and eNOS activation in the ec‐PKR1−/− aorta, consequently impairing endothelium‐dependent relaxation.
PKR1 loss is accompanied by impaired proliferation, capillary formation, and insulin uptake. Conversely, PKR1 overexpression promotes insulin uptake in ECs and angiogenesis.15 Transcapillary insulin transport is the rate‐limiting step in the peripheral action of insulin, and the impairment of these processes contributes to insulin resistance.30–31 Accordingly, impaired insulin delivery and signaling in ECs have been shown to cause insulin resistance in skeletal muscle.2 Impaired endothelial insulin transport has been observed in cases of insulin resistance with type 2 diabetes and obesity. Our in vivo and in vitro data clearly show that PKR1 controls endothelial insulin uptake, via Cav‐1 signaling. Cav‐1 is required for insulin uptake by ECs27 and plays an important role in the process of angiogenesis.32 Cal‐1–null mutant mice also have vascular abnormalities, due to aberrant endothelial function,40 lipodystrophy‐dependent insulin resistance, and heart and kidney defects,41–43 resulting in a phenotype similar to that of ec‐PKR1−/− mice. Gαq–Cav‐1 interactions promote the internalization of receptors, including G protein–coupled receptors and insulin receptors.33 We found that protein and mRNA levels for Cav‐1 were closely correlated with PKR1 expression levels in ECs and that PKR1 could not mediate insulin uptake in the absence of Cav‐1. We are currently investigating possible crosstalk between PKR1 and insulin signaling via Cav‐1 in ECs.
What are the consequences of capillary loss and a lack of endothelial insulin uptake for peripheral organ function? Recent reports have suggested that adipose tissue expansion may be inhibited due to a decrease in the vascularization of adipose tissue. This leads to lipotoxicity, due to higher levels of lipolysis and/or ectopic fat deposition.44 Accordingly, impaired capillary formation in ec‐PKR1−/− mice results in a low adipose mass. Lipodystrophies, involving a loss of white adipose tissue, cause hyperphagia and peripheral insulin resistance,45 as observed in ec‐PKR1 mutant mice. The impairment of insulin signaling in ec‐PKR1−/− adipocytes may also impair the antilipolytic action of insulin, increasing the rate of FFA release from adipose tissues and preventing the release of leptin. Hyperphagia is another consequence of lipodystrophy, due to the lower levels of leptin46 in ec‐PKR1−/− mice. Consistent with the observed lipodystrophy, inflammation was also detected, in the form of macrophage infiltration and fibrosis in the adipose tissues of ec‐PKR1−/− mice. Thus, the adipose tissue of ecPKR1−/− mice plays an important role in the maintenance of systemic insulin sensitivity. The islet compensatory response to the greater demand for insulin due to insulin resistance is involved an increase in β‐cell size in ecPKR1−/− mice. The loss of capillaries in the skeletal muscle, together with limited endothelial insulin uptake and insulin signaling, may also contribute to abnormal systemic GTT and ITT results.
The endothelium‐specific ablation of angiogenic factors, such as fibroblast growth factor47 and platelet‐derived growth factor,48–50 by tie‐2 cre/LoxP technology in mice also leads to heart and kidney disorders. A loss of endothelial fibroblast growth factor signaling has been shown to induce cardiomyocyte apoptosis.47 Hence, the loss of ventricular mass in ec‐PKR1−/− mice is due to high rates of capillary formation loss and apoptosis. The remaining viable heart muscle is subject to greater biomechanical stress, triggering a hypertrophic response. The ec‐PKR1−/− mouse heart displayed EC dysregulation, capillary refraction, apoptosis, fibrosis, and ectopic lipid deposition, resulting in an impairment of diastolic function. Impaired Akt activity in response to insulin is also a common feature of diabetic cardiomyopathy.51 These pathologies are considered to be important in the development of diastolic dysfunction and its progression to systolic dysfunction and heart failure in diabetic hearts.52
Ectopic lipid accumulation, apoptosis and fibrosis, impaired insulin signaling, and high levels of phosphate excretion in urine are implicated in the development of diabetic nephropathy.53 An antiphosphaturic effect of insulin has been documented in animals and humans.54 Impaired insulin signaling, together with low sodium, potassium, and calcium exchanger levels, may contribute to the high levels of phosphate excretion in urine of ec‐PKR1−/− mice. At the age of 24 weeks, mutant mice displayed high levels of creatinine clearance and urine volume, potentially contributing to an increase in water intake. PKR1‐null mutant mice have been shown to display severe structural and functional defects of their hearts and kidneys, including impaired systolic dysfunction and proteinuria at older ages.17 The ec‐PKR1−/− mouse model provides insight into the common mechanism, endothelial dysfunction, partially underlying the pathological features of PKR1‐null mutant hearts and kidneys.
The ECs lining the vasculature throughout the body are a massive sink for any adenovirus.34 The rescue of PKR1 expression by adenovirus injection in ec‐PKR1−/− mice restored capillary formation and endothelial insulin uptake and glucose and insulin sensitivity, thereby correcting polyphagia, polydipsia, and polyuria. Thus, endothelial PKR1 serves as a positive regulator of insulin sensitivity. The levels of markers of cardiac and renal disease in ec‐PKR1−/− mice were decreased by adenoviral PKR1 treatment. Our data are consistent with previous findings showing that PKR1 gene transfer by adv‐PKR1 protects the heart against myocardial infarction–induced damage.11
In summary, we have shown that endothelial dysfunction resulting from loss of PKR1 function is the principal mechanism for cardiovascular and renal disorders and insulin resistance in ec‐PKR1−/− mice. As prokineticin or PKR1 levels have been shown to be altered in human patients with abdominal aortic rupture,55 during human end‐stage cardiac failure,11 and in obese human adipose tissues (C. G. Nebigil, unpublished observations) and considering that chronic administration of prokineticin 2 reduces food intake and body weight in a mouse model of human obesity,56 our data indicate a new avenue in the development of preventive and therapeutic strategies for these disorders, specifically targeting PKR1. Indeed, it is conceivable that the therapeutic correction of endothelial dysfunction by using PKR1 agonist(s) can combat insulin resistance, diabetes, and cardiovascular and renal diseases.
Study Limitations
We have found that ec‐PKR1−/− mice exhibit capillary regression and impaired insulin uptake in EC cultures at early ages (6 and 12 weeks), persisting at later ages (24 and 36 weeks). However, they displayed impaired structure and function of the heart and kidney at the ages of 12 and 24 weeks and significant alteration in GTT and ITT at the ages of 24 and 36 weeks. Therefore, EC dysfunction was observed before the occurrence of insulin resistance, indicating that endothelial dysfunction is not a consequence of insulin resistance but rather the consequence of a lack of PKR1 signaling within ECs. PKR1 is not expressed in all ECs of the body; for instance, it is not expressed in liver ECs, and there were no detectable structural or functional changes of this organ ec‐PKR1−/− mice. This further indicates that endothelially expressed PKR1 drives the observed phenotype. ECs are certainly important in the brain/central nervous system. In this study, we did not address whether there are alterations in the ECs of the brain in ec‐PKR1−/− mice that might be a possible contributor to some of the changes noted. Our mutant mice represent a novel model to study the link between endothelial dysfunction and insulin resistance accompanied by cardiac and renal defects.
Sources of Funding
This work was supported by Centre National de la Recherche Scientifique (CNRS), Fondation de France Cardiovasculaire, Association Française contre les Myopathies (AFM), Fondation pour la Recherche Médicale en France (FRM), Région Alsace, and Laboratory of Excellence, Medalis.
Disclosures
None.
Acknowledgments
We thank all facilities of the Institute of Mouse Clinic (ICS), Illkirch, France.
References
- 1.Davel AP, Wenceslau CF, Akamine EH, Xavier FE, Couto GK, Oliveira HT, Rossoni LV. Endothelial dysfunction in cardiovascular and endocrine‐metabolic diseases: an update. Braz J Med Biol Res. 2011; 44:920-932 [DOI] [PubMed] [Google Scholar]
- 2.Kubota T, Kubota N, Kumagai H, Yamaguchi S, Kozono H, Takahashi T, Inoue M, Itoh S, Takamoto I, Sasako T, Kumagai K, Kawai T, Hashimoto S, Kobayashi T, Sato M, Tokuyama K, Nishimura S, Tsunoda M, Ide T, Murakami K, Yamazaki T, Ezaki O, Kawamura K, Masuda H, Moroi M, Sugi K, Oike Y, Shimokawa H, Yanagihara N, Tsutsui M, Terauchi Y, Tobe K, Nagai R, Kamata K, Inoue K, Kodama T, Ueki K, Kadowaki T. Impaired insulin signaling in endothelial cells reduces insulin‐induced glucose uptake by skeletal muscle. Cell Metab. 2011; 13:294-307 [DOI] [PubMed] [Google Scholar]
- 3.Cersosimo E, DeFronzo RA. Insulin resistance and endothelial dysfunction: the road map to cardiovascular diseases. Diabetes Metab Res Rev. 2006; 22:423-436 [DOI] [PubMed] [Google Scholar]
- 4.Kearney MT, Duncan ER, Kahn M, Wheatcroft SB. Insulin resistance and endothelial cell dysfunction: studies in mammalian models. Exp Physiol. 2008; 93:158-163 [DOI] [PubMed] [Google Scholar]
- 5.Lee R, Channon KM, Antoniades C. Therapeutic strategies targeting endothelial function in humans: clinical implications. Curr Vasc Pharmacol. 2012; 10:77-93 [DOI] [PubMed] [Google Scholar]
- 6.Zhou QY. The prokineticins: a novel pair of regulatory peptides. Mol Interv. 2006; 6:330-338 [DOI] [PMC free article] [PubMed] [Google Scholar]
- 7.Zhong C, Qu X, Tan M, Meng YG, Ferrara N. Characterization and regulation of bv8 in human blood cells. Clin Cancer Res. 2009; 15:2675-2684 [DOI] [PubMed] [Google Scholar]
- 8.Kisliouk T, Levy N, Hurwitz A, Meidan R. Presence and regulation of endocrine gland vascular endothelial growth factor/prokineticin‐1 and its receptors in ovarian cells. J Clin Endocrinol Metab. 2003; 88:3700-3707 [DOI] [PubMed] [Google Scholar]
- 9.Ngan ES, Lee KY, Sit FY, Poon HC, Chan JK, Sham MH, Lui VC, Tam PK. Prokineticin‐1 modulates proliferation and differentiation of enteric neural crest cells. Biochim Biophys Acta. 2007; 1773:536-545 [DOI] [PubMed] [Google Scholar]
- 10.LeCouter J, Zlot C, Tejada M, Peale F, Ferrara N. Bv8 and endocrine gland‐derived vascular endothelial growth factor stimulate hematopoiesis and hematopoietic cell mobilization. Proc Natl Acad Sci USA. 2004; 101:16813-16818 [DOI] [PMC free article] [PubMed] [Google Scholar]
- 11.Urayama K, Guilini C, Messaddeq N, Hu K, Steenman M, Kurose H, Ert G, Nebigil CG. The prokineticin receptor‐1 (GPR73) promotes cardiomyocyte survival and angiogenesis. FASEB J. 2007; 21:2980-2993 [DOI] [PubMed] [Google Scholar]
- 12.Masuda Y, Takatsu Y, Terao Y, Kumano S, Ishibashi Y, Suenaga M, Abe M, Fukusumi S, Watanabe T, Shintani Y, Yamada T, Hinuma S, Inatomi N, Ohtaki T, Onda H, Fujino M. Isolation and identification of EG‐VEGF/prokineticins as cognate ligands for two orphan G‐protein‐coupled receptors. Biochem Biophys Res Commun. 2002; 293:396-402 [DOI] [PubMed] [Google Scholar]
- 13.Lin DC, Bullock CM, Ehlert FJ, Chen JL, Tian H, Zhou QY. Identification and molecular characterization of two closely related G protein‐coupled receptors activated by prokineticins/endocrine gland vascular endothelial growth factor. J Biol Chem. 2002; 277:19276-19280 [DOI] [PubMed] [Google Scholar]
- 14.Soga T, Matsumoto S, Oda T, Saito T, Hiyama H, Takasaki J, Kamohara M, Ohishi T, Matsushime H, Furuichi K. Molecular cloning and characterization of prokineticin receptors. Biochim Biophys Acta. 2002; 1579:173-179 [DOI] [PubMed] [Google Scholar]
- 15.Guilini C, Urayama K, Turkeri G, Dedeoglu DB, Kurose H, Messaddeq N, Nebigil CG. Divergent roles of prokineticin receptors in the endothelial cells: angiogenesis and fenestration. Am J Physiol Heart Circ Physiol. 2010; 298:H844-H852 [DOI] [PubMed] [Google Scholar]
- 16.Kisanuki YY, Hammer RE, Miyazaki J, Williams SC, Richardson JA, Yanagisawa M. Tie2‐Cre transgenic mice: a new model for endothelial cell‐lineage analysis in vivo. Dev Biol. 2001; 230:230-242 [DOI] [PubMed] [Google Scholar]
- 17.Boulberdaa M, Turkeri G, Urayama K, Dormishian M, Szatkowski C, Zimmer L, Messaddeq N, Laugel V, Dolle P, Nebigil CG. Genetic inactivation of prokineticin receptor‐1 leads to heart and kidney disorders. Arterioscler Thromb Vasc Biol. 2011; 31:842-850 [DOI] [PubMed] [Google Scholar]
- 18.van Beijnum JR, Rousch M, Castermans K, van der Linden E, Griffioen AW. Isolation of endothelial cells from fresh tissues. Nat Protoc. 2008; 3:1085-1091 [DOI] [PubMed] [Google Scholar]
- 19.Wang H, Wang AX, Liu Z, Barrett EJ. Insulin signaling stimulates insulin transport by bovine aortic endothelial cells. Diabetes. 2008; 57:540-547 [DOI] [PubMed] [Google Scholar]
- 20.Wang H, Liu Z, Li G, Barrett EJ. The vascular endothelial cell mediates insulin transport into skeletal muscle. Am J Physiol Endocrinol Metab. 2006; 291:E323-E332 [DOI] [PubMed] [Google Scholar]
- 21.Urayama K, Guilini C, Turkeri G, Takir S, Kurose H, Messaddeq N, Dierich A, Nebigil CG. Prokineticin receptor‐1 induces neovascularization and epicardial‐derived progenitor cell differentiation. Arterioscler Thromb Vasc Biol. 2008; 28:841-849 [DOI] [PubMed] [Google Scholar]
- 22.Urayama K, Dedeoglu DB, Guilini C, Frantz S, Ertl G, Messaddeq N, Nebigil CG. Transgenic myocardial overexpression of prokineticin receptor‐2 (GPR73B) induces hypertrophy and capillary vessel leakage. Cardiovasc Res. 2009; 81:28-37 [DOI] [PubMed] [Google Scholar]
- 23.Henrion D, Laher I, Laporte R, Bevan JA. Angiotensin II amplifies arterial contractile response to norepinephrine without increasing Ca++ influx: role of protein kinase c. J Pharmacol Exp Ther. 1992; 261:835-840 [PubMed] [Google Scholar]
- 24.Dowell FJ, Henrion D, Benessiano J, Poitevin P, Levy B. Chronic infusion of low‐dose angiotensin II potentiates the adrenergic response in vivo. J Hypertens. 1996; 14:177-182 [DOI] [PubMed] [Google Scholar]
- 25.Fisslthaler B, Benzing T, Busse R, Fleming I. Insulin enhances the expression of the endothelial nitric oxide synthase in native endothelial cells: a dual role for Akt and AP‐1. Nitric Oxide. 2003; 8:253-261 [DOI] [PubMed] [Google Scholar]
- 26.Champy MF, Selloum M, Zeitler V, Caradec C, Jung B, Rousseau S, Pouilly L, Sorg T, Auwerx J. Genetic background determines metabolic phenotypes in the mouse. Mamm Genome. 2008; 19:318-331 [DOI] [PubMed] [Google Scholar]
- 27.Wang H, Wang AX, Barrett EJ. Caveolin‐1 is required for vascular endothelial insulin uptake. Am J Physiol Endocrinol Metab. 2011; 300:E134-E144 [DOI] [PMC free article] [PubMed] [Google Scholar]
- 28.Pucci F, Venneri MA, Biziato D, Nonis A, Moi D, Sica A, Di Serio C, Naldini L, De Palma M. A distinguishing gene signature shared by tumor‐infiltrating Tie2‐expressing monocytes, blood “resident” monocytes, and embryonic macrophages suggests common functions and developmental relationships. Blood. 2009; 114:901-914 [DOI] [PubMed] [Google Scholar]
- 29.Tang Y, Harrington A, Yang X, Friesel RE, Liaw L. The contribution of the Tie2+ lineage to primitive and definitive hematopoietic cells. Genesis. 2010; 48:563-567 [DOI] [PMC free article] [PubMed] [Google Scholar]
- 30.Yang YJ, Hope ID, Ader M, Bergman RN. Insulin transport across capillaries is rate limiting for insulin action in dogs. J Clin Invest. 1989; 84:1620-1628 [DOI] [PMC free article] [PubMed] [Google Scholar]
- 31.Rask‐Madsen C, King GL. Endothelium‐dependent delivery of insulin to muscle interstitium. Cell Metab. 2011; 13:236-238 [DOI] [PMC free article] [PubMed] [Google Scholar]
- 32.Liu J, Wang XB, Park DS, Lisanti MP. Caveolin‐1 expression enhances endothelial capillary tubule formation. J Biol Chem. 2002; 277:10661-10668 [DOI] [PubMed] [Google Scholar]
- 33.Calizo RC, Scarlata S. A role for G‐proteins in directing G‐protein‐coupled receptor‐caveolae localization. Biochemistry. 2012; 51:9513-9523 [DOI] [PMC free article] [PubMed] [Google Scholar]
- 34.Khare R, Chen CY, Weaver EA, Barry MA. Advances and future challenges in adenoviral vector pharmacology and targeting. Curr Gene Ther. 2011; 11:241-258 [DOI] [PMC free article] [PubMed] [Google Scholar]
- 35.Khurana R, Simons M, Martin JF, Zachary IC. Role of angiogenesis in cardiovascular disease: a critical appraisal. Circulation. 2005; 112:1813-1824 [DOI] [PubMed] [Google Scholar]
- 36.Brouillet S, Hoffmann P, Benharouga M, Salomon A, Schaal JP, Feige JJ, Alfaidy N. Molecular characterization of EG‐VEGF‐mediated angiogenesis: differential effects on microvascular and macrovascular endothelial cells. Mol Biol Cell. 2010; 21:2832-2843 [DOI] [PMC free article] [PubMed] [Google Scholar]
- 37.Li W, Mital S, Ojaimi C, Csiszar A, Kaley G, Hintze TH. Premature death and age‐related cardiac dysfunction in male eNOS‐knockout mice. J Mol Cell Cardiol. 2004; 37:671-680 [DOI] [PubMed] [Google Scholar]
- 38.Tabit CE, Shenouda SM, Holbrook M, Fetterman JL, Kiani S, Frame AA, Kluge MA, Held A, Dohadwala MM, Gokce N, Farb MG, Rosenzweig J, Ruderman N, Vita JA, Hamburg NM. Protein kinase C‐beta contributes to impaired endothelial insulin signaling in humans with diabetes mellitus. Circulation. 2013; 127:86-95 [DOI] [PMC free article] [PubMed] [Google Scholar]
- 39.Duncan ER, Crossey PA, Walker S, Anilkumar N, Poston L, Douglas G, Ezzat VA, Wheatcroft SB, Shah AM, Kearney MT. Effect of endothelium‐specific insulin resistance on endothelial function in vivo. Diabetes. 2008; 57:3307-3314 [DOI] [PMC free article] [PubMed] [Google Scholar]
- 40.Razani B, Lisanti MP. Caveolin‐deficient mice: insights into caveolar function human disease. J Clin Invest. 2001; 108:1553-1561 [DOI] [PMC free article] [PubMed] [Google Scholar]
- 41.Cohen AW, Park DS, Woodman SE, Williams TM, Chandra M, Shirani J, Pereira de Souza A, Kitsis RN, Russell RG, Weiss LM, Tang B, Jelicks LA, Factor SM, Shtutin V, Tanowitz HB, Lisanti MP. Caveolin‐1 null mice develop cardiac hypertrophy with hyperactivation of p42/44 MAP kinase in cardiac fibroblasts. Am J Physiol Cell Physiol. 2003; 284:C457-C474 [DOI] [PubMed] [Google Scholar]
- 42.Cohen AW, Razani B, Wang XB, Combs TP, Williams TM, Scherer PE, Lisanti MP. Caveolin‐1‐deficient mice show insulin resistance and defective insulin receptor protein expression in adipose tissue. Am J Physiol Cell Physiol. 2003; 285:C222-C235 [DOI] [PubMed] [Google Scholar]
- 43.Moriyama T, Tsuruta Y, Shimizu A, Itabashi M, Takei T, Horita S, Uchida K, Nitta K. The significance of caveolae in the glomeruli in glomerular disease. J Clin Pathol. 2011; 64:504-509 [DOI] [PubMed] [Google Scholar]
- 44.Rupnick MA, Panigrahy D, Zhang CY, Dallabrida SM, Lowell BB, Langer R, Folkman MJ. Adipose tissue mass can be regulated through the vasculature. Proc Natl Acad Sci USA. 2002; 99:10730-10735 [DOI] [PMC free article] [PubMed] [Google Scholar]
- 45.Guo T, Bond ND, Jou W, Gavrilova O, Portas J, McPherron AC. Myostatin inhibition prevents diabetes and hyperphagia in a mouse model of lipodystrophy. Diabetes. 2012; 61:2414-2423 [DOI] [PMC free article] [PubMed] [Google Scholar]
- 46.Savage DB, O'Rahilly S. Leptin therapy in lipodystrophy. Diabetologia. 2010; 53:7-9 [DOI] [PubMed] [Google Scholar]
- 47.Dell'Era P, Ronca R, Coco L, Nicoli S, Metra M, Presta M. Fibroblast growth factor receptor‐1 is essential for in vitro cardiomyocyte development. Circ Res. 2003; 93:414-420 [DOI] [PubMed] [Google Scholar]
- 48.Bjarnegard M, Enge M, Norlin J, Gustafsdottir S, Fredriksson S, Abramsson A, Takemoto M, Gustafsson E, Fassler R, Betsholtz C. Endothelium‐specific ablation of PDGFB leads to pericyte loss and glomerular, cardiac and placental abnormalities. Development. 2004; 131:1847-1857 [DOI] [PubMed] [Google Scholar]
- 49.Sano H, Ueda Y, Takakura N, Takemura G, Doi T, Kataoka H, Murayama T, Xu Y, Sudo T, Nishikawa S, Fujiwara H, Kita T, Yokode M. Blockade of platelet‐derived growth factor receptor‐beta pathway induces apoptosis of vascular endothelial cells and disrupts glomerular capillary formation in neonatal mice. Am J Pathol. 2002; 161:135-143 [DOI] [PMC free article] [PubMed] [Google Scholar]
- 50.Leveen P, Pekny M, Gebre‐Medhin S, Swolin B, Larsson E, Betsholtz C. Mice deficient for PDGF B show renal, cardiovascular, and hematological abnormalities. Genes Dev. 1994; 8:1875-1887 [DOI] [PubMed] [Google Scholar]
- 51.Duan J, Zhang HY, Adkins SD, Ren BH, Norby FL, Zhang X, Benoit JN, Epstein PN, Ren J. Impaired cardiac function and IGF‐I response in myocytes from calmodulin‐diabetic mice: role of Akt and RhoA. Am J Physiol Endocrinol Metab. 2003; 284:E366-E376 [DOI] [PubMed] [Google Scholar]
- 52.Schilling JD, Mann DL. Diabetic cardiomyopathy: bench to bedside. Heart Fail Clin. 2012; 8:619-631 [DOI] [PMC free article] [PubMed] [Google Scholar]
- 53.Wittmann I, Molnar GA, Degrell P, Wagner Z, Tamasko M, Laczy B, Brasnyo P, Wagner L, Nagy J. Prevention and treatment of diabetic nephropathy. Diabetes Res Clin Pract. 2005; 68suppl 1:S36-S42 [DOI] [PubMed] [Google Scholar]
- 54.Abraham MI, McAteer JA, Kempson SA. Insulin stimulates phosphate transport in opossum kidney epithelial cells. Am J Physiol. 1990; 258:F1592-F1598 [DOI] [PubMed] [Google Scholar]
- 55.Choke E, Cockerill GW, Laing K, Dawson J, Wilson WR, Loftus IM, Thompson MM. Whole genome‐expression profiling reveals a role for immune and inflammatory response in abdominal aortic aneurysm rupture. Eur J Vasc Endovasc Surg. 2009; 37:305-310 [DOI] [PubMed] [Google Scholar]
- 56.Beale K, Gardiner JV, Bewick GA, Hostomska K, Patel NA, Hussain SS, Jayasena CN, Ebling FJ, Jethwa PH, Prosser HM, Lattanzi R, Negri L, Ghatei MA, Bloom SR, Dhillo WS. Peripheral administration of prokineticin 2 potently reduces food intake and body weight in mice via the brainstem. Br J Pharmacol. 2013; 168:403-410 [DOI] [PMC free article] [PubMed] [Google Scholar]