Abstract
Pancreatic cancer (PC) remains one of the most lethal human malignancies with poor prognosis. Despite all advances in preclinical research, there have not been significant translation of novel therapies into the clinics. The development of genetically engineered mouse (GEM) models that produce spontaneous pancreatic adenocarcinoma (PDAC) have increased our understanding of the pathogenesis of the disease. Although these PDAC mouse models are ideal for studying potential therapies and specific genetic mutations, there is a need for developing syngeneic cell lines from these models. In this study, we describe the successful establishment and characterization of three cell lines derived from two (PDAC) mouse models. The cell line UN-KC-6141 was derived from a pancreatic tumor of a KrasG12D;Pdx1-Cre (KC) mouse at 50 weeks of age, whereas UN-KPC-960 and UN-KPC-961 cell lines were derived from pancreatic tumors of KrasG12D;Trp53R172H;Pdx1-Cre (KPC) mice at 17 weeks of age. The cancer mutations of these parent mice carried over to the daughter cell lines (i.e. KrasG12D mutation was observed in all three cell lines while Trp53 mutation was observed only in KPC cell lines). The cell lines showed typical cobblestone epithelial morphology in culture, and unlike the previously established mouse PDAC cell line Panc02, expressed the ductal marker CK19. Furthermore, these cell lines expressed the epithelial-mesenchymal markers E-cadherin and N-cadherin, and also, Muc1 and Muc4 mucins. In addition, these cell lines were resistant to the chemotherapeutic drug Gemcitabine. Their implantation in vivo produced subcutaneous as well as tumors in the pancreas (orthotopic). The genetic mutations in these cell lines mimic the genetic compendium of human PDAC, which make them valuable models with a high potential of translational relevance for examining diagnostic markers and therapeutic drugs.
Introduction
Despite many advances in the understanding of molecular mechanisms involved in pancreatic cancer (PC) pathogenesis over the last four decades, the disease remains one of the top malignancies with worst prognosis [1]. These grim statistics are a constant reminder of the urgent need for elucidating yet undiscovered mechanisms of PC pathology that will contribute to improved diagnosis and treatment regimens. For this purpose, developing preclinical models is of vital importance, because they are critical for evaluating novel therapeutic strategies [2]. Xenograft tumors in athymic nude mice are useful preclinical models, but they cannot provide the role of immune mechanisms that may add to or interfere with the action of the therapeutic candidates. More recently, genetically engineered mice (GEM) models that produce spontaneous pancreatic adenocarcinomas (PDAC) have greatly advanced our understanding of PC pathogenesis and also, allowed the examination of novel therapeutic approaches [3]–[6]. In addition, syngeneic cell lines can be isolated from pancreatic tumors produced by GEM models and used for in vitro and in vivo screening assays. The analysis of functions and characteristics of specific genetic mutations and PC biomarkers present in these cell lines can shed light on the design of promising diagnostic and therapeutic strategies.
Mutations in KRAS, CDKN2A, TP53, and SMAD4/DPC4 genes are commonly observed in PDAC tumors from PC patients [7]. In consideration of these results, several mouse models that produce spontaneous PDAC, have been engineered in the last decade [3], [4], [6]. The present study focuses on mice carrying Kras and Trp53 mutations. The role of oncogenic Ras in PC was examined by directing endogenous expression of KrasG12D in the progenitor cells of the pancreas in KrasG12D;Pdx1-Cre (KC) mice [3], whereas the role of the endogenous expression of Trp53R172H and KrasG12D was examined in the pancreas of KrasG12D;Trp53R172H;Pdx1-Cre (KPC) mice [4]. The results indicate that the spontaneous pancreatic tumors produced by these mouse models recapitulate the clinical, histopathological and genomic features of human PDAC.
Mouse PDAC cell lines with greater clinical relevance to PC are highly needed. The currently available Panc02 cell line has been used over the past three decades [8]. It was derived from PDAC tumors induced by implanting 3-methyl-cholanthrene (3-MCA)-saturated threads of cotton in the pancreas of C57BL/6 mice. Despite its widespread use in evaluating various therapeutic strategies, Panc02 cells lack strong clinical significance for PC due to absence of mutational spectrum when compared to human disease. Consequently, success in translating therapies indicated by this model has been limited. In this manuscript, we describe the generation and characterization of three new PDAC cell lines derived from spontaneous mouse models of PC. One cell line was derived from a KC mouse at 50 weeks age, and two others were derived from KPC mice at 17 weeks of age. The successful establishment and in vitro and in vivo characterization of these cell lines are comprehensively described, including markers currently known for pancreatic tumors.
Materials and Methods
Establishment of Cell Lines
The complete medium consisted of DMEM containing heat inactivated FBS, L-Glutamine (200 mM), 100x non-essential amino acids (100 mM), sodium bicarbonate, HEPES buffer, Gentamicin (50 mg/ml), and Penicillin/Streptomycin (100 µg/ml). Immediately after resecting the tumor, 200 mg of pancreatic tumor tissue was transferred into a petri dish containing sterile PBS and Gentamicin (20 µg/ml).
The collected tissues were washed 3 times with PBS-gentamicin and transferred into a petri dish containing the complete medium. The tumor was finely-minced with a sterile scalpel and transferred into a sterile centrifuge tube with the complete medium containing Collagenase P (Roche, Indianapolis, IN) (10 mg/ml).The mixture was incubated at 37°C for 30 min. The tubes were inverted every three min to ensure proper mixing. Following two washing cycles in complete medium, the pellet obtained after centrifugation was suspended in the complete medium. After letting the tube stand for 2 min, cell suspension without tissue debris was transferred into a new sterile 10 cm Petri dish.
After incubating overnight at 37°C in 5% CO2, the medium was replaced with fresh medium. Cells were trypsinized once confluent. To prevent the growth of fibroblasts, differential trypsinization was carried out, where trypsin was added to the cells and after 10 sec, the cells were washed with PBS and fresh medium was added. Additionally, medium was supplemented with cholera toxin (400 ng/ml) for the first 7 passages as it has been previously reported that it has an enhanced mitogenic effect on epithelial cells, but not on fibroblast cells [9]. After 10 passages, the cell lines were transferred to normal complete medium (i.e. DMEM medium supplemented with 10% FBS, 100 µg/ml penicillin, 100 µg/ml streptomycin) and maintained at 37°C and 5% CO2 in a humidified incubator. Three cell lines were established successfully. The cell line derived from a KrasG12D;Pdx1-Cre (KC) mouse was named UN-KC-6141 and the two cell lines derived from KrasG12D;Trp53R172H;Pdx1-Cre (KPC) mice were named UN-KPC-960 and UN-KPC-961 (UN designates University of Nebraska Medical Center). In vitro characterization and tumorigenic studies were done after 35 passages in cell culture. The murine PDAC cell line Panc02 was included in the in vitro functional assays.
Sequencing of Cell Lines for Kras and p53 Mutations
The sub-confluent cultures of UN-KC-6141, UN-KPC-960, and UN-KPC-961 were lysed with cell lysis solution containing beta-mercaptoethanol and total RNA was isolated with RNeasy Minikit (Qiagen, Germantown, MD). cDNA was synthesized from total RNA using oligo(dT)18 primer and SuperScript II reverse transcriptase (Life technologies™, Carlsbad, CA). PCR amplification of murine Kras codon 12 (exon 1) and p53 codons 172 (Exon 5) was carried out by using set of primers to each gene (Kras-seqF:5'-ACTTGTGGTGGTTGGAGCTG-3', Kras-seqR:5'-TGACCTGCTGTGTCGAGAAT-3', p53-seqF: 5'-CACGTACTCTCCTCCCCTCA-3' and p53-seqR: 5'-ATTTCCTTCCACCCGGATAA-3'), which results in a 168 bp (Kras) and 229 bp (p53) PCR products. The PCR products were purified with PCR product purification kit (Qiagen, Germantown, MD) and the purified PCR products were sequenced using Kras-seqR:5'-TGACCTGCTGTGTCGAGAAT-3' for Kras and p53-seqF: 5'-CACGTACTCTCCTCCCCTCA-3' for p53 gene.
Growth Kinetics
For growth kinetics studies, each cell line was seeded in quadruplicate in a 96-well plate (1,000 cells/well) in complete medium. After overnight incubation, the medium was replaced with medium supplemented with 1% FBS and Penicillin/Streptomycin (100 µg/ml). Every day, 10 µl of the Cell Proliferation Reagent WST-1 (Roche, Indianapolis, IN) was added to each well and after 3 h of incubation, absorbance values were measured at 450 nm. Absorbance values were subtracted from values recorded at the reference wavelength (600 nm), as indicated by the manufacturer. The procedure was repeated for 7 days. The doubling time (TD) for each cell line was calculated during the exponential growth phase using the formula TD = 0.693t/ln(Nt/N0), where t = time difference in h, Nt = absorbance value at time t, and N0 = absorbance value at initial time [10].
Real Time PCR
RNA was isolated and purified from UN-KC-6141, UN-KPC-960, UN-KPC-961, Panc02, and NIH3T3 (mouse fibroblasts) cells using the RNeasy Minikit (Qiagen, Germantown, MD). cDNA was synthesized from total RNA using oligo(dT)18 primer and SuperScript II reverse transcriptase (Life technologies™, Carlsbad, CA) as described by us in a previous publication [11]. Real-time PCR was carried out in the LightCycler 480 (Roche Diagnostics, Indianapolis, IN). The amplification was done in a two-step process (95°C for 5 min followed by 45 cycles of 95°C for 10 sec, 60°C for 10 sec, and 72°C for 10 sec) using the LightCycler 480 SYBR Green I Master Mix (Roche Diagnostics, Indianapolis, IN) and cDNA from each sample. GAPDH was used as the internal control gene to which all genes were normalized. The fold-change in gene expression of Amylase and CK19 mRNA in cancer cell lines were compared relative to mRNA levels extracted from normal mouse pancreas using the 2−ΔΔCt method, whereas the fold-change of Muc1 and Muc4 were compared relative to mRNA extracted from the mouse fibroblast cell line NIH3T3. The sequence of the primers used in this study are listed in Table 1 .
Table 1. Primer sequences used for real time PCR analysis.
| Mouse Gene | Primer Sequence |
| Amylase | FP – 5′-CAAAATGGTTCTCCCAAGGA-3′RP – 5′-ACATCTTCTCGCCATTCCAC-3′ |
| Cytokeratin 19 (CK19) | FP – 5′-ACCCTCCCGAGATTACAACC-3′RP- 5′-CAAGGCGTGTTCTGTCTCAA-3′ |
| Muc1 | FP-5′-CCCTACCTACCACACTCACGGACG-3′RP-5′-GTGGTCACCACAGCTGGGTTGGTA-3′ |
| Muc4 | FP-5′-GAGGGCTACTGTCACAATGGAGGC-3′RP-5′-AGGGTTCCGAAGAGGATCCCGTAG-3′ |
| Muc5AC | FP-5′-CCTCTCAGAGGAATGTGACTCTGCGC-3′RP-5′-CCAGGCAGCCACACTTCTCAACCT-3′ |
Antibodies
The anti-CK19 hybridoma (TROMA-III) developed by Dr. Rolf Kemler was obtained from the Developmental Studies Hybridoma Bank developed under the auspices of the NICHD and maintained at The University of Iowa (Iowa City, IA). Antibody against murine E-cadherin was obtained from Cell Signaling (Danvers, MA). N-cadherin antibody was a kind gift from Dr. Keith R. Johnson from UNMC (Omaha, NE). β-actin and Amylase antibodies were purchased from Sigma Aldrich (St. Louis, MO). For confocal studies the secondary antibodies conjugated to Alexa Fluor® (568, 488) were obtained from Life Technologies™ (Carlsbad, CA). The secondary antibodies conjugated to horseradish peroxidase used for western blot analysis were obtained from GE Healthcare Life Sciences (Uppsala, Sweden). Anti-mouse Muc1 antibody (mouse monoclonal antibody recognizing the cytoplasmic tail of Muc1) was purchased from Abcam® (Cambridge, MA, USA). The anti-Muc4 (4A-rabbit polyclonal) antibody was designed in this lab and developed by GenScript (Piscataway, NJ, USA) as has been described previously [12].
Confocal Microscopy
Protein expression was analyzed by confocal microscopy. 2×10⁵ cells suspended in complete medium were seeded on glass cover slips placed in a 12-well plate. The next day, cells were fixed in ice cold methanol. After washing in PBST and blocking with 10% goat serum (Jackson Immunoresearch Labs, West Grove, PA), the cells were incubated with antibodies for Amylase (1:500), CK19 (1:1,000), E-cadherin (1:50), N-cadherin (1:20), and Muc1 (1:100) overnight. They were washed four times with PBST, 5 min per wash. The cells were incubated with the respective secondary antibodies (mouse/rabbit) conjugated to Alexa Fluor (568, 488) (Life Technologies™, Carlsbad, CA) and after repeating the washing steps, the glass coverslips were mounted on glass slides with vectashield mounting medium (Vector Laboratories, Burlingame, CA). The cells were imaged on a laser confocal microscope LSM 510 (Carl Zeiss GmbH, Thornwood, NY) in the respective wavelengths at a magnification of ×63.
Western Blot Analysis
For western blot analysis, cells were seeded on each well of a 6-well plate in complete medium. At ∼80% confluency, cells were lysed with radioimmunoprecipitation assay buffer (RIPA) containing protease and phosphatase inhibitors. The lysates were subjected to several freeze-thaw cycles to ensure complete lysis. The concentration of lysates was determined with the micro–bicinchoninic acid protein estimation kit (Bio-Rad, Hercules, CA). The protein concentrations were adjusted and solutions were prepared under reducing conditions (i.e. β-mercaptoethanol). 2% SDS-agarose gels were used for analysis of Muc4 expression. 40 µg of protein lysates were loaded and the gel was run for 4 h at 100 V. E-cadherin and N-cadherin expression levels were analyzed by SDS-PAGE. 40 µg of protein lysates were loaded and separation was done at 80 mA for 1 h. Resolved proteins were transferred onto polyvinylidene difluoride membranes, blocked in 5% milk in PBS, and incubated with the primary antibodies overnight. After washing with PBST, the corresponding secondary antibodies were added and after repeating the washing steps, the proteins were detected by luminol (Thermo Scientific, Middletown, VA) after exposure to X-ray films.
Cytotoxic Assay
The cytotoxic effect of the chemotherapeutic drug Gemcitabine on KC and KPC cell lines was compared to the cytotoxic effect on Panc02. The injectable solution of Gemcitabine, GEMZAR® (Eli Lilly Company, Indianapolis, IN) was kindly provided by the pharmacy at the Lied Transplant Center at UNMC. For the cytotoxic assay, 1×10⁴ cells suspended in complete medium were seeded in each well of a 96-well plate. The next day, the cells were treated with different concentrations of Gemcitabine solution (100 nM-100 µM) in quadruplicate wells. After incubating the cells with Gemcitabine for 48 h, media containing thiazolyl blue tetrazolium bromide reagent (Sigma Aldrich, St Louis, MO) was added to the cells. After 4 h of incubation, the formazan crystals produced by metabolically active cells were dissolved with 100 µl of DMSO. Absorbance values at 540 nm were used to calculate cytotoxicity percentages. The half maximal inhibitory concentration (IC-50) of Gemcitabine was determined in each cell line from interpolating values in the graph (% Cytotoxicity vs. Gemcitabine Concentration).
Tumorigenicity studies
The tumorigenicity of the cell lines was determined after orthotopic implantation of the mouse PC cell lines (UN-KC-6141/UN-KPC-960/UN-KPC-961) into the head of the pancreas after 35 passages. Based on the mice background from where the cell lines were generated, UN-KC-6141 cells (1×10⁶) were injected in C57BL/6 mice, whereas UN-KPC-960 and UN-KPC-961 cells (1×10⁶) were injected in mixed background (i.e. B6.129) mice (N = 7). Mouse PC cells suspended in 50 µl sterile PBS were injected orthotopically using the same procedure described by us [13], [14]. Subcutaneous tumor growth was evaluated with the UN-KPC-961 cell line only. 5×10⁶ cells were injected (N = 12) in mixed B6.129 background mice on the lateral chest. Tumor growth was monitored by palpation/Vernier caliper measurements in case of subcutaneous tumors. Throughout the experiment, animals were provided with food and water ad libitum and subjected to a 12-h dark/light cycle. Animal studies were performed in accordance with the U.S. Public Health Service "Guidelines for the Care and Use of Laboratory Animals" under an approved protocol by the University of Nebraska Medical Center Institutional Animal Care and Use Committee (IACUC). After euthanization, pancreatic tumors were dissected out, weighed and fixed in 10% formalin (Fisher Scientific, Fair Lawn, NJ) for H&E staining. Gross metastatic lesions were examined in distant organs and processed for histological analysis.
Hematoxylin and eosin staining (H&E)
After fixing tissues in 10% formalin for at least 48 h, the tissues were embedded in paraffin and serial tissue sections (4 μm thick) were cut. The sections were deparaffinized using EZ-DeWaxTM (Bio genex, San Roman CA, USA) and rehydrated progressively. Afterwards, the sections were stained with hematoxylin and eosin (H&E) stains and examined by a certified pathologist.
Statistics
Significant differences in the experimental values were determined by calculating p-values using the JMP® Statistical Discovery Software (Cary, NC). A Student’s t-test was used to calculate the corresponding p-value (p-values < 0.05 were considered statistically significant).
Results
In vitro establishment of KC and KPC cell lines
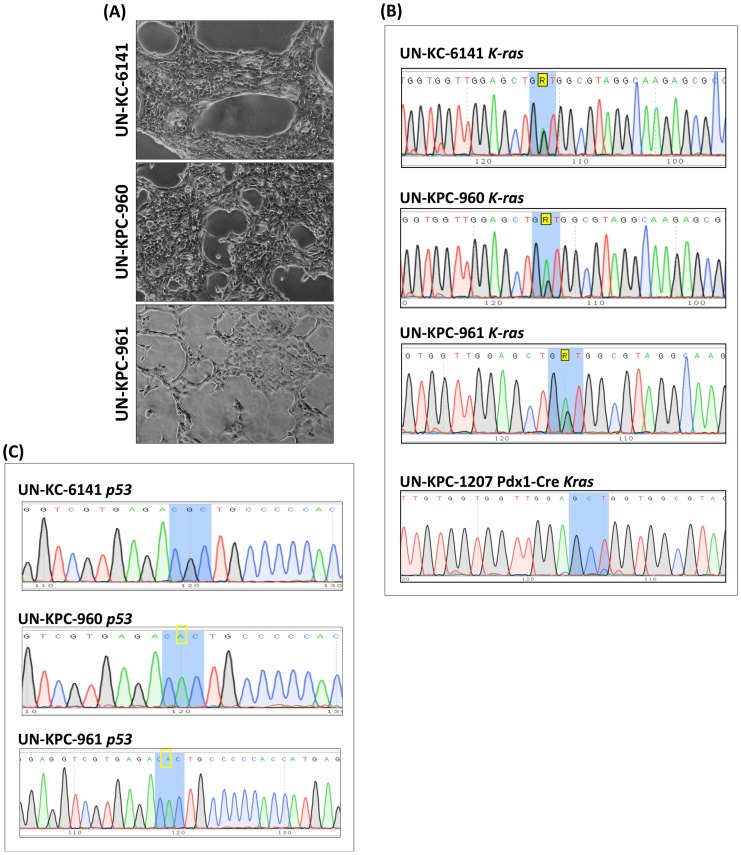
Mouse PC cell lines were successfully generated from the spontaneous pancreatic tumors produced by the KrasG12D;Pdx1-Cre (KC) and the KrasG12D;Trp53 R172H;Pdx1-Cre (KPC) mice at 50 weeks and 17 weeks of age, respectively. One cell line derived from the KC mice was named UN-KC-6141, and two other cell lines derived from the KPC mice were named UN-KPC-960 and UN-KPC-961. All three cell lines grew for over 50 passages in normal media with no sign of senescence. Monolayer cultures of all three cell lines showed typical cobblestone morphology with closed contact island formation ( Fig 1A ). To verify that these cell lines maintained the genetic mutations of their respective parental mice (KC and KPC), the mutational status of the Kras ( Fig. 1B ) and Trp53 ( Fig. 1C ) loci was examined. As expected, all three cell lines carried the KrasG12D point mutation, whereas UN-KPC-960 and UN-KPC-961 carried the Trp53R172H activating mutation.
Figure 1. In vitro establishment of KC and KPC cell lines.
(A) Inverted microscope images (4X) of UN-KC-6141, UN-KPC-960, and UN-KPC-961 PDAC cell lines after 35 passages. The three cell lines displayed typical cobblestone epithelial morphology. Genetic sequence analysis of (B) KrasG12D and (C) Trp53R172H mutation in mouse PC cell lines. Blue shaded areas represent the codon where the mutation is located. A yellow rectangle indicate the nucleotide responsible for the mutation. A pancreas from a Pdx1-Cre mouse (mouse tag UN-KPC-1207) was used as a negative control for Kras mutation.
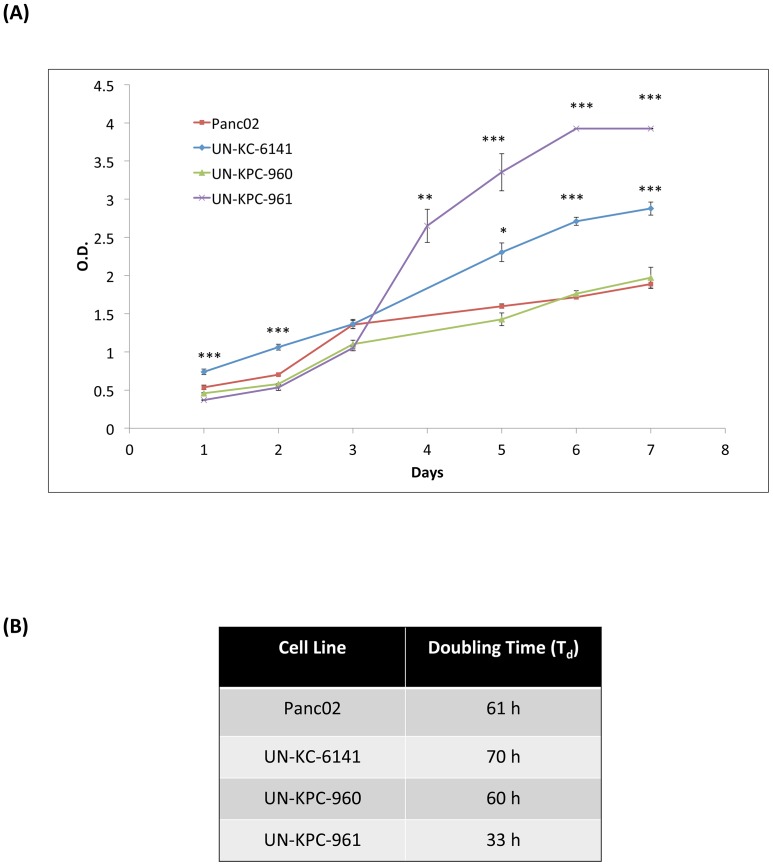
The growth kinetics of these three mouse PC cell lines were compared with Panc02 cells ( Fig 2A ). UN-KPC-961 cells proliferated the fastest with a doubling time (TD) of 33 h (p < 0.0001 compared to Panc02). UN-KPC-960 and Panc02 grew at similar rates (TD ≈ 60 h), while UN-KC-6141 showed the slowest growth rate (TD of 70 h) ( Fig 2B ).
Figure 2. Growth kinetics of mouse PDAC cell lines.
(A) Cells were seeded in quadruplicate wells of 96-well plates and their growth was followed every day by measuring absorbance after incubation with WST-1 reagent. Data is represented as the mean absorbance (λSample = 450 nm, λRef = 600 nm) of four replicates ± standard error. Statistics were calculated in comparison to the growth curve for Panc02 (*p < 0.01, **p < 0.001, ***p < 0.0001). (B) Doubling time (TD) of cell population was calculated using the equation TD = (0.693t)/ln(Nt/N0) where t = time difference in h during log phase, Nt = absorbance value at time t, and N0 = absorbance value at initial time.
KC and KPC-derived cell lines have ductal-like characteristics
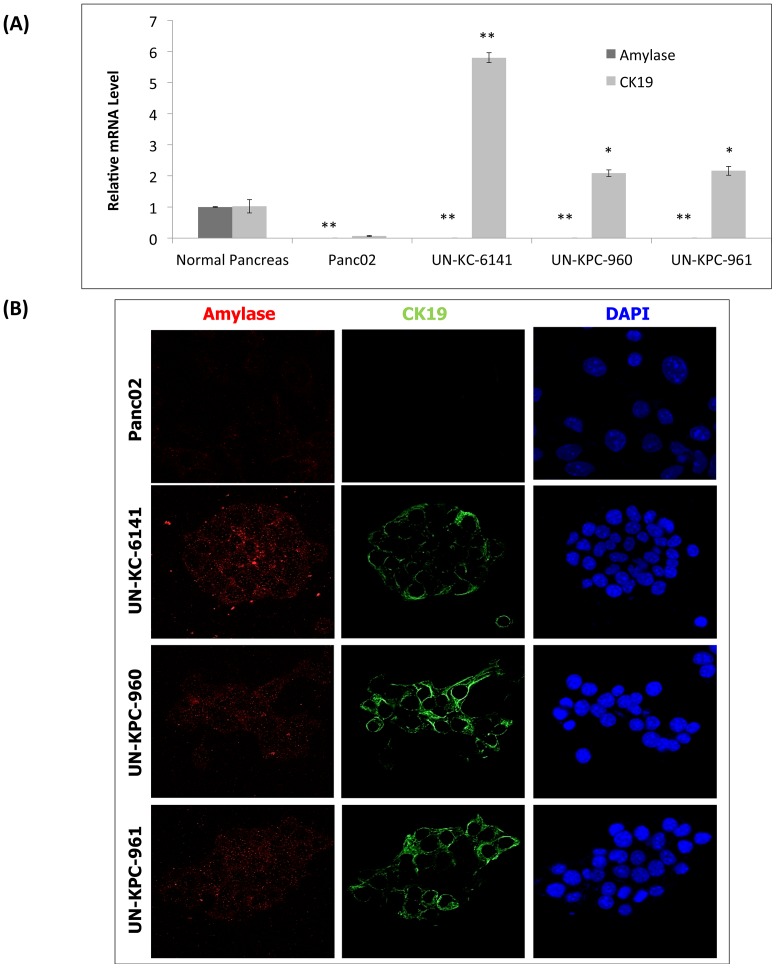
PDACs are thought to arise from the epithelial cells of the pancreatic duct [7]. The exocrine pancreas contains both acinar and ductal cells. Pancreatic acinar cells are characterized by amylase expression and lack of expression of either cytokeratin 19 (CK19) or mucins, and the ductal cells are characterized by expression of CK19 and mucins but no expression of amylase [15], [16]. Indeed, previous studies have reported pancreatic tumors from KC and KPC mice expressed CK19 and frequently, mucin, indicating their ductal heritage [3], [4]. To validate whether our KC and KPC derived-cell lines had these ductal characteristics, we examined amylase and CK19 expression by real time PCR and confocal microscopy. Panc02 cells were included in these analyses for comparison, and normal pancreatic tissue was used for estimating relative gene expression. Real-time PCR experiments showed high expression of the CK19 ductal marker in our three new PDAC cell lines (p < 0.005) compared to Panc02 ( Fig. 3A ). To our surprise, Panc02 cells did not show any CK19 expression, even though it has been referenced as a murine ductal PDAC cell line for nearly three decades [8]. None of the four cell lines showed amylase expression, whereas normal pancreas expressed this acinar marker. These results were further confirmed by confocal microscopy analysis ( Fig. 3B ).
Figure 3. Ductal characteristics of KC and KPC cell lines.
(A) Real-time PCR analysis of Amylase and CK19 in mouse PDAC cells. These mRNA transcripts were compared relative to the mRNA levels in normal pancreas. The data represents the mean fold increase of three replicates ± standard error. Statistics were calculated in comparison to normal pancreas (*p < 0.005, **p < 0.0001). (B) The protein expression of Amylase and CK19 were evaluated on mouse PDAC cell lines by confocal analysis. Amylase was visualized after staining with a secondary antibody conjugated to Alexa Fluor® 568 (Red Fluorescent) and CK19 was visualized after staining with Alexa Fluor® 488 (Green Fluorescent). Cell nuclei were stained with DAPI.
KC and KPC cell lines have epithelial-mesenchymal characteristics
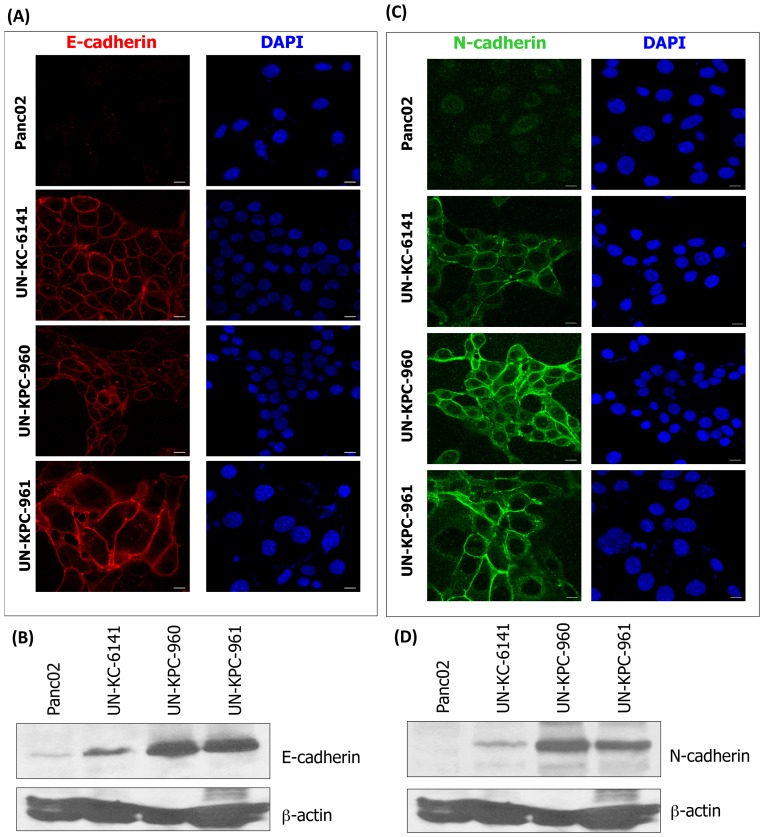
The epithelial-mesenchymal transition induces loss of cell adhesion, which corresponds to E-cadherin downregulation and increased expression of N-cadherin, leading to the initiation of PDAC metastasis [17]. We examined E-cadherin and N-cadherin expression by confocal microscopy and western blot analyses in the three newly-established KC and KPC cell lines. E-cadherin expression was observed in UN-KC-6141, UN-KPC-960, and UN-KPC-961 cells, indicative of their epithelial nature ( Fig. 4A-B ). In contrast, Panc02 cells showed minimal E-cadherin expression. The pattern of N-cadherin expression was similar, being more prominent in the KC and KPC cell lines, compared to the expression in Panc02 cells ( Fig. 4C-D ).
Figure 4. Epithelial-mesenchymal characteristics of KC and KPC cell lines.
(A) Confocal microscopy images of E-cadherin (Alexa Fluor® 568, Red Fluorescent) expression in mouse cell lines. Cell nuclei were stained with DAPI. (B) Western blot analysis of E-cadherin in mouse cell lines. Protein lysates were resolved by 10% SDS-PAGE. β-actin was used as loading control. (C) Confocal microsocopy images of N-cadherin (Alexa Fluor® 488, Green Fluorescent) expression in mouse cell lines. Cell nuclei were stained with DAPI. (D) Western blot analysis of N-cadherin in mouse cell lines. Protein lysates were resolved by 10% SDS-PAGE. β-actin was used as loading control.
KC and KPC cell lines express high levels of Muc1 and Muc4
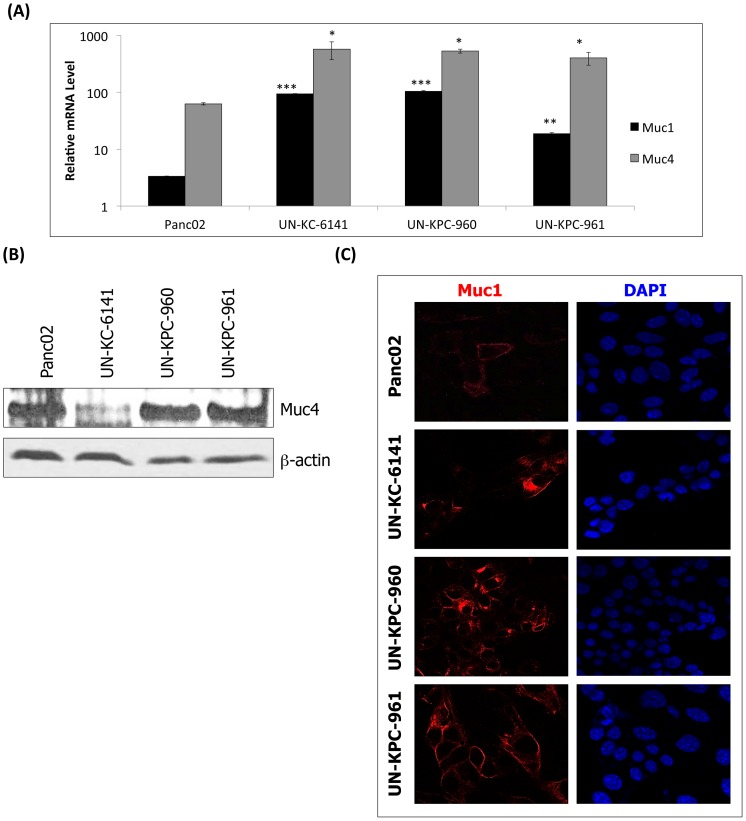
Different types of mucins are expressed in the pancreas during PC progression [12], [18]. Furthermore, PC precursor lesions in genetically engineered mouse PDAC models such as the KC and KPC mice, are known to produce mucins [3], [4]. Recently, we also have demonstrated that in the pancreas of KC mice, expression of Muc1, Muc4, and Muc5AC progressively increased in correlation with PDAC development [12]. We examined whether the expression of these mucins can be corroborated in the KC and KPC-derived cell lines. To this end, real-time PCR, western blot, and confocal microscopy analyses were conducted. The results indicated that relative transcript levels of the transmembrane mucins Muc1 (p < 0.001) and Muc4 (p < 0.05) were significantly higher in UN-KC-6141, UN-KPC-960 and UN-KPC-961 cells ( Fig. 5A ) compared to control cells (NIH3T3 fibroblasts). In Panc02 cells, the relative transcript levels of Muc1 and Muc4 were elevated, but they were not statistically significant. Nevertheless, Panc02 cells and the two cell lines derived from KPC mice showed higher levels of Muc4 protein than the KC-derived cell line ( Fig. 5B ). On the other hand, Muc1 protein in Panc02 was lower than in the KC and KPC-derived cells ( Fig. 5C ). To our surprise, Muc5AC was not detectable in any of the cell lines, either at transcript or at protein levels (data not shown), and this may be a consequence of evolutionary changes associated with cell culture.
Figure 5. Mucin expression in mouse PDAC cell lines.
(A) Real time PCR analysis of Muc1 and Muc4 in mouse PDAC cell lines. The mRNA transcripts were normalized to mRNA levels in the mouse fibroblast cell line NIH3T3. The data represents the mean fold increase of three replicates ± standard error. Statistical significances were calculated in comparison to NIH3T3 (*p < 0.05, **p < 0.001, ***p < 0.0001). (B) Western blot analysis of Muc4 in mouse cell lines. Protein lysates for Muc4 analysis were resolved by 2% SDS agarose gels. β-actin was used as a loading control and it was resolved in 10% SDS-PAGE. (C) Confocal microscopy images of Muc1 (Alexa Fluor® 568, Red Fluorescent) expression in mouse cell lines. Cell nuclei were stained with DAPI.
KC and KPC cell lines are resistant to Gemcitabine
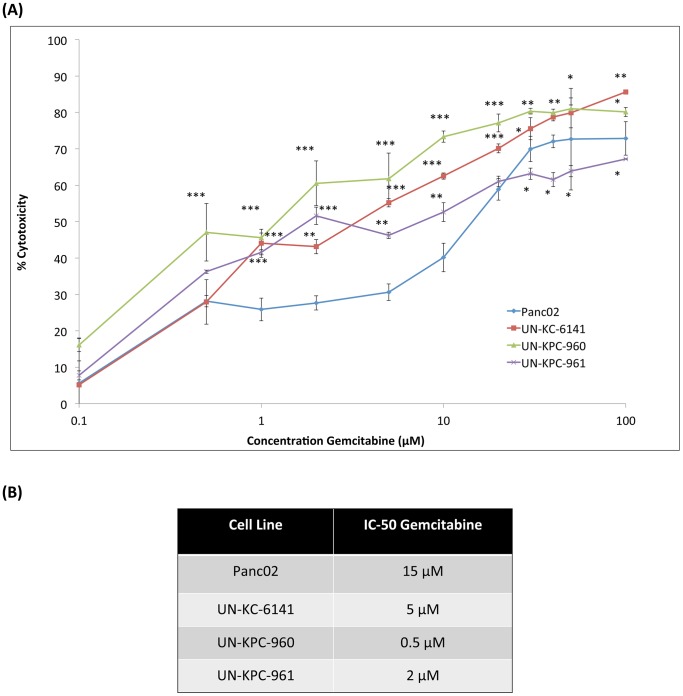
Despite recent reports that PC patients show greater survival when treated with FOLFIRINOX (a combination of oxaliplatin, irinotecan, fluorouracil and leucovorin) instead of Gemcitabine [19], the latter is still the most used drug in PC chemotherapy [20]. Therefore, using the MTT assay, we examined Gemcitabine cytotoxicity on UN-KC-6141, UN-KPC-960, UN-KPC-961 and Panc02 cells ( Fig. 6A ). Panc02 cells were the most Gemcitabine-resistant with a half maximal inhibitory concentration (IC-50) of 15 µM after 48 h of treatment ( Fig. 6B ). The IC-50 values of the KC and KPC cell lines ranged from 0.5 µM to 5 µM. Although Panc02 cells were more resistant to Gemcitabine, these IC-50 values are in the comparable range of human PC cells [21], [22]. Interestingly, at higher Gemcitabine concentrations (30–100 µM) ( Fig. 6A ), the UN-KPC-961 cells showed greater Gemcitabine resistance than the Panc02 cells.
Figure 6. Cytotoxic effects of Gemcitabine in mouse PDAC cell lines.
(A) Gemcitabine cytotoxicity in mouse PDAC cell lines was determined by the MTT cytotoxic assay. Cells were seeded in quadruplicate wells and incubated with different concentrations of Gemcitabine (100 nM–100 µM) for 48 h. After replacing media with the MTT reagent and dissolving the formazan crystals with DMSO, cytotoxicity was calculated based on the absorbance values (λ = 540nm) in cells treated with media only. The presented data are average of cytotoxicities in quadruplicate wells ± standard error. Statistical significance was calculated in comparison to Panc02 (*p < 0.01, **p < 0.001, ***p < 0.0001). (B) The half maximal inhibitory concentration (IC-50) of Gemcitabine in each cell line was determined after interpolation in the graphs of %Cytotoxicity vs. Concentration.
Transplanted KC and KPC cell lines induce pancreatic tumors in mice
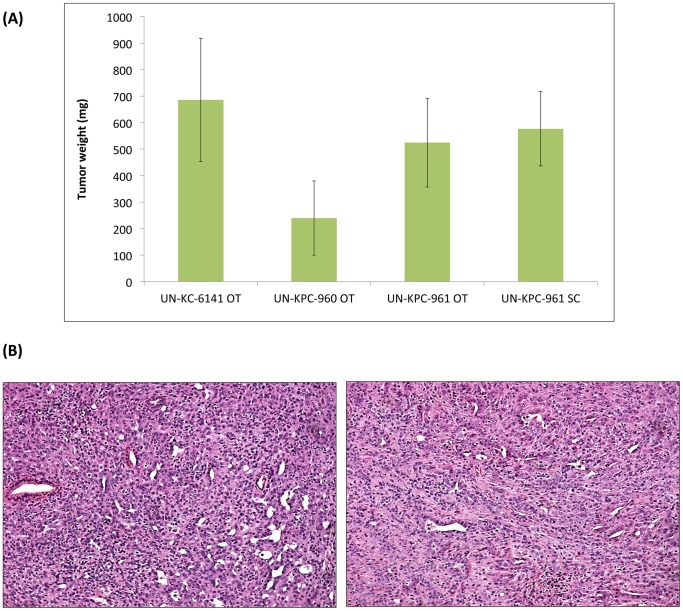
The establishment of the KC and KPC cell lines in culture provided the opportunity to examine their tumorigenicity in appropriate mouse background from which they were derived. The UN-KC-6141 cells were tested in the C57BL/6 mice, while UN-KPC-960 and UN-KPC-961 cells were examined in mice of mixed B6.129 background. One month after orthotopic implantation of UN-KC-6141 cells in C57BL/6 mice, tumors formed in their pancreas ( Fig. 7A ), and metastatic lesions in liver, spleen, small intestines, mesenteric lymph nodes and peritoneal wall were observed. Tumor incidence for UN-KC-6141 cells was 100%. The two KPC-derived cells (UN-KPC-960 and UN-KPC-961) also formed tumors after orthotopic implantation ( Fig. 7A ), but those appeared at slower rates and the tumors took over two months to grow. The comparatively slower tumor growth kinetics of the KPC cells may have been caused by genetic differences between KC and KPC cells, as well as the different backgrounds of their respective host mice. Interestingly, the UN-KPC-961 cells appeared to be more tumorigenic (tumor incidence 86%) than the UN-KPC-960 cells (tumor incidence 43%). These results are in agreement with their growth kinetics (i.e. UN-KPC-961 showed faster growth than UN-KPC-960). In addition, UN-KPC-961-derived tumors appeared to be more aggressive, showing metastasis to spleen, stomach, liver, and diaphragm, whereas the UN-KPC-960-derived tumors did not show any metastatic lesions. When UN-KPC-961 PC cells were injected subcutaneously into the mixed B6.129 background mice, all mice developed tumors in three weeks, but no metastases were observed. Figure 7A shows a comparison of tumors derived from these experiments. Although the average weights of the orthotopic tumors derived by the UN-KPC-960 cells were smaller, tumor weight differences across all groups were not statistically significant. Further, we also performed subcutaneous injection using UN-KC-6141 and UN-KPC-960 PC cells into two C57BL/6 and B6.129 background mice and all the mice developed tumors after 4 weeks (data not included).
Figure 7. Tumorigenicity of KC and KPC cell lines.
(A) The tumorigenic properties of UN-KC-6141, UN-KPC-960, and UN-KPC-961 cells were evaluated after orthotopic (OT) (N = 7) implantation of 1×10⁶ cells in the respective mice background. Subcutaneous (SC) injections of UN-KPC-961 cells (5×10⁶ cells) were also performed. OT tumors were grown for different time intervals: one month for UN-KC-6141 and two months for UN-KPC-960 and UN-KPC-961. SC tumors were grown for three weeks. Data is represented as the average weight of pancreatic tumors ± standard error. Differences in tumor size after mice euthanization were not statistically significant. (B) Hematoxylin & eosin stained tumor sections (10X) from UN-KPC-961 cells after OT implantation (left) and SC implantation (right). The tumors presented characteristics of poorly differentiated adenocarcinoma.
For PDAC, histological grading is assigned by the extent of glandular differentiation [23]. If over 95% of a tumor is composed of glands then it is classified as well differentiated, if that extent is 50–95%, a tumor is considered moderately differentiated, and if less than 50%, a tumor is described as poorly differentiated. Histologic analyses classified the KC and KPC-derived tumors as moderately to poorly differentiated tumors, because they did not show duct formation ( Fig. 7B ). In fact, most of these tumors presented characteristics of poorly differentiated (grade III) adenocarcinoma. These results are different from previous studies reporting that most spontaneous pancreatic tumors from KC and KPC mice show moderately well-differentiated to well-differentiated morphology [3], [4].
Discussion
Genetically engineered mouse models are presently a promising approach for understanding the pathogenesis and progression of PDAC and for evaluating novel therapeutic agents (natural/synthetic) that should translate to high clinical success [24]. Unfortunately, the generation and maintenance of these advanced models require a high cost and time investment. PDAC cell lines from these model mice should have a major role in facilitating screening and prioritization of the variables (e.g. study gene roles or novel therapies), before the ideas are evaluated in the more expensive mouse models.
To our knowledge, this is the first paper reporting the successful establishment and characterization of PDAC cell lines derived from KrasG12D;Pdx1-Cre (KC) and KrasG12D;Trp53R172H;Pdx1-Cre (KPC) mouse models. The three cell lines derived in these studies, named UN-KC-6141, UN-KPC-960, and UN-KPC-961, have been maintained in cell culture for over 50 passages without any sign of senescence. These cell lines show typical epithelial cobblestone morphology, and expressed high levels of epithelial and mesenchymal markers such as CK19, E-cadherin, N-cadherin, Muc1, and Muc4 ( Table 2 ). Although Panc02 has been classified as a PDAC cell line on the basis of histological analysis since its establishment three decades ago [8], we noted with interest that it does not express the ductal marker CK19, which raises questions about its phenotype ( Table 2 ). Furthermore, unlike the KC and KPC cell lines, Panc02 cells did not express E-cadherin and N-cadherin. As differential levels of these cadherins have a major role in metastasis [17], these cell lines should be useful for evaluating various therapeutic agents or study the fuction of various genes by manipulation.
Table 2. Summary of protein expression in murine PDAC cell lines.
| Cell Line | Amylase | CK19 | E-cadherin | N-cadherin | Muc1 | Muc4 | Muc5AC |
| Panc02 | – | – | – | – | + | + | – |
| UN-KC-6141 | – | + | + | + | + | + | – |
| UN-KPC-960 | – | + | + | + | + | + | – |
| UN-KPC-961 | – | + | + | + | + | + | – |
The most commonly occurring mutations in PDAC include those in the KRAS, CDKN2A, TP53, and SMAD4/DPC4 genes [7]. Mutations in the KRAS gene are present in 90% of PDAC [25], TP53 mutations occur in ∼75% of PDAC [26], and 55% of pancreatic tumors have SMAD4/DPC4 deletions or mutations [27]. The KC and KPC-derived cell lines described here did not suffer from evolutionary changes in their cancer genes. Sequencing of these cell lines for point mutations in KRAS and P53 genes revealed the presence of Kras point mutations (Gly-Asp) in all the KC and KPC-derived cell lines, and the Trp53 mutation (R172H) was only present only in the KPC cell lines. Two recent publications have reported the well-established Panc02 cell line has a Smad4 mutation, but both Kras and Trp53 mutations are absent [28], [29]. Considering that human PDAC show higher frequency of KRAS and TP53 mutations and ductal characteristics, the newly derived murine PDAC cell lines UN-KC-6141, UN-KPC-960, and UN-KPC-961 should be very valuable preclinical studies and have excellent translational significance.
Gemcitabine is the most used chemotherapeutic treatment for PC patients, but tumors may acquire resistance, as evidenced by the poor survival statistics [30]. Some studies have shown that epithelial to mesenchymal transition contributes to drug resistance in PC cells [31], [32]. In one of these studies it was documented that E-cadherin levels in cancer cells have an inverse correlation with drug resistance [32]. This may explain why Panc02 was more resistant to the effects of Gemcitabine (IC-50 = 15 µM) when compared to the spontaneous PDAC cell lines (IC-50s = 0.5–5 µM). The expression levels of E-cadherin in UN-KC-6141, UN-KPC-960, and UN-KPC-961 cells correlated with decreased drug resistance. It is important to note that even though the KC and KPC-derived PDAC cell lines were not as resistant to Gemcitabine as the Panc02 cells, these cytotoxicity levels are in the range of those found in human PDAC cell lines [21], [22].
In conclusion, the UN-KC-6141, UN-KPC-960, and UN-KPC-961 cells described here represent a valuable tool for yielding a better understanding of PC pathogenesis and to study novel treatments for this lethal disease. The genotypic and phenotypic characteristics of these novel cell lines mimic human PDAC, which make them valuable models with significant translational relevance.
Acknowledgments
We would like to thank Dr. Keith Johnson for providing N-cadherin antibody. We also thank the pharmacy at the Lied Transplant Center for providing Gemcitabine for the in vitro experiments and Janice A. Tayor and James R. Talaska of the Confocal Laser Scanning Microscope Core Facility at UNMC.
Funding Statement
The work was, in part, supported by grants from the NIH (TMEN U54 CA163120, EDRN UO1, CA111294, SPORE P50 CA127297, RO1 CA133774, RO1 CA78590, and RO3 CA167342). The funders had no role in study design, data collection and analysis, decision to publish, or preparation of the manuscript.
References
- 1.SEER Stat Fact Sheets: Pancreas. Available: http://seer.cancer.gov/statfacts/html/pancreas.html. Accessed 25 Jun 2013.
- 2. Singh M, Johnson L (2006) Using genetically engineered mouse models of cancer to aid drug development: an industry perspective. Clin Cancer Res 12: 5312–5328. [DOI] [PubMed] [Google Scholar]
- 3. Hingorani SR, Petricoin EF, Maitra A, Rajapakse V, King C, et al. (2003) Preinvasive and invasive ductal pancreatic cancer and its early detection in the mouse. Cancer Cell 4: 437–450. [DOI] [PubMed] [Google Scholar]
- 4. Hingorani SR, Wang L, Multani AS, Combs C, Deramaudt TB, et al. (2005) Trp53R172H and KrasG12D cooperate to promote chromosomal instability and widely metastatic pancreatic ductal adenocarcinoma in mice. Cancer Cell 7: 469–483. [DOI] [PubMed] [Google Scholar]
- 5. di Magliano MP, Logsdon CD (2013) Roles for KRAS in Pancreatic Tumor Development and Progression. Gastroenterology 144: 1220–1229. [DOI] [PMC free article] [PubMed] [Google Scholar]
- 6. Guerra C, Barbacid M (2013) Genetically engineered mouse models of pancreatic adenocarcinoma. Mol Oncol 7: 232–247. [DOI] [PMC free article] [PubMed] [Google Scholar]
- 7. Bardeesy N, DePinho RA (2002) Pancreatic cancer biology and genetics. Nat Rev Cancer 2: 897–909. [DOI] [PubMed] [Google Scholar]
- 8. Corbett TH, Roberts BJ, Leopold WR, Peckham JC, Wilkoff LJ, et al. (1984) Induction and chemotherapeutic response of two transplantable ductal adenocarcinomas of the pancreas in C57BL/6 mice. Cancer Res 44: 717–726. [PubMed] [Google Scholar]
- 9. Taylor-Papadimitriou J, Purkis P, Fentiman IS (1980) Cholera toxin and analogues of cyclic AMP stimulate the growth of cultured human mammary epithelial cells. J Cell Physiol 102: 317–321. [DOI] [PubMed] [Google Scholar]
- 10. Bafna S, Singh AP, Moniaux N, Eudy JD, Meza JL, et al. (2008) MUC4, a multifunctional transmembrane glycoprotein, induces oncogenic transformation of NIH3T3 mouse fibroblast cells. Cancer Res 68: 9231–9238. [DOI] [PMC free article] [PubMed] [Google Scholar]
- 11. Torres MP, Ponnusamy MP, Chakraborty S, Smith LM, Das S, et al. (2010) Effects of thymoquinone in the expression of mucin 4 in pancreatic cancer cells: implications for the development of novel cancer therapies. Mol Cancer Ther 9: 1419–1431. [DOI] [PMC free article] [PubMed] [Google Scholar]
- 12. Rachagani S, Torres MP, Kumar S, Haridas D, Baine M, et al. (2012) Mucin (Muc) expression during pancreatic cancer progression in spontaneous mouse model: potential implications for diagnosis and therapy. J Hematol Oncol 5: 68. [DOI] [PMC free article] [PubMed] [Google Scholar]
- 13. Moniaux N, Chaturvedi P, Varshney GC, Meza JL, Rodriguez-Sierra JF, et al. (2007) Human MUC4 mucin induces ultra-structural changes and tumorigenicity in pancreatic cancer cells. Br J Cancer 97: 345–357. [DOI] [PMC free article] [PubMed] [Google Scholar]
- 14. Singh AP, Moniaux N, Chauhan SC, Meza JL, Batra SK (2004) Inhibition of MUC4 expression suppresses pancreatic tumor cell growth and metastasis. Cancer Res 64: 622–630. [DOI] [PubMed] [Google Scholar]
- 15. Bouwens L, Braet F, Heimberg H (1995) Identification of rat pancreatic duct cells by their expression of cytokeratins 7, 19, and 20 in vivo and after isolation and culture. J Histochem Cytochem 43: 245–253. [DOI] [PubMed] [Google Scholar]
- 16. Hall PA, Lemoine NR (1992) Rapid acinar to ductal transdifferentiation in cultured human exocrine pancreas. J Pathol 166: 97–103. [DOI] [PubMed] [Google Scholar]
- 17. Cavallaro U, Christofori G (2004) Multitasking in tumor progression: signaling functions of cell adhesion molecules. Ann N Y Acad Sci 1014: 58–66. [DOI] [PubMed] [Google Scholar]
- 18. Hollingsworth MA, Swanson BJ (2004) Mucins in cancer: protection and control of the cell surface. Nat Rev Cancer 4: 45–60. [DOI] [PubMed] [Google Scholar]
- 19. Conroy T, Desseigne F, Ychou M, Bouche O, Guimbaud R, et al. (2011) FOLFIRINOX versus gemcitabine for metastatic pancreatic cancer. N Engl J Med 364: 1817–1825. [DOI] [PubMed] [Google Scholar]
- 20. Campen CJ, Dragovich T, Baker AF (2011) Management strategies in pancreatic cancer. Am J Health Syst Pharm 68: 573–584. [DOI] [PubMed] [Google Scholar]
- 21. Kurata N, Fujita H, Ohuchida K, Mizumoto K, Mahawithitwong P, et al. (2011) Predicting the chemosensitivity of pancreatic cancer cells by quantifying the expression levels of genes associated with the metabolism of gemcitabine and 5-fluorouracil. Int J Oncol 39: 473–482. [DOI] [PubMed] [Google Scholar]
- 22. Rejiba S, Bigand C, Parmentier C, Hajri A (2009) Gemcitabine-based chemogene therapy for pancreatic cancer using Ad-dCK::UMK GDEPT and TS/RR siRNA strategies. Neoplasia 11: 637–650. [DOI] [PMC free article] [PubMed] [Google Scholar]
- 23.Greene FL, Page DL, Fleming ID, Fritz A, Balch et al. (2002) American joint committee on cancer: AJCC cancer staging manual. New York: Springer.
- 24. Herreros-Villanueva M, Hijona E, Cosme A, Bujanda L (2012) Mouse models of pancreatic cancer. World J Gastroenterol 18: 1286–1294. [DOI] [PMC free article] [PubMed] [Google Scholar]
- 25. Rozenblum E, Schutte M, Goggins M, Hahn SA, Panzer S, et al. (1997) Tumor-suppressive pathways in pancreatic carcinoma. Cancer Res 57: 1731–1734. [PubMed] [Google Scholar]
- 26. Wood LD, Hruban RH (2012) Pathology and molecular genetics of pancreatic neoplasms. Cancer J 18: 492–501. [DOI] [PMC free article] [PubMed] [Google Scholar]
- 27. Hahn SA, Schutte M, Hoque AT, Moskaluk CA, da Costa LT, et al. (1996) DPC4, a candidate tumor suppressor gene at human chromosome 18q21.1. Science 271: 350–353. [DOI] [PubMed] [Google Scholar]
- 28. Bhadury J, Lopez MD, Muralidharan SV, Nilsson LM, Nilsson JA (2013) Identification of tumorigenic and therapeutically actionable mutations in transplantable mouse tumor cells by exome sequencing. Oncogenesis 2: e44. [DOI] [PMC free article] [PubMed] [Google Scholar]
- 29. Wang Y, Zhang Y, Yang J, Ni X, Liu S, et al. (2012) Genomic sequencing of key genes in mouse pancreatic cancer cells. Curr Mol Med 12: 331–341. [DOI] [PMC free article] [PubMed] [Google Scholar]
- 30. Long J, Zhang Y, Yu X, Yang J, LeBrun DG, et al. (2011) Overcoming drug resistance in pancreatic cancer. Expert Opin Ther Targets 15: 817–828. [DOI] [PMC free article] [PubMed] [Google Scholar]
- 31. Shah AN, Summy JM, Zhang J, Park SI, Parikh NU (2007) Development and characterization of gemcitabine-resistant pancreatic tumor cells. Ann Surg Oncol 14: 3629–3637. [DOI] [PubMed] [Google Scholar]
- 32. Arumugam T, Ramachandran V, Fournier KF, Wang H, Marquis L, et al. (2009) Epithelial to mesenchymal transition contributes to drug resistance in pancreatic cancer. Cancer Res 69: 5820–5828. [DOI] [PMC free article] [PubMed] [Google Scholar]


