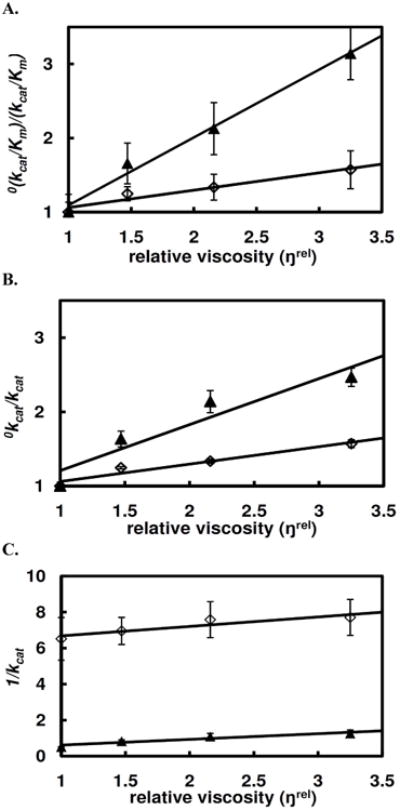
Figure 3.

Solvent viscosity effects on the steady state hydrolysis of TpAd (▲) and TrAd (◊) in HEPES buffer at pH 7.2. (A) plot of the relative second-order rate constant as a function of relative viscosity (ŋrel); (B) plot of the relative kcat vs. relative viscosity (ŋrel); (C) plot of 1/kcat vs. relative viscosity (ŋrel).
