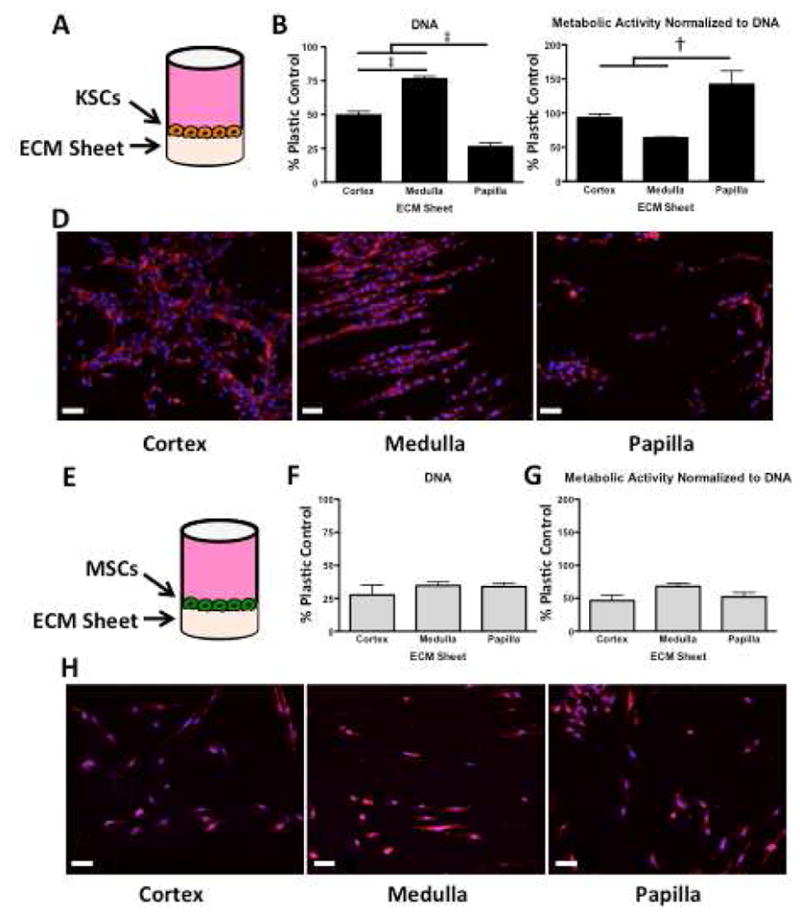
Figure 7. DNA content, metabolic activity, and rhodamine-phalloidin/DAPI staining of KSCs and MSCs on kidney region-specific decellularized ECM sheets.

A KSCs seeded onto ECM sheets and cultured for 48hrs. B DNA quantification reveals that papilla ECM contained significantly fewer cells, and that medulla contained significantly more cells than either cortex or papilla. C Metabolic activity per unit DNA indicates that the fewer KSCs on papilla are significantly more metabolically active than KSCs on cortex or medulla ECM. D Rhodamine-phalloidin/DAPI staining shows clear differences in morphology, orientation, and structure formation between KSCs on cortex, medulla, and papilla ECM sheets. KSCs on cortex show star-like morphology with random orientation, whereas KSCs on medulla exhibit elongated morphology with significant aligning and the formation of tubular structures. KSCs on papilla show clusters with periodic rounded morphology. E MSCs seeded onto ECM sheets and cultured for 48hrs. F DNA quantification shows no significant differences in MSC cultures on ECM from different kidney regions. G Metabolic activity per unit of DNA reveals no differences in metabolic activity of MSCs. H Rhodamine-phalloidin/DAPI staining shows consistency in MSC number and phenotype in ECM from all kidney regions. Scale bars: 50μm. † p < 0.01, ‡ p < 0.001.
