

Abstract
Background
Hypo-responders to erythropoietin stimulating agents (ESAs) have been associated with an increased subsequent risk of death or cardiovascular events. We hypothesized that subjects who are hypo-responsive to erythropoietin alfa would have higher plasma volumes and lower red cell deficits than subjects who are responsive to therapy.
Methods
As part of a prospective, single blind, randomized, placebo-controlled study comparing erythropoietin alfa with placebo in older adults (n=56) with heart failure and a preserved ejection fraction (HFPEF), we performed blood volume analysis using an indicator dilution technique with iodine131 –labeled albumin. We evaluated differences in plasma volumes and red cell volumes in hypo-responders (e.g. < 1 g/dL increase in hemoglobin within the first 4 weeks of treatment with epoetin alfa), compared to subjects who were responders and controls.
Results
Nine of 28 subjects (32%) assigned to ESA were hypo-responders. Hypo-responders did not differ from responders nor controls by any baseline demographic, clinical or laboratory parameter including hemoglobin. Hypo-responders had a greater total blood volume expansion (1264.7 ± 387 vs 229 ±206 ml, p=0.02) but less of a red cell deficit (−96.2±126 vs. −402.5±80.6 ml, p=0.04) and a greater plasma volume expansion (+1360.8±264.5 vs. +601.1±165.5 ml, p=0.01). Among responders, the increase in hemoglobin with erythropoietin alfa was associated primarily with increases in red cell volume (r=0.91, p<0.0001) as well as a decline in plasma volume (r=−0.55, p = 0.06).
Conclusions
Among older adults with HFPEF and anemia, hypo-responders to erythropoietin alfa had a hemodilutional basis of their anemia, suggesting that blood volume analysis can identify a cohort likely to respond to therapy.
Keywords: Anemia, erythropoietin alfa, heart failure, blood volume
Erythropoietin stimulating agents (ESAs) are approved for treatment of patients with significant anemia and chronic kidney disease with or without dialysis. More recently, studies have documented that anemia is highly prevalent in patients with heart failure, strongly associated with morbidity and mortality, and often due to underlying chronic renal disease.[1] Accordingly, clinical trials have evaluated the use of ESAs in patients with heart failure [2–12]. Results from the Trial to Reduce Cardiovascular Events with Aranesp Therapy (TREAT) demonstrated that administering an ESA (darbepoetin alfa) to achieve target hemoglobin of 13 g/dL was associated with an elevated risk of stroke and has resulted in an issuance of a package insert for all ESA products[13]. Subsequent analyses of these data identified that hypo-responders to darbepoetin alfa, defined as patients in the treatment group in the lowest quartile of change in hemoglobin level (<2% change), who had a median reduction in hemoglobin levels of 0.2 g/dL after the first 4 weeks of therapy, experienced an increased rate of death and cardiovascular events with ESA therapy[14]. These data coupled with recently reported negative outcomes for patients with systolic heart failure treated with darbepoetin alfa in the RED-HF trial [15] have dampened the interest in ESAs for use among patients with heart failure [2–12]. Identifying the cohort of subjects who are hypo-responders to ESAs and may be at increased risk for adverse outcomes with their use may be essential for appropriately applying these therapies.
A significant percentage of the subjects with heart failure who are anemic have a hemodilutional basis of their anemia[16] which can be identified by blood volume analysis [17]. We analyzed data from a recently completed randomized clinical trial of erythropoietin alfa in older adult subjects with heart failure and a preserved ejection fraction[12] in order to determine if hemodilutional anemia is associated with an inadequate response to ESA. The hypothesis was that blood volume analysis would reveal significant differences in blood volume components (e.g. higher plasma volumes and lower red cell deficits differences) in subjects who are hypo-responsive to EPO compared to subjects who are responsive to EPO and controls.
Methods
Study design
This is a retrospective analysis of a recently completed prospective, single blind, randomized, placebo-controlled, 24 week, phase 2 study that employed blinded endpoint analysis. The details of the study and its primary results have been reported[12]. In brief, 56 eligible patients were randomly assigned in a 1:1 ratio to receive erythropoietin alfa (starting dose 7,500 units) or placebo administered subcutaneously every week with a pre-specified dosing algorithm for a total of 24 weeks[18]. In this analysis, we evaluated the number of subjects who were hypo-responders to erythropoietin therapy (defined below) and compared the demographic/clinical characteristics and blood volume analysis of hypo-responders to responders and controls in order to determine if differences exist.
Blood Volume Analysis
Blood volume was calculated by standard indicator dilution technique. After intravenous administration of iodine131 –labeled albumin (Volumex; Daxor Corp, New York, NY) and sufficient time for circulation and equilibration (e.g. 12 minutes), venous samples from at least 3 of 5 samples drawn at 6-minute intervals (e.g. 12, 18, 24, 30 and 36 minutes after injection) were obtained. Each sample was centrifuged and pipetted to obtain two measures of spun hematocrit on each specimen and two 1000 μl samples of plasma. Plasma radioactivity of each sample was measured in a semi-automated counter (BVA-100 Blood Volume Analyzer; Daxor Corp, New York, NY) and plasma volume was determined as the zero-time volume of distribution of the radiolabeled albumin using semi-logarithmically techniques [19]. Blood volume and red blood cell volumes were calculated from the plasma volume measurement and compared with ideal values for age, sex, height, and weight based on the patient’s ideal weight [16]. To evaluate the true hematocrit, controlling for plasma volume expansion, we calculated the normalized hematocrit as the peripheral hematocrit multiplied by the ratio of total blood volume to ideal blood volume.
Statistical Analyses
Results are expressed as mean ± standard deviation unless otherwise noted. We defined responders as those who were randomized to receive erythropoietin alfa and who had a rate of hemoglobin rise ≥ 1 g/dL within the first 4 weeks of treatment, while hypo-responders also were randomized to receive erythropoietin alfa but who had a change in hemoglobin of < 1 g/dL within the first 4 weeks of treatment. These two cohorts were compared to controls who received saline injections during the course of trial. We compared the clinical, demographic, laboratory and echocardiographic characteristics of the three cohorts in order to identify any clinical characteristics which might differ between the cohorts and thus facilitate identification of non-responders at baseline. The primary focus was on blood volume measures. Differences between cohorts were evaluated with a chi-square with Fisher’s exact test for dichotomous variables and with a Wilcoxon Rank Test for continuous variables given the non-normal distribution of the data. Additionally, we evaluated changes in blood volume components from baseline to 24 weeks of therapy between responders, hypo-responders and controls. Finally, to determine the underlying mechanism of observed increases in hemoglobin with erythropoietin alfa therapy, we correlated changes in hemoglobin with changes in blood volume components (e.g. plasma volume and red cell volume). SAS for Windows (version 8.0, SAS Institute Inc, Cary, NC) was used for all analyses.
Results
Of the 56 people enrolled in the trial, most were older adults (77 years of age), women (68%), with comorbidities common in HFPEF (e.g. hypertension, obesity, coronary artery disease and chronic renal disease). Based on the definition of hypo-responsiveness to erythropoietin alfa administration (e.g. change in hemoglobin of < 1 g/dL within the first 4 weeks of treatment), 33% of patients in treatment group were non-responders. The changes in hemoglobin values during the course of the trial were significantly different in responders as compared to hypo-responders and controls (Figure 1).
Figure 1. Change in Hemoglobin during course of Trial in Controls. Responders and Hypo-Responders.
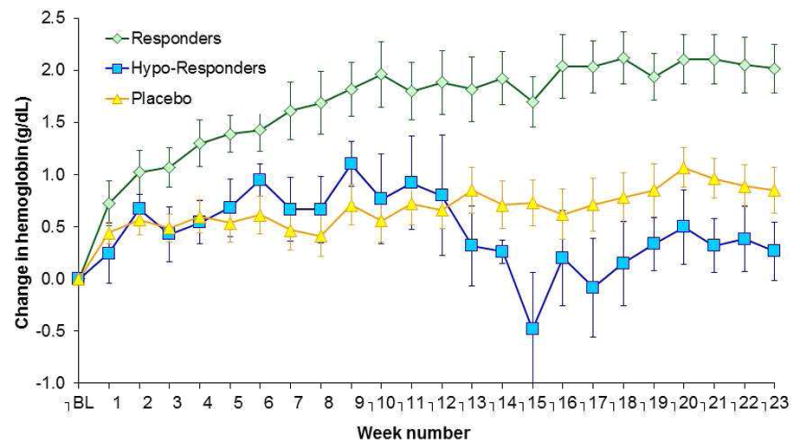
Weekly Change in Hemoglobin from Baseline during course of trial in subjects assigned to placebo (controls) and epoetin alfa, the latter divided into responders and hypo-responders.
Hypo-responders did not differ significantly from responders to erythropoietin alfa therapy in any demographic, clinical, laboratory or echocardiographic characteristics (Table 1). Notably, hypo-responders tended to be younger than responders (p=0.06), with larger body surface areas (p=0.07). The type of diuretics employed, their dose and the number of changes in doses during the course of the trial did not differ between responders and non-responders. However, there were significant differences in blood volume components at baseline between hypo-responders and responders/controls (Table 2). Specifically, total blood volume of hypo-responders was significantly higher than responders and controls (p=0.03) both in absolute terms and when indexed for body size (p=0.02). The excess blood volume in hypo-responders was attributable to the absence of a decrement of red cell volume when compared to responders and controls (p=0.03) and the marked increase in plasma volume seen in hypo-responders. Therefore, hypo-responders to erythropoietin alfa therapy had total blood volume expansion due to increased plasma volume with no red cell deficit (e.g. a hemodilutional anemia).
Table 1.
Demographic and Clinical Characteristics of Study Population
| Parameter | Controls | Responders | Hypo-Responders | P-value |
|---|---|---|---|---|
|
| ||||
| No. of participants | 28 | 18 | 9 | |
|
| ||||
| Age, y | 80 ± 11 | 76 ± 10 | 71 ± 8 | 0.08 |
|
| ||||
| Female, No (%) | 18 (64.3) | 13 (72.2) | 6 (66.7) | 0.93 |
|
| ||||
| Ethnicity, No (%): | ||||
| Hispanic | 15 (53.6) | 13 (72.2) | 6 (66.7) | 0.43 |
| Non-Hispanic | 13 (46.4) | 5 (27.8) | 3 (33.3) | |
|
| ||||
| Race, No (%): | ||||
| White | 19 (67.8) | 12 (66.7) | 7 (77.8) | |
| Black | 8 (28.6) | 6 (33.3) | 2 (22.2) | 0.96 |
| Asian | 1 (3.6) | 0 | 0 | |
|
| ||||
| Body-mass index | 31 ± 6 | 34 ± 8 | 34 ± 5 | 0.13 |
| Height (m) | 1.6 ± 0.1 | 1.6 ± 0.1 | 1.6 ± 0.1 | 0.24 |
| Weight (kg) | 75 ± 16 | 83 ± 20 | 85 ± 19 | 0.16 |
|
| ||||
| Deviation from Ideal Weight (%) | 34 ± 21 | 55 ± 36 | 48 ± 33 | 0.19 |
|
| ||||
| Body surface area (m2) | 1.8 ± 0.2 | 1.9 ± 0.3 | 2.0 ± 0.2 | 0.07 |
|
| ||||
| Comorbid conditions, No (%) | ||||
| Diabetic | 14 (50) | 15 (83.3) | 8 (88.9) | 0.02 |
| CAD | 15 (53.6) | 12 (66.7) | 6 (66.7) | 0.70 |
| Obesity | 14 (50) | 12 (66.7) | 7 (77.8) | 0.29 |
| COPD | 3 (10.7) | 5 (27.8) | 0 | 0.13 |
|
| ||||
| Medications, No (%) | ||||
| ACE inhibitors | 14 (50) | 5 (27.8) | 4 (44.4) | 0.35 |
| ARBs | 4 (14.3) | 4 (22.2) | 1 (11.1) | 0.79 |
| Beta Blockers | 22 (78.6) | 10 (55.6) | 7 (77.8) | 0.24 |
| Calcium Channel Blocker | 13 (46.4) | 11 (61.1) | 4 (44.4) | 0.63 |
| Aldosterone Antagonists | 6 (21.4) | 8 (44.4) | 3 (33.3) | 0.26 |
| Loop Diuretics | 23 (82.1) | 13 (72.2) | 6 (66.7) | 0.53 |
| Thiazide Diuretics | 4 (14.3) | 4 (22.2) | 3 (33.3) | 0.4307 |
|
| ||||
| Renal Function | ||||
| Blood urea nitrogen (mg/dL) | 37 ± 16 | 31 ± 4.4 | 38 ± 13 | 0.17 |
| Creatinine ( mg/dL) | 1.5 ± 0.8 | 1.6 ± 0.8 | 1.7 ± 0.6 | 0.59 |
| Estimated GFR ( mL/min) | 48.0 ± 18 | 47 ± 21 | 41 ± 14 | 0.54 |
|
| ||||
| Hematologic Parameters | ||||
| Erythropoietin (mU/mL) | 25 ± 27 | 24 ± 16 | 24 ± 25 | 0.99 |
| Hemoglobin (g/dL) | 10.3 ± 0.9 | 10.2 ± 1.2 | 10.8 ± 1.0 | 0.50 |
| Hematocrit (%) | 32.2 ± 3.1 | 31.9 ± 3.6 | 32.8 ± 2.2 | 0.77 |
| Mean cell volume (fl) | 89 ± 7 | 85 ± 7 | 85 ± 6 | 0.15 |
| Mean cell hemoglobin (pg) | 29 ± 3 | 27 ± 2 | 28 ± 2 | 0.19 |
| Mean cell hemoglobin concentration (gm/dl) | 32 ± 1 | 32 ± 1 | 33 ± 1 | 0.41 |
| Red cell distribution width (%) | 15 ± 2 | 15 ± 1 | 15 ± 23 | 0.39 |
|
| ||||
| Iron Studies | ||||
| Ferritin | 86 ± 73 | 73 ± 69 | 117 ± 98 | 0.35 |
| Iron | 60 ± 38 | 64 ± 59 | 54 ± 23 | 0.94 |
| TIBC | 313 ± 72 | 317 ± 59 | 272 ± 48 | 0.20 |
| FAIR-HF Iron deficient criteria (%) | 23 (82) | 15 (83) | 7 (78) | 1.00 |
|
| ||||
| BNP (pg/ml) | 373 ± 336 | 522 ± 349 | 452 ± 496 | 0.22 |
|
| ||||
| Echocardiographic Assessment | ||||
| EF (%) | 58 ± 9 | 59.4 ± 9 | 54 ± 12 | 0.24 |
| LVEDV (ml) | 100 ± 28 | 97 ± 29 | 108 ± 42 | 0.92 |
| LVESV (ml) | 43 ± 19 | 41 ± 19 | 53 ±31 | 0.59 |
| Stroke volume (ml) | 57 ± 14 | 57 ± 14 | 55 ± 16 | 0.88 |
| LVMass (grams) | 102 ± 27 | 105 ± 29 | 115 ± 17 | 0.24 |
Table 2.
Patient Blood Volume Characteristics at Baseline Evaluation
| Baseline Blood Volume Characteristics | |||
|---|---|---|---|
| Parameter | Controls | Responders | Hypo-Responders |
| No. of participants | 24 | 14 | 6 |
| Measured blood volume (cc) | 4586.3 ± 194.0 | 4778.2 ± 326.2 | 6131.8 ± 513.0* |
| Ideal blood volume (cc) | 4266.0 ± 132.1 | 4549.4 ± 179.3 | 4867.2 ± 216.5 |
| Blood volume excess/deficit (cc) | 320.3 ± 124.9 | 228.8 ± 205.6 | 1264.7 ± 387.0* |
| Blood volume deviation % | 7.5 ± 3.0 | 4.3 ± 3.9 | 25.5 ± 7.2* |
| Measured blood volume indexed (cc/kg) | 62.7 ± 2.0 | 56.5 ± 1.9 | 69.6 ± 3.7* |
| Ideal blood volume indexed (cc/kg) | 58.4 ± 1.0 | 54.4 ± 1.4 | 55.8 ± 2.7 |
| Measured red cell volume (cc) | 1322.7 ± 58.8 | 1318.1 ± 99.0 | 1769.8 ± 175.1* |
| Ideal red cell volume (cc) | 1632.3 ± 62.7 | 1720.6 ± 86.0 | 1866.0 ± 106.2 |
| Red cell volume excess/deficit (cc) | −309.6 ± 33.0 | −402.5 ± 80.6 | −96.2 ± 126.0 |
| Red cell volume deviation % | −18.9 ± 1.9 | −23.2 ± 3.9 | −5.6 ± 6.9* |
| Measured red cell volume indexed (cc/kg) | 18.1 ± 0.6 | 15.6 ± 0.6 | 19.9 ± 1.0* |
| Ideal red cell volume indexed (cc/kg) | 22.3 ± 0.5 | 20.5 ± 0.7 | 21.4 ± 1.3 |
| Measured plasma volume (cc) | 3263.7 ± 143.2 | 3430.0 ± 244.1 | 4362.0 ± 345.6* |
| Ideal plasma volume (cc) | 2633.8 ± 74.2 | 2828.9 ± 99.9 | 3001.2 ± 130.8 |
| Plasma volume excess/deficit (cc) | 629.9 ± 112.1 | 601.1 ± 165.5 | 1360.8 ± 264.5* |
| Plasma volume deviation % | 24.1 ± 4.4 | 19.9 ± 4.9 | 44.9 ± 7.5* |
| Measured plasma volume indexed (cc/kg) | 44.7 ± 1.6 | 40.4 ± 1.4 | 49.7 ± 2.8 |
| Ideal plasma volume indexed (cc/kg) | 36.1 ± 0.6 | 33.9 ± 0.9 | 34.4 ± 1.6 |
| Hematocrit | 32.2 ± 0.6 | 31.9 ± 0.9 | 32.8 ± 0.8 |
| Normalized hematocrit | 34.3 ± 0.9 | 31.9 ± 1.5 | 40 ± 2.7* |
Values are mean ± Standard error
p < 0.05 for Wilcoxon signed rank test score
In order to evaluate the differences in blood volume components in response to six months of therapy with erythropoietin alfa, we compared changes in blood volume from baseline to last follow-up visit in responders, hypo-responders, and controls (Figure 2). While overall blood volume did not change during the course of the study in any of the three groups, (p=0.49), responders were characterized by a parallel increase in red cell volume coupled with a decrease in plasma volume, a pattern that was different from that observed in hypo-responders where both red blood cell and plasma volume declined to a non-significant degree. The changes in hemoglobin during the course of the study correlated with increases in red cell volume (r=0.91, p<0.01) and inversely with declines in plasma volume (r=−.051, p=0.06) in responders.
Figure 2. Change in Blood Volume After 6 Months.
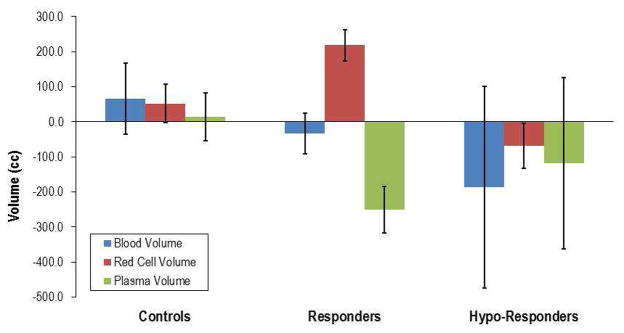
Change in blood volume and its components red cell volume and plasma volume after 6 Months of therapy with epoetin alfa in in subjects assigned to placebo (controls) and in responders and hypo-responders (see text for details).
Discussion
The principal findings of this study are that among older adults with HFPEF and anemia identified by standard measures of hemoglobin, non-responders to erythropoietin alfa therapy do not differ from responders at baseline by any demographic, clinical, laboratory, or echocardiographic assessment suggesting that such measures cannot be employed to identify hypo-responders to ESAs. However, we found that hypo-responders have higher total blood volume due to higher plasma volumes and lower decrements in red cell volume, indicative of a hemodilutional anemia. Accordingly, blood volume measures may be useful to identify a cohort of older adults with HFPEF who are hypo-responder to ESA therapy. Finally, although red cell volume is the main mechanism of the increase in hemoglobin observed with erythropoietin alfa therapy, both the rise in red cell volume and decline in plasma volume contribute to this phenomenon.
Erythropoiesis Stimulating Agents (ESAs), such as erythropoietin alfa, have been shown to increase the risk of death, myocardial infarction, stroke, venous thromboembolism, thrombosis of vascular access and tumor progression or recurrence in anemic patients with chronic kidney disease [20]. No trial has yet identified a target hemoglobin level, ESA dose, or dosing strategy that does not increase these risks. Because anemic CKD patients with poor initial response to erythropoietin alfa therapy have been shown to have higher rates of serious cardiovascular events and death [21], recognition of patients non-responsive to therapy is a potential method to mitigate the hazards of ESA therapy. Our data suggest that identification of poor responders using blood volume analysis may be a critical component of erythropoietin alfa administration to patients with HFPEF and potentially in other populations with volume overload states.
Identifying hypo-responders to ESA therapy is an emerging concept and precise criteria for identifying this group of patients has not yet been established. Hypo-responders were at least as prevalent in this study as in other studies. A third of patients in this trial were hypo-responders, defined as those individuals with a hemoglobin change of <1 g/dL after the first 4 weeks of treatment. In Solomon’s analysis of TREAT in which anemic CKD patients were divided into quartiles also based on change in hemoglobin in the first 4 weeks of therapy, hypo-responders were defined as those patients in the first quartile whose hemoglobin changed by on average −0.2 gm/dl (interquartile range of −0.7 to 0.0 gm/dl) [21]. Notably, hypo-responders had higher BMIs, were more often afflicted by cardiovascular disease, had milder decrements in hemoglobin, high c-reactive proteins indicative of inflammation and were more often taking angiotensin receptor antagonists than responders in the TREAT trial. Many of these characteristics are common to patients with HFPEF as demonstrated by the characteristics of subjects in our trial, suggesting that this population may be particularly susceptible to a lack of response to ESAs and may explain the lack of baseline differences between responders and hypo-responders in this study. However, had the criteria used in this study to identify hypo-responders (e.g. change in hemoglobin of < 1 g/dL within the first 4 weeks of treatment) been employed in TREAT, we estimate that at least 50% of patients in the TREAT study, rather than the 25% reported, would have been identified as non-responders. Thus, the definition of a poor response to ESA may need to consider not only the absolute change in hemoglobin from baseline, as in our study and in TREAT, but also the time period over which the shift is observed. It is possible that changes in hemoglobin during the initial 4 weeks of therapy with ESA may be insufficient time in which to judge the effect of therapy on hemoglobin levels. Initial pharmacologic studies of ESAs in systolic heart failure found that one 0.75 μg/kg dose of darbepoetin alfa did not raise hemoglobin after 4 weeks [2] but all other doses employed in this trial (2, 3 and 5 ug/kg) did achieve a response in a majority of subjects by 4 weeks. Accordingly, such data support the time period of 4 weeks to define an appropriate response to ESA therapy. However, two additional studies in systolic heart failure demonstrate that peak hemoglobin levels were reached only after 10–13 weeks [10] and 12–14 weeks [4]. Thus is it is possible that in subjects with heart failure, the response to ESA is delayed. Further research defining the most appropriate level of hemoglobin response and time period of that response may be critical to appropriate dosing of ESAs for subjects with heart failure in order to avoid adverse effects of the drug.
Our data demonstrate that blood volume analysis is a particularly useful assessment to identify subjects with heart failure who are hypo-responders to therapy. Indeed this is the first study to demonstrate in the context of a randomized clinical trial that total blood volume of hypo-responders was increased compared to responders and that this increase was attributable to an expansion of plasma volume in the absence of a true red cell deficit indicating a hemodilutional basis of the anemia. The recently reported results of the Reduction of Events with Darbepoetin Alfa in Heart Failure Trial (RED-HF trial) did not demonstrate an effect of therapy on the primary endpoint of time to death from any cause or first hospital admission for worsening HF but the authors did not specify if unresponsiveness to ESA was a factor in the negative outcomes of this trial.[15] It is not surprising that such patients would not have a hematologic response of the same magnitude to ESA as those with a true red cell deficit. We suggest that blood volume analysis, by identifying subjects with a hemodilutional basis of their anemia, may enhance the application of ESAs to subjects with volume overload states and concomitant anemia and could potentially reduce the exposure of non-responders to ESA, a cohort that has been identified previously as increased risk of serious adverse effects.
An alternative explanation for the lack of response to erythropoietin alfa that we observed relates to inadequate dosing. Since the hypo-responders in this study and in TREAT had larger BMIs and body surface area (Table 1), it is possible that a dosing algorithm that adjusted the dose of ESAs based on body size would have significantly reduced the hypo-responder population. However, in TREAT [13] and another multicenter study in subjects with systolic heart failure [4], dose of ESA was weight based and hypo-responders were at least as prevalent in our small study. Alternatively, increases in body size that results from excess adiposity have been shown to result in an expanded plasma volume in animals [22–24] and humans [25]. Thus, obesity may simply be a marker for plasma volume expansion that contributes to a hemodilutional basis of the observed anemia. In support of this hypothesis, indexed total blood volume, red cell volume, but not plasma volume for body weight differed in hypo-responders compared to responders and controls. Additionally, iron deficiency anemia could contribute to hypo-responsiveness to ESA therapy and a majority of the subjects in this trial met the FAIR-HF criteria.[26] However, neither iron stores nor the percent of subjects meeting the FAIR-HF criteria differed among responders and hypo-responders to ESA and all subjects received oral iron supplementation, arguing against this as the cause of hypo-responsiveness in this study.
Blood volume was not only a useful baseline assessment, but it is also provided insights into the mechanism by which ESAs increase hemoglobin. We found that erythropoietin alfa impacts both red cell and plasma volumes (Figure 2). Another pilot study of HFPEF patients with anemia by our group [27] reported no significant difference in plasma volume in response to ESA therapy but in that study the sample size was small and therapy was only administered for 12 weeks. A small study of eight young healthy patients also found red cell volume depression and plasma volume reductions with ESA administration [28], similar to our current results. Concomitant with the declines in plasma volume were reductions in plasma renin activity and aldosterone concentration, which likely contributed to this effect. The reductions in plasma renin activity and aldosterone concentrations occurred shortly after ESA administration (e.g. within 96 hours) and before significant increases in hemoglobin were observed, suggesting that this was a primary effect of ESA therapy. Clearly reductions in the renin-angiotensin-aldosterone system would be of value in patients with heart failure, resulting in declines in plasma volume, as has been reported by others in systolic heart failure [6].
Our study has several limitations. First, this is a retrospective analysis of a recently completed small, single center randomized controlled trial. However, we specifically included measures of blood volume as an a priori secondary exploratory hypothesis believing that such measures could provide meaningful information about the proper administration of ESAs and provide insights into their mechanism of action. Second, the small size of this study and the homogenous nature of the study participants (all subjects had HFPEF) may have limited our ability to identify baseline differences between responders and hypo-responders with respect to demographic, clinical, laboratory, or echocardiographic characteristics. Additionally, several parameters such as inflammatory markers which were shown in the analysis of the TREAT study to be weakly associated with a poor initial response to an ESA were not measured in this trial. While the blood volume measure employed in this study is approved for clinical use, it is not widely employed and takes ~45 minutes to perform. However, the presented data emphasizes the potential physiologic value in direct measures of blood volume to identify a real or false (e.g. hemodilutional basis of) anemia because despite the limited sample size, we were able to determine significant differences using the techniques applied. Whether applications of blood volume analysis to larger cohorts will yield similar data or insights is unknown.
In older adults with HFPEF and anemia, blood volume analysis performed prior to administration of ESA therapy identified patients who had a poor response to erythropoietin alfa in terms of increases in hemoglobin. Hypo -responders had a hemodilutional basis of their anemia with no significant red cell deficit but with marked plasma volume excess. Finally, blood volume analysis demonstrated that while increase in red cell volume is the main mechanism by which erythropoietin alfa increases hemoglobin, reduction in plasma volume is also an important contributor to this process. These data suggest that additional studies of the value of blood volume analysis in larger patient populations who are receiving ESAs may be useful to identify a cohort likely to benefit and respond to therapy.
Acknowledgments
This research was supported by a grant from the New York Academy of Medicine, The Glorney-Raisbeck Medical Student Grant in Cardiovascular Research to Margarita Borovka. Dr. Maurer was supported by the NIH/NIA (K24-AG036778-03).
Footnotes
Disclosures
None of the authors have any disclosures.
Publisher's Disclaimer: This is a PDF file of an unedited manuscript that has been accepted for publication. As a service to our customers we are providing this early version of the manuscript. The manuscript will undergo copyediting, typesetting, and review of the resulting proof before it is published in its final citable form. Please note that during the production process errorsmaybe discovered which could affect the content, and all legal disclaimers that apply to the journal pertain.
References
- 1.Ezekowitz JAMF, Armstrong PW. Anemia is Common in Heart Failure and is Associated with Poor Outcomes. Circulation. 2003:223–5. doi: 10.1161/01.cir.0000052622.51963.fc. [DOI] [PubMed] [Google Scholar]
- 2.Cleland JG, Sullivan JT, Ball S, Horowitz JD, Agoram B, Rosser D, et al. Once-monthly administration of darbepoetin alfa for the treatment of patients with chronic heart failure and anemia: a pharmacokinetic and pharmacodynamic investigation. Journal of cardiovascular pharmacology. 2005;46:155–61. doi: 10.1097/01.fjc.0000167013.77092.c4. [DOI] [PubMed] [Google Scholar]
- 3.Cosyns B, Velez-Roa S, Droogmans S, Pierard LA, Lancellotti P. Effects of eythropoietin administration on mitral regurgitation and left ventricular remodeling in heart failure patients. International journal of cardiology. 2010;138:306–7. doi: 10.1016/j.ijcard.2008.06.064. [DOI] [PubMed] [Google Scholar]
- 4.Ghali JK, Anand IS, Abraham WT, Fonarow GC, Greenberg B, Krum H, et al. Randomized double-blind trial of darbepoetin alfa in patients with symptomatic heart failure and anemia. Circulation. 2008;117:526–35. doi: 10.1161/CIRCULATIONAHA.107.698514. [DOI] [PubMed] [Google Scholar]
- 5.Kourea K, Parissis JT, Farmakis D, Paraskevaidis I, Panou F, Filippatos G, et al. Effects of darbepoetin-alpha on quality of life and emotional stress in anemic patients with chronic heart failure. European journal of cardiovascular prevention and rehabilitation : official journal of the European Society of Cardiology, Working Groups on Epidemiology & Prevention and Cardiac Rehabilitation and Exercise Physiology. 2008;15:365–9. doi: 10.1097/HJR.0b013e3282f849d0. [DOI] [PubMed] [Google Scholar]
- 6.Mancini DM, Katz SD, Lang CC, LaManca J, Hudaihed A, Androne AS. Effect of erythropoietin on exercise capacity in patients with moderate to severe chronic heart failure. Circulation. 2003;107:294–9. doi: 10.1161/01.cir.0000044914.42696.6a. [DOI] [PubMed] [Google Scholar]
- 7.Palazzuoli A, Silverberg D, Iovine F, Capobianco S, Giannotti G, Calabro A, et al. Erythropoietin improves anemia exercise tolerance and renal function and reduces B-type natriuretic peptide and hospitalization in patients with heart failure and anemia. Am Heart J. 2006;152:1096, e9–15. doi: 10.1016/j.ahj.2006.08.005. [DOI] [PubMed] [Google Scholar]
- 8.Palazzuoli A, Silverberg DS, Iovine F, Calabro A, Campagna MS, Gallotta M, et al. Effects of beta-erythropoietin treatment on left ventricular remodeling, systolic function, and B-type natriuretic peptide levels in patients with the cardiorenal anemia syndrome. Am Heart J. 2007;154:645, e9–15. doi: 10.1016/j.ahj.2007.07.022. [DOI] [PubMed] [Google Scholar]
- 9.Parissis JT, Kourea K, Panou F, Farmakis D, Paraskevaidis I, Ikonomidis I, et al. Effects of darbepoetin alpha on right and left ventricular systolic and diastolic function in anemic patients with chronic heart failure secondary to ischemic or idiopathic dilated cardiomyopathy. Am Heart J. 2008;155:751, e1–7. doi: 10.1016/j.ahj.2008.01.016. [DOI] [PubMed] [Google Scholar]
- 10.Ponikowski P, Anker SD, Szachniewicz J, Okonko D, Ledwidge M, Zymlinski R, et al. Effect of darbepoetin alfa on exercise tolerance in anemic patients with symptomatic chronic heart failure: a randomized, double-blind, placebo-controlled trial. J Am Coll Cardiol. 2007;49:753–62. doi: 10.1016/j.jacc.2006.11.024. [DOI] [PubMed] [Google Scholar]
- 11.Silverberg DS, Wexler D, Sheps D, Blum M, Keren G, Baruch R, et al. The effect of correction of mild anemia in severe, resistant congestive heart failure using subcutaneous erythropoietin and intravenous iron: a randomized controlled study. Journal of the American College of Cardiology. 2001;37:1775–80. doi: 10.1016/s0735-1097(01)01248-7. [DOI] [PubMed] [Google Scholar]
- 12.Maurer MS, Teruya S, Chakraborty B, Helmke S, Mancini D. Treating Anemia in Older Adults with Heart Failure with a Preserved Ejection Fraction (HFPEF) with Epoetin Alfa: Single Blind Randomized Clinical Trial of Safety and Efficacy. Circ Heart Fail. 2012 doi: 10.1161/CIRCHEARTFAILURE.112.969717. [DOI] [PMC free article] [PubMed] [Google Scholar]
- 13.Pfeffer MA, Burdmann EA, Chen CY, Cooper ME, de Zeeuw D, Eckardt KU, et al. A trial of darbepoetin alfa in type 2 diabetes and chronic kidney disease. The New England journal of medicine. 2009;361:2019–32. doi: 10.1056/NEJMoa0907845. [DOI] [PubMed] [Google Scholar]
- 14.Solomon SD, Uno H, Lewis EF, Eckardt KU, Lin J, Burdmann EA, et al. Erythropoietic response and outcomes in kidney disease and type 2 diabetes. N Engl J Med. 2010;363:1146–55. doi: 10.1056/NEJMoa1005109. [DOI] [PubMed] [Google Scholar]
- 15.Swedberg K, Young JB, Anand IS, Cheng S, Desai AS, Diaz R, et al. Treatment of Anemia with Darbepoetin Alfa in Systolic Heart Failure. The New England journal of medicine. 2013 doi: 10.1056/NEJMoa1214865. [DOI] [PubMed] [Google Scholar]
- 16.Androne AS, Katz SD, Lund L, LaManca J, Hudaihed A, Hryniewicz K, et al. Hemodilution is common in patients with advanced heart failure. Circulation. 2003;107:226–9. doi: 10.1161/01.cir.0000052623.16194.80. [DOI] [PubMed] [Google Scholar]
- 17.Abramov D, Cohen RS, Katz SD, Mancini D, Maurer MS. Comparison of blood volume characteristics in anemic patients with low versus preserved left ventricular ejection fractions. The American journal of cardiology. 2008;102:1069–72. doi: 10.1016/j.amjcard.2008.05.058. [DOI] [PMC free article] [PubMed] [Google Scholar]
- 18.Altincatal A, Macarthur RB, Teruya S, Helmke S, Maurer MS. A Dosing Algorithm for Erythropoietin Alpha in Older Adults with Heart Failure and a Preserved Ejection Fraction. Cardiovascular therapeutics. 2011 doi: 10.1111/j.1755-5922.2011.00295.x. [DOI] [PMC free article] [PubMed] [Google Scholar]
- 19.Feldschuh J, Enson Y. Prediction of the normal blood volume. Relation of blood volume to body habitus. Circulation. 1977;56:605–12. doi: 10.1161/01.cir.56.4.605. [DOI] [PubMed] [Google Scholar]
- 20.Administration USFaD. Epogen medication guide. U.S. Food and Drug Administration; 2012. [Google Scholar]
- 21.Solomon SD, Uno H, Lewis EF, Eckardt KU, Lin J, Burdmann EA, et al. Erythropoietic Response and Outcomes in Kidney Disease and Type 2 Diabetes. New England Journal of Medicine. 2010;363:1146–55. doi: 10.1056/NEJMoa1005109. [DOI] [PubMed] [Google Scholar]
- 22.Hall JE, Brands MW, Dixon WN, Smith MJ., Jr Obesity-induced hypertension. Renal function and systemic hemodynamics. Hypertension. 1993;22:292–9. doi: 10.1161/01.hyp.22.3.292. [DOI] [PubMed] [Google Scholar]
- 23.Rocchini AP, Moorehead C, Wentz E, Deremer S. Obesity-induced hypertension in the dog. Hypertension. 1987;9:III64–8. doi: 10.1161/01.hyp.9.6_pt_2.iii64. [DOI] [PubMed] [Google Scholar]
- 24.Rocchini AP, Moorehead CP, DeRemer S, Bondie D. Pathogenesis of weight-related changes in blood pressure in dogs. Hypertension. 1989;13:922–8. doi: 10.1161/01.hyp.13.6.922. [DOI] [PubMed] [Google Scholar]
- 25.Licata G, Scaglione R, Barbagallo M, Parrinello G, Capuana G, Lipari R, et al. Effect of obesity on left ventricular function studied by radionuclide angiocardiography. International journal of obesity. 1991;15:295–302. [PubMed] [Google Scholar]
- 26.Anker SD, Comin Colet J, Filippatos G, Willenheimer R, Dickstein K, Drexler H, et al. Ferric carboxymaltose in patients with heart failure and iron deficiency. The New England journal of medicine. 2009;361:2436–48. doi: 10.1056/NEJMoa0908355. [DOI] [PubMed] [Google Scholar]
- 27.Cohen RS, Karlin P, Yushak M, Mancini D, Maurer MS. The effect of erythropoietin on exercise capacity, left ventricular remodeling, pressure-volume relationships, and quality of life in older patients with anemia and heart failure with preserved ejection fraction. Congest Heart Fail. 2010;16:96–103. doi: 10.1111/j.1751-7133.2009.00135.x. [DOI] [PMC free article] [PubMed] [Google Scholar]
- 28.Lundby C, Thomsen JJ, Boushel R, Koskolou M, Warberg J, Calbet JA, et al. Erythropoietin treatment elevates haemoglobin concentration by increasing red cell volume and depressing plasma volume. The Journal of physiology. 2007;578:309–14. doi: 10.1113/jphysiol.2006.122689. [DOI] [PMC free article] [PubMed] [Google Scholar]