Abstract
In this paper we present a new software toolkit for generating and optimizing surface and volumetric meshes from three-dimensional (3D) biomedical imaging data, targeted at image-based finite element analysis of some biomedical activities in a single material domain. Our toolkit includes a series of geometric processing algorithms including surface re-meshing and quality-guaranteed tetrahedral mesh generation and optimization. All methods described have been encapsulated into a user-friendly graphical interface for easy manipulation and informative visualization of biomedical images and mesh models. Numerous examples are presented to demonstrate the effectiveness and efficiency of the described methods and toolkit.
Keywords: Geometric modeling, tetrahedral mesh generation, tetrahedral mesh smoothing, surface re-meshing, biomedical images
1. Introduction
Computer simulations have been widely used to study various activities in biomedical systems, ranging from molecular, cellular to organ scales [10, 36, 60]. Many of these biological activities can be formulated as partial differential equations (PDEs), which often do not admit analytical solutions and have to be numerically solved. Among a variety of numerical approaches, the finite element method (FEM) has become popular for solving PDEs. One of the challenges in using the FEM, however, is to generate high-quality meshes on which the simulations are performed. In order to obtain more accurate simulation results, it is also practically important to incorporate realistic biological structures into geometric mesh models [11, 14, 29, 48, 49, 56]. To this end, the goal of the present paper is to construct high-quality geometric mesh models from 3D biomedical imaging data.
In bridging the gap between images and meshes, the following steps are typically involved: (1) from images to surface models, (2) from surface models to tetrahedral meshes, and (3) tetrahedral mesh smoothing to further improve the mesh quality. Below we shall give a brief summary of the related work on these topics.
From Images to Surface Models
To construct surface mesh models from images, we need to extract the boundaries of the feature of interest. Various computational algorithms have been proposed for image boundary segmentation. Commonly used methods include edge detection [22], region growing and/or region merging [64], active curve/surface motion [41, 51], watershed immersion method [9, 58], normalized graph cut [53] and eigenvector analysis [16]. As image processing is not the focus of the current paper, we assume that the feature boundaries have been segmented either manually or automatically. If the segmentation is applied to 2D images, as commonly seen in manual segmentation, each slice of a given 3D image produces one or multiple contours and the contours found on different slices are connected together to form a 3D triangular surface mesh [1]. As shown below, these surface meshes are often very noisy and corrupted with badly-shaped triangles and sometimes wrong topologies. Therefore, it is often necessary to regenerate a new surface mesh with much higher quality to approximate the original surface shape [57, 62].
From Surface Models to Tetrahedral Meshes
There has been an extensive study on tetrahedral mesh generation from surface models [21, 45]. The related techniques can be classified as Delaunay-based, advancing-front-based, and octree-based methods. The Delaunay-based method usually generates and refines the Delaunay triangulation of a set of progressively inserted vertices inside/on a given surface domain (e.g., see [52, 54]). This technique is very successful in 2D mesh generation but may not work well in generating high-quality tetrahedral meshes, where some nearly degenerate elements known as slivers often occur. The advancing front-based method starts from the boundary of a domain and then inserts new points inside the domain so that the generated tetrahedra have acceptable shapes and conform to the desired sizing function [2, 8, 19]. However, poorly-shaped surface triangles often give rise to very low quality tetrahedra. The octree-based method recursively subdivides the domain containing the given mesh until some stopping criteria are reached [4, 43, 63, 67]. In all the above approaches, however, the dihedral angles are not guaranteed in the resulting tetrahedra especially those near the surfaces. More recently, Labelle and Shewchuk [34] presented an iso-surface stuffing algorithm to generate tetrahedral meshes, where the dihedral angles are bounded by [10.7° 164.8°]. However, when non-uniform tetrahedra on the surface boundary are preferred, the range of dihedral angles becomes [1.66°, 174.72°].
Tetrahedral Mesh Quality Improvement
Typical methods of tetrahedral mesh quality improvement include: (1) topology optimization, which modifies the connectivity between mesh vertices while keeping vertex positions unchanged. The edge- or face-swapping methods are commonly used in topology optimization [18, 30]. (2) vertex insertion/deletion, which inserts/deletes vertices to/from the mesh [7, 13, 44]. (3) vertex smoothing, which repositions the coordinates of the vertices while keeping the connectivity unchanged [3, 17]. Despite the wide use of the first two methods in mesh quality improvement, the third method remains an active research topic in this area. There has been a lot of work on vertex relocation for mesh quality improvement, including Laplacian smoothing [15, 23, 25], angle-based methods [61, 65, 71], methods based on centroid Voronoi tessellation (CVT) [12], and more recently optimization-based methods utilizing optimal Delaunay triangulation (ODT) [6]. Most of these methods perform well for internal tetrahedral nodes. In many real-world mesh models, however, badly-shaped tetrahedra often occur near or on the boundaries of a domain [34, 69]. Therefore, how to simultaneously smooth internal and boundary vertices is of great interest in tetrahedral mesh smoothing.
The main goal of the current work is to integrate several of our newly-developed algorithms into a user-friendly toolkit, called BIMoS (or Biomedical Image-based Modeling and Simulation), to create high-quality tetrahedral mesh models from biomedical imaging data. Fig. 1 shows a flowchart of the mesh generation and optimization algorithms available in BIMoS. Compared to some existing software tools on tetrahedral mesh generation and improvement, such as Tetgen [54], CGALMesh [47], LBIE [67], and Stellar [30], the described BIMoS is the first publicly available toolkit that guarantees a lower bound of dihedral angles in tetrahedral mesh generation, which is vital in finite element methods. In addition, the accompanying graphical user interface (GUI) provides various ways to pre-process and visualize the meshes (e.g., local refinement, hole-filling, mesh quality measurement, cross sectioning of meshes at arbitrary views and depths, etc.). While the present methods and tools are applicable to a wide range of biomedical images, we shall consider as examples the electron microscopic (EM) images of subcellular structures in cardiac myocytes (or muscle cells) and aim to produce tetrahedral meshes suitable for finite element analysis of cardiac cell dynamics [26, 38]. The current version of the present toolkit can only generate meshes in a single material domain. For domains with multiple materials, the reader is referred to some published work such as the method described in [69].
Figure 1.
A flowchart of the mesh generation and optimization algorithms available in BIMoS. While the present paper is focused on biomedical imaging data as input, BIMoS can also take molecules (shown in gray) as input and generate and optimize meshes for molecular surfaces. Discussed in detail in the current paper are the three mesh-processing steps highlighted in blue: (1) surface mesh regeneration, (2) quality-guaranteed tetrahedral mesh generation, and (3) tetrahedral mesh smoothing.
The remainder of the present paper is organized as follows. In Section 2 we describe the computational approaches on mesh generation and smoothing. We outline our software toolkit in Section 3. Some experimental results are presented in Section 4, followed by the conclusion in Section 5.
2. Mesh Generation and Smoothing
2.1. Biological Imaging Data
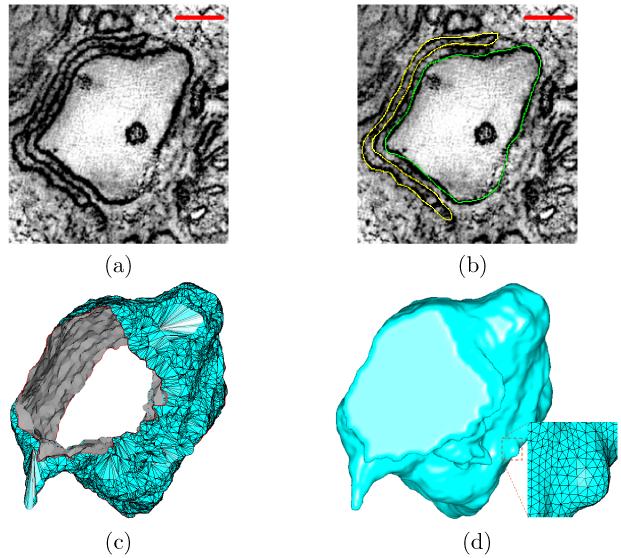
While the mesh generation and smoothing algorithms described below are applicable to a variety of biological data, including images and molecules as shown in Section 4, we are particularly interested in 3D volumetric images of sub-cellular structures, namely, transverse-tubules (or T-tubules) and the surrounding junctional sarcoplasmic reticulum (or jSR), in ventricular muscle cells (or myocytes). The t-tubular and jSR membrane-bound organelles are coupled together to form so-called calcium release units (CRUs), which are fundamental in controlling calcium dynamics in cardiac myocytes [24, 55]. Fig. 2(a) shows a cropped sample slice of such a coupled unit that is three-dimensionally reconstructed by using the electron microscopic tomography. Segmentations of membrane organelles in 3D volume reconstructions were performed manually in IMOD [32]. Fig. 2(b) shows the segmented t-tubular (green) and jSR (yellow) structures. Finally, the objects of scientific interest outlined with contours were reconstructed (or tiled) into surface meshes using modules built in IMOD, as shown in Fig. 2(c).
Figure 2.
From electron microscopic images to surface meshes. (a) A cropped sample slice of EM tomography (scale bar: 100nm). (b) The manually segmented t-tubules (green) and jSR (yellow) structures. (c) The surface mesh reconstructed from the segmented contours. The numbers of vertices and triangles are 5, 993 and 11, 650 respectively. The minimal and maximal angles are 0.18° and 175.4° respectively. (d) The regenerated surface mesh, with 35, 348 vertices and 70, 694 triangles. The minimal and maximal angles are 15.7° and 140° respectively. Note that the holes on both ends of the structure have been closed for subsequent tetrahedral mesh generation and numerical simulation.
2.2. Surface Mesh Regeneration
As one can see in Fig. 2(c), the surface mesh generated by “tiling” individual 2D contours is noisy and contains extremely low-quality angles. In order to better visualize and quantify the structures of interest and generate quality tetrahedral meshes, it is essential to improve the surface mesh quality. Given the low-quality in these original surface meshes, traditional mesh smoothing methods (e.g., by vertex-repositioning and edge-swapping) would find difficulties in processing these meshes. We hence utilize mesh regeneration (or remeshing) to improve the quality of the meshes. The algorithm we adopted is a modified marching method as briefly summarized below:
Constructing background cubic grids. We first embed the given surface mesh into 3D uniform cubic grids. Then we compute a signed distance value for each grid point relative to the given mesh: positive/negative/zero for grids points inside/outside/on the surface mesh, respectively.
Snapping cutting points. The original marching cube algorithm [37] is able to produce smooth triangular meshes but very small angles often occur when an intersection point between the input and background meshes is too close to a grid point. To eliminate skinny triangles, we adopt a “snapping” scheme by moving the intersection point to the nearest grid point so that the skinny triangles would disappear. Specifically, for a cutting (or intersection) point P on an edge e of the background mesh, where the distance from P to the closer end point of e is less than a preset constant λ multiplied by the length of e, the corresponding end point (or grid point of the background mesh) is re-assigned with a zero distance value. The original marching cube algorithm is then executed on the modified distance function. Note that a smaller λ would generate a smoother mesh but the mesh quality would be lower. On the other hand, a larger λ can guarantee a higher mesh quality but the resulting mesh is bumpier and thus significant post-processing of the mesh (see below) is necessary, which may cause large errors between the original and regenerated meshes. In the present paper, λ is chosen as 0.2, to have a good balance between mesh quality and surface accuracy.
Post-processing the mesh. Although the snapping strategy can generate much better triangles, the resulting surface mesh is not as smooth as the one generated by the original marching cube algorithm. We thus utilize the normal-based surface smoothing technique [65] to reduce the bumpiness on the surface mesh. To retain the good angles already achieved, we restrict the smoothing (or vertex-moving) to where no worse angles are introduced.
Fig. 2(d) shows the regenerated triangular mesh. We can see a significant improvement of mesh quality, as compared to Fig. 2(c). In order to generate tetrahedral meshes (see below for algorithmic details) and to perform subsequent numerical simulations (not discussed in the present paper), we have closed both ends of the t-tubule before the mesh in Fig. 2(c) was regenerated.
2.3. Tetrahedral Mesh Generation
In this subsection, we summarize the key steps of tetrahedral mesh generation using the body-centered cubic (BCC) lattice and octree-based data structure. More details can be found in [59]. For simplicity of description, we consider only tetrahedral mesh generation inside a given surface mesh, although our algorithms can be readily modified to generate tetrahedra outside a domain surface, as demonstrated in the Result section below.
2.3.1. BCC Lattice Construction
A cubic bounding box of the input surface mesh is first generated. We then take advantage of the top-down octree-based strategy to subdivide the bounding box. To make non-uniform tetrahedral meshes on the surface, some geometric criteria, such as curvature and the size of triangles inside an octree node, are considered as well. In addition, a conforming condition is enforced so that the depth-disparity between two face-adjacent octree leaf nodes is never greater than 1. As a result, we have two cases to consider.
0-depth-disparity. For the common face of two adjacent leaf nodes, we consider the four edges of the face. If all four edge-adjacent leaf nodes of one edge have the same depth, we use the traditional way to construct the BCC tetrahedron; that is, using the center points of the two face-adjacent nodes and two end points of this edge to form a tetrahedron (see Fig. 3(a)). Otherwise, two BCC tetrahedra are constructed by using the middle point of the edge (see Fig. 3(b)).
1-depth-disparity. We split the common quadrilateral face of two adjacent leaf nodes into two triangular faces along its diagonal. The center point of each leaf node, together with three vertices of each split triangular face, comprises one BCC tetrahedron (see Fig. 3(c)).
Figure 3.

Illustration of the BCC lattice construction. (a) 0-depth-disparity, where the four faces sharing an edge have the same depth in the octree. (b) 0-depth-disparity, where the four faces sharing an edge have different depths in the octree. (c) 1-depth-disparity.
2.3.2. Marching Tetrahedron Algorithm
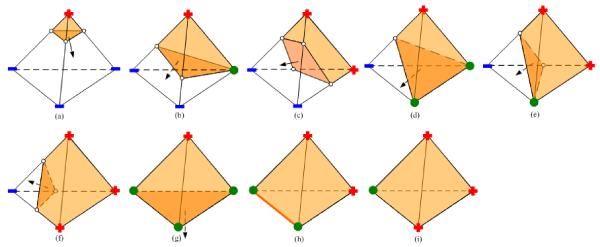
After the construction of BCC tetrahedra, we compute a scalar value for each vertex of the tetrahedra using the Euclidean distance relative to the input surface mesh S. Each vertices is associated with a sign: positive (inside S), negative (outside S), or zero (on S). For interior tetrahedra (completely inside S), where all vertices are labeled with a positive sign, we consider them as the final tetrahedra. Tetrahedra completely outside S, with all vertices labeled with a negative sign, are removed. Then, the remaining problem is to deal with the BCC tetrahedra crossing the surface mesh. To this end, we borrow the idea of the marching cube technique [37], which we refer to as the marching tetrahedron algorithm, to split a boundary tetrahedron into inside and outside polyhedra. The outside part is removed, while the inside polyhedron is further decomposed into tetrahedra (described below). Fig. 4 lists all possible cutting stencils.
Figure 4.
Cutting stencils for boundary BCC tetrahedra. Vertices of the BCC tetrahedra are labeled with the corresponding signs (red “+” for positive, blue “−” for negative, and green dots for zero). Cutting points are represented by white dots and inside polyhedra are colored in yellow.
2.3.3. Decomposing Boundary Polyhedra
There are different ways to decompose a polyhedron into tetrahedra. Note that ambiguous cases occur at a quadrilateral face of the polyhedron. Taking the dihedral quality of tetrahedra into consideration, we employ an optimal scheme as follows. Suppose a triangular face with vertices (a, b, c) and two cutting points p1, p2 on edges ab and ac, respectively (see Fig. 5a). The quadrilateral face of the polyhedron is composed of vertices b, c and cutting points p1, p2. We calculate the values , for p1, p2. If λ1 is less than λ2 we then split the quadrilateral face along the diagonal p2b; otherwise, the face is divided along the diagonal p1c (see Fig. 5(b), (c)).
Figure 5.

Splitting the quadrilateral face of a polyhedron p1bcp2. (a) Point p1, p2 are cutting points and their lambda values are λ1, λ2, respectively. (b) When λ2 is greater than λ1, then split the face along p2b. (c) Otherwise, split the face along p1c.
2.3.4. Snapping Cutting Points
Similar to the marching cubes for surface mesh regeneration as described in Section 2.2, the original marching tetrahedron algorithm is able to produce smooth triangular meshes but very small angles are frequently encountered. Consequently, the decomposed tetrahedra often contain small dihedral angles too. With a similar snapping strategy, we change the distance value of a BCC tetrahedral node P to zero if there is a cutting point very close to P. The original marching tetrahedral algorithm described above is then applied to the modified distance function. Similar to the snapping method for surface mesh regeneration, the resulting tetrahedral mesh is often very bumpy on surfaces and the normal-based surface smoothing technique [65] is again utilized to smooth the surface of the tetrahedral mesh. To keep the good dihedral angles already achieved, we also restrict the smoothing (or vertex-moving) to where no worse dihedral angles are introduced.
2.3.5. Mesh Adaptivity
Mesh adaptivity is important in balancing the computational time and simulation accuracy in finite element analysis. As the top-down octree subdivision is used in our method, we are able to generate tetrahedra that are dense near the boundary and gradually become coarse towards the interior of the domain. To further achieve adaptive meshes on the domain boundary, we consider two criteria: triangle size of the input mesh and the flatness of the surface. First, we determine whether there is at least one triangular face contained in each octron during the subdivision. If there is only a single triangle in the octron, then we stop subdividing this octron. Second, we approximate the curvature metric as the maximal angle between the normal vectors of all triangular faces contained in an octron. If the curvature is smaller than a pre-defined threshold, we further subdivide the octron; otherwise, we stop the subdivision. The resulting tetrahedra are thus denser in high curvature areas of the input mesh and sparser elsewhere.
We have shown in [59] that the method outlined above can produce adaptive tetrahedral meshes with a minimal dihedral angle of 5.71°. The resulting tetrahedral mesh quality can be further improved by using a tetrahedral mesh smoothing technique, as described below.
2.4. Tetrahedral Mesh Smoothing
The goal of tetrahedral mesh smoothing is to improve the mesh quality by relocating the vertices, where the mesh quality is often measured by minimal and maximal dihedral angles in the resulting mesh. Consider a vertex x0 in a tetrahedral mesh and the neighborhood of x0 is Ω0 consisting of a set of tetrahedra {τ}. Let x* be the smoothing result of x0 and Ω* the neighborhood of x* (or the union of tetrahedra incident to x*) in . In the optimal Delaunay triangulation (ODT) scheme [5, 6], the following objective function is defined as the interpolation error between the paraboloid function f(x) = ||x − x0||2 and its linear approximation fI(x) over Ω*, where fI(x) is constructed by lifting the vertices of Ω* onto f(x):
| (1) |
Minimizing the above objective function would result in an optimal position of x*. For an inner vertex x0, its optimal position x* can be explicitly computed by the following ODT formula [5]:
| (2) |
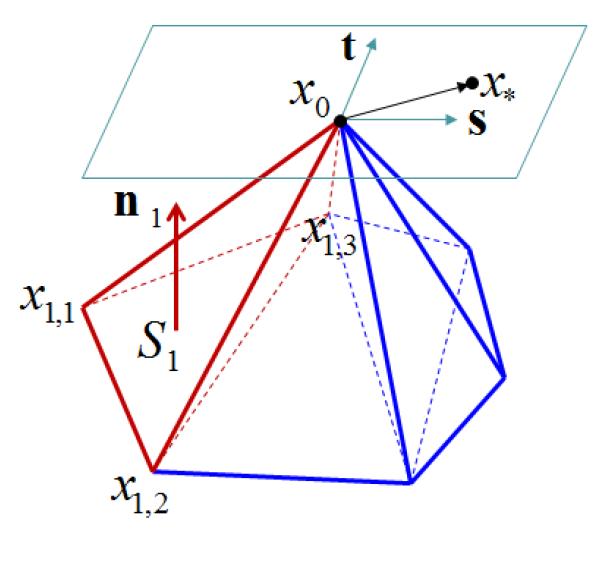
where |Ω0| is the volume of Ω0 and xτ,i are the (three) vertices except x0 of the incident tetrahedron τ. Sτ and nτ are the area and unit normal vector of tτ, which is the opposite triangle of x0 in τ. nτ points to the inside of τ. Fig. 6 illustrates some of the notations. One of the incident tetrahedra (τ = 1) of x0 is considered and indicated in red. The opposite triangle t1 is formed by the three vertices x1,1, x1,2, and x1,3 and its area and unit normal vector are given by S1 and n1, respectively.
Figure 6.
: Illustration of the optimal Delaunay triangulation (ODT) scheme and its variant.
It is important to note that the original ODT approach cannot be directly used to optimize boundary vertices. Eq. (2) is derived from Eq. (1) by assuming that the neighborhoods Ω0 and Ω* are identical, which is true for an inner vertex x0 but not for a boundary vertex. To design an ODT-based algorithm that works for both inner and boundary vertices, we need to find a vertex-moving scheme by minimizing Eq. (1) on a boundary vertex. For simplicity, we shall adopt a local vertex-by-vertex smoothing strategy, meaning that the optimization problem is restricted to the neighborhood of x* while all other vertices are fixed.
For a boundary vertex x0, the two neighborhoods Ω0 and Ω* are generally different from each other. According to [6], Eq. (1) can be rewritten as follows:
| (3) |
where xk denotes one of the vertices of Ω*, ωk is xk’s neighborhood restricted in Ω*, and |ωk| is its volume. Note that x* is also a vertex in Ω*, we rewrite Eq. (3) into the following equation:
| (4) |
As x0 is a boundary vertex, we let x* move on the tangent plane of the boundary surface at x0 (see Fig. 6 for illustration). Specifically, let x*−x0 = us + vt, where s and t are two orthogonal vectors on the tangent plane and u and v are the corresponding shifting distances. It is worthy noting that moving on the tangent plane guarantees that the volumes of Ω* and Ω0 are equal [20], hence the approach described here can preserve the volume of the original mesh. The interested reader is referred to [27, 28, 33, 50, 68?] for some other techniques on volume-preserving mesh smoothing.
By using the constraint x* = x0 + us + vt, the first two terms on the right-hand side of Eq. (4) become:
| (5) |
where Sτ and nτ are defined the same as in Eq. (2). cτ is any vertex in the triangle tτ. Here we take cτ as the barycenter of tτ. 〈·, ·〉 is the inner product operation.
The remaining term in Eq. (4) is the integral . Suppose are the neighboring vertices of x0 on the boundary of the tetrahedral mesh . The order of yi is determined in the following way: for any i = 1, ⋯, m, the cross product of and points to the outside of Ω0 (let ym+1 = y1). The integral can be rewritten as:
| (6) |
Here X* = x* − x0, Yi = yi − x0, and det(·) is the determinant operation. Note that x* is limited on the tangent plane at x0, hence Eq. (6) is equivalent to:
| (7) |
Eq. (7) appears as a cubic function of u, v. However, we can prove that the coefficients of all cubic terms are actually zero (see [20]). Therefore, the objective function in Eq. (4) is in fact a quadratic function of u, v. By setting the gradient of Eq. (4) as zero, we get a 2 × 2 linear system and the solution of this system corresponds to the minimization of Eq. (4). The interested reader is referred to [20] for the implementation detail.
It is worthwhile pointing out that, when vertices move around in the three mesh smoothing steps (one in surface mesh regeneration and two in tetrahedral mesh generation and improvement), the mesh validity may be violated resulting in self-intersection. The mesh validity is enforced in the current work in two different ways. (1) For surface meshes, consider a vertex v and its adjacent vertices ordered as v0, v1,…vm, where vm = v0. In order for the new position of v, denoted by v’, to be valid, the projection of v’ onto the plane formed by each pair of edges (vi, vi−1) and (vi, vi+1) must lie inside the fan-like partial plane enclosed by the two edges. Otherwise, the vertex v remains unchanged. (2) For tetrahedral meshes, a vertex v is allowed to move to its new position v’ if and only if the volume of each of the adjacent tetrahedra of v does not change its sign.
3. Software Toolkit
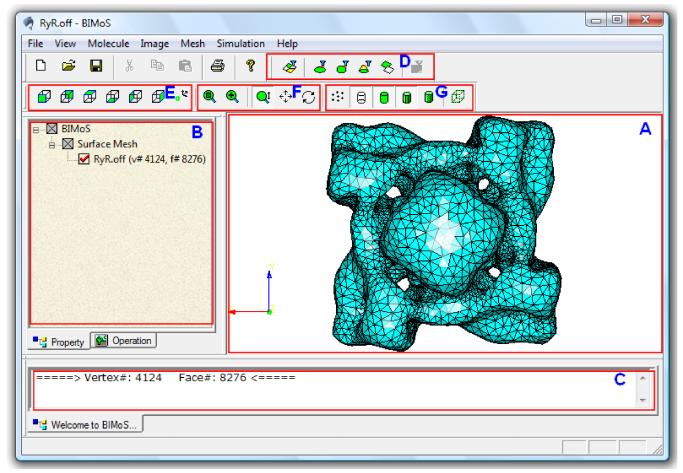
All the algorithms described in Section 2 have been implemented in C++ and incorporated into a user-friendly, OpenGL-based graphical toolkit called BIMoS (or Biomedical Image-based Modeling and Simulation). As shown in Fig. 7, the BIMoS toolkit consists of four modules for different applications: Molecule, Image, Mesh, and Simulation. With the first two modules, the toolkit takes two common types of biomedical structures (i.e., bio-molecules and images) as inputs to generate initial surface meshes that will be further processed for a variety of biological simulation problems. To enhance the usability of the toolkit, an advanced graphical interface is developed, including a main display window (Fig. 7A), a tree-like file-managing window (Fig. 7B) where users can interactively change the property of a given data (such as mesh color), a non-editable information window (Fig. 7C), and a number of icons for convenience of visualization (Fig. 7D-G).
Figure 7.
Illustration of our interactive toolkit on biomedical image-based modeling and simulation (BIMoS). (A) The main display window, which can show multiple models simultaneously. Shown here is a meshed surface of the 3D cryo-electron microscopy (cryo-EM) map of the RyR1 channel [40], downloaded from the EMDataBank (ID=1275, http://emdatabank.org/). The surface mesh was first generated by marching cubes [37] followed by mesh quality improvement provided in BIMoS. (B) The property window showing a tree-like file structure with associated properties. The properties in this window are editable (for example, users can hide, show, delete a model, or change the color properties of the model). (C) The information window showing some general information about the objects and operations (e.g., running time and size of the input image or mesh). This type of information is non-editable. (D) Icons for different approaches to selecting specific regions of a mesh or image. (E) Icons for several standard view directions. (F) Icons for model transformations (selective zooming, scaling, translation, rotation). (G) Icons for different display modes (points, edges, faces, flat or smooth shading, bounding box). In addition, there is a progress bar at the bottom of the window, showing the progress (in percentage) of each running job.
Most related to the present work is the Mesh module in the BIMoS toolkit, which takes not only the meshes directly generated from the molecule and image modules, but also other user-provided surface and tetrahedral meshes in several popular formats. In addition to the algorithms described in Section 2 (i.e., surface mesh regeneration, tetrahedral mesh generation and smoothing), the Mesh module also implements several other important functions, such as feature-preserving surface mesh smoothing and improvement, mesh refinement and coarsening, mesh editing (face deletion, hole-filling, normal correction, etc.), and geometric quantifications (areas, volumes, mesh quality, etc.). The processed meshes can be saved to disks for other applications or may be directly passed along to the Simulation module for biological modeling (not included yet in the current version).
4. Results and Discussions
We have tested the algorithms and toolkit on many different types of input data and obtained very encouraging results. Below we shall demonstrate some examples. All pictures shown are generated by the BIMoS toolkit (Fig. 7).
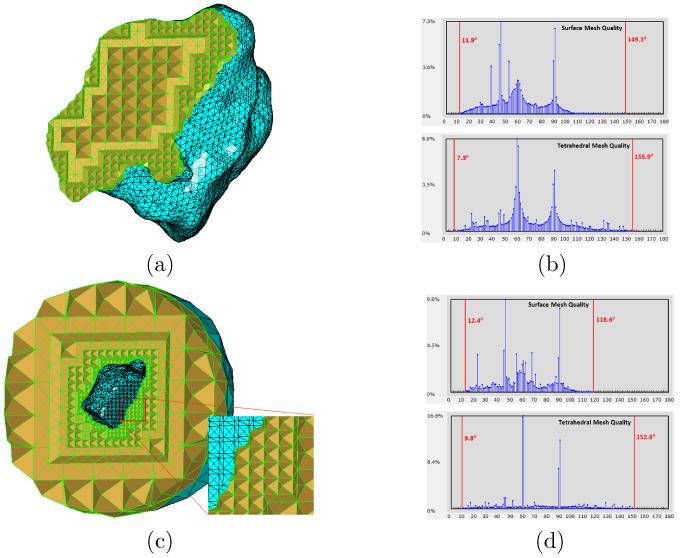
We begin with mesh generation and smoothing on the two sub-cellular structures (t-tubule and jSR) in cardiac myocytes. The input surface mesh models to our algorithms are manually segmented from electron microscopy imaging data and reconstructed via 3D contour-tiling tools, as provided in IMOD [32]. Fig. 8(a) shows the generated tetrahedral mesh from the processed surface mesh (Fig. 2(d)) by using the method described in Section 2.3. To better visualize the mesh, all tetrahedra in front of a cross section have been removed. The histogram of all angles on the domain surface (cyan in Fig. 8(a)) and the histogram of all dihedral angles in the entire domain are shown in Fig. 8(b) (top and bottom, respectively). The minimal and maximal angles (or dihedral angles) are given in the corresponding histograms too. In bio-simulations (e.g., molecular dynamics), it is common to consider the activities outside a given structure, hence we may need to restrict ourselves to the domain between the structure surface and a large bounding shape (mostly a sphere or cube). To this end, we show in Fig. 8(c) an example of tetrahedral mesh generation between the t-tubule and a sphere that is twice as big as the t-tubular structure. The corresponding histograms of both triangular surface mesh and entire tetrahedral mesh are given in Fig. 8(d), together with the minimal and maximal angles (or dihedral angles). From Fig. 8(a&c), we can see that the tetrahedral meshes gradually become denser as the elements approach the structure surfaces, thanks to the octree data structure used. Also, because of the BCC technique in our tetrahedral mesh generation, the majority of the resulting tetrahedra constitute pyramid-like building blocks in the meshes. This observation is further confirmed by the two peaks (at 60° and 90°) in the two histograms of the tetrahedral meshes in Fig. 8(b&d).
Figure 8.
Tetrahedral mesh generation for the t-tubular structure shown in Fig. 2(d). (a) Tetrahedral mesh, consisting of 13, 013 vertices and 52, 040 tetrahedra, inside the given surface domain. (b) The histograms of both domain surface mesh and entire tetrahedral mesh. The minimal and maximal angles (for surface mesh, top) or dihedral angles (for tetrahedral mesh, bottom) are indicated by red vertical bars. (c) Tetrahedral mesh, consisting of 9, 294 vertices and 42, 649 tetrahedra, outside the given surface domain. (d) The histograms of both domain surface mesh and entire tetrahedral mesh.
Note that the tetrahedral mesh in Fig. 8(a) may not be conforming with the mesh in Fig. 8(c) because they are separately generated by the BIMoS toolkit and thus the octree subdivisions are likely different in the interior and exterior domains of the given surface mesh. However, our toolkit provides a third option which allows users to generate tetrahedral meshes in both interior and exterior domains. In this case, the obtained meshes are conforming at the interface of the two domains.
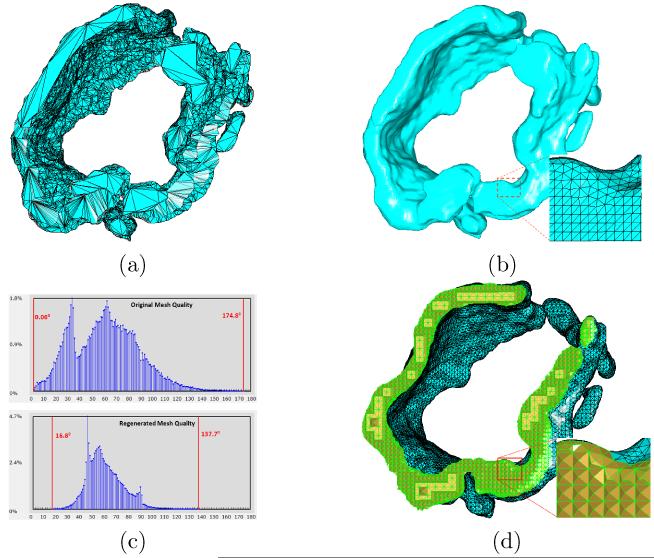
In Fig. 9, we demonstrate the application of our algorithms on the jSR structure. Fig. 9(a) shows the original surface mesh reconstructed from the electron microscopic images of jSR. The regenerated surface mesh is shown in Fig. 9(b). We can see that the original mesh is very noisy and has extremely low angle quality, but the regenerated mesh is significantly improved in terms of smoothness as well as angle quality. Fig. 9(c) further confirms the quality improvement by angle histograms – the minimal angle increases from 0.06° to 16.8° and the maximal angle decreases from 174.8° to 137.7°. The tetrahedral mesh generated from the smoothed surface mesh is shown in Fig. 9(d).
Figure 9.
Surface remeshing and tetrahedral mesh generation for the jSR structure. (a) The original surface mesh, consisting of 9, 695 vertices and 18, 817 triangles, is reconstructed from the electron microscopic images of jSR. (b) The regenerated mesh, with 37, 527 vertices and 75, 046 triangles, has much smoother surface and higher quality. (c) The comparison between the two angle histograms of the meshes in (a) and (b). The red vertical bars in both histograms indicate the minimal and maximal angles. (d) The tetrahedral mesh, generated from the mesh in (b), has 45, 597 vertices and 184, 936 tetrahedra. The minimal and maximal angles on the domain surface are 10.9° and 129.9°, respectively. The minimal and maximal dihedral angles of the entire tetrahedral mesh are 7.0° and 161.0°, respectively.
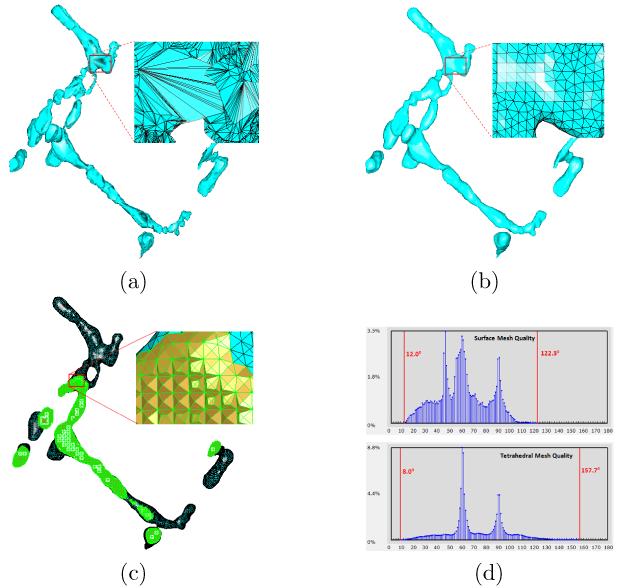
Fig. 10 shows a more complicated t-tubular structure. Fig. 10(a) and (b) show the original and regenerated surface meshes, respectively. While the overall surface shape is very well preserved, the mesh quality is largely improved by using the mesh regeneration approach. Fig. 10(c) shows the generated tetrahedral mesh. The corresponding histograms of the surface mesh and entire tetrahedral mesh are given in Fig. 10(d), where the minimal and maximal angles (or dihedral angles) are indicated by the red vertical bars.
Figure 10.
Surface remeshing and tetrahedral mesh generation for a more complicated t-tubular structure. (a) The original surface mesh consists of 38, 557 vertices and 48, 018 triangles. (b) The regenerated mesh, with 7, 721 vertices and 15, 442 triangles, shows much smoother surface and higher quality. (c) The tetrahedral mesh, generated from the mesh in (b), has 24, 912 vertices and 94, 424 tetrahedra. (d) The histograms of both domain surface mesh and entire tetrahedral mesh. The minimal and maximal angles (or dihedral angles) are indicated by red vertical bars.
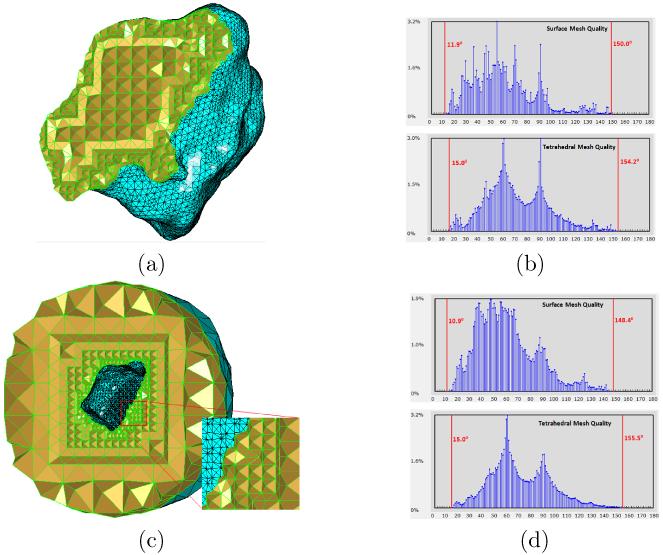
To demonstrate the performance of the tetrahedral mesh smoothing algorithm as described in Section 2.4, the tetrahedral meshes in Fig. 8(a) and (c) are used as inputs and the smoothed meshes are shown in Fig. 11(a) and (c), respectively. We can see that tetrahedra near the domain surface are most affected by the smoothing algorithm, as the domain surface is where the low quality often occur. To see how the tetrahedral mesh quality is improved, we show the histograms of angles (or dihedral angles) of the domain surface meshes (or entire tetrahedral meshes) in Fig. 11(b) and (d), corresponding to the two meshes in Fig. 11(a) and (c) respectively. We can see that the quality (particularly, the minimal dihedral angles) of both tetrahedral meshes have been significantly improved. The algorithm, however, was unable to improve the surface mesh quality in these two examples, as both surface meshes in Fig. 11(a) and (c) have already possessed decent quality.
Figure 11.
Illustration of the tetrahedral mesh smoothing algorithm. (a) The smoothed tetrahedral mesh, where the input is the mesh in Fig. 8(a). (b) The histograms of both surface mesh and tetrahedral mesh in (a). (c) The smoothed tetrahedral mesh with the mesh in Fig. 8(c) as input. (d) The histograms of both surface mesh and tetrahedral mesh in (c). The improvement on tetrahedral mesh quality is noticeable, as compared to Fig. 8(b&d).
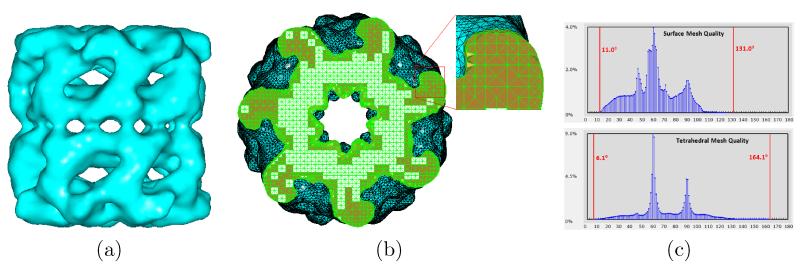
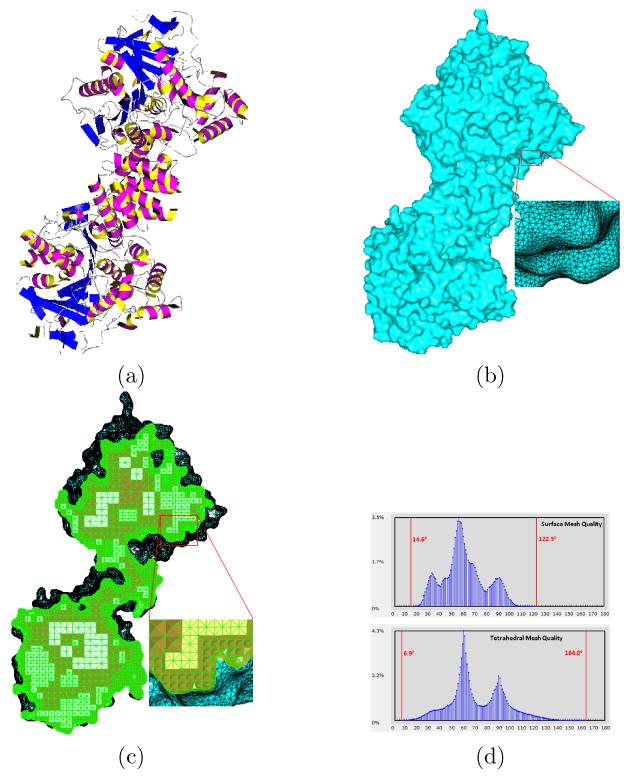
Our toolkit is also capable of generating high-quality surface and tetrahedral meshes from some other biological data. Fig. 12(a) gives an iso-surface mesh of the single particle cryo-EM density map for GroEL [39]. Fig. 12(b) shows the tetrahedral mesh generated by BIMoS and the mesh qualities are given in Fig. 12(c). To demonstrate the capability of BIMoS in molecular mesh generation, we consider a molecule (PDB-ID: 2HAO), as shown in Fig. 13(a). Fig. 13(b) show the high-quality surface mesh generated by our toolkit, where the algorithm was outlined in [66]. The tetrahedral mesh generation algorithm described in Section 2.3 is applied to the surface mesh and the tetrahedral mesh obtained is shown in Fig. 13(c). From the angle (or dihedral angle) histograms in Fig. 13(d), we can see that our algorithm is able to retain the mesh quality on the surface and generate quality-guaranteed tetrahedra in the entire domain.
Figure 12.
Surface and tetrahedral mesh generation on a single particle cryo-EM structure (GroEL, EMDataBank ID=1080) [39]. (a) The segmented surface mesh using iso-surfacing (with 18, 705 vertices and 37, 626 triangles). (b) The tetrahedral mesh (with 165, 391 vertices and 707, 328 tetrahedra) generated by our toolkit. (c) The histograms of angles on the surface and dihedral angles in the tetrahedral mesh in (b). The minimal and maximal angles (or dihedral angles) are indicated by red vertical bars.
Figure 13.
Surface and tetrahedral mesh generation on a molecular structure. (a) A molecule with 8, 418 atoms (PDB-ID: 2HAO, downloaded from http://www.rcsb.org/pdb/). (b) The surface mesh (with 127, 474 vertices and 254, 892 triangles) generated by our toolkit. The minimal and maximal angles are 18.1° and 135.5°, respectively. (c) The tetrahedral mesh (with 144, 918 vertices and 629, 306 tetrahedra) generated by our toolkit. (d) The histograms of angles on the surface and dihedral angles in the tetrahedral mesh in (c). The minimal and maximal angles (or dihedral angles) are indicated by red vertical bars.
It is worth noting that the mesh size increases significantly when the octree is refined. In our software, we have a parameter for users to control the depth (or height) of the octree, which is suggested to be 6–8 levels. However, the drawback of not using a high-enough octree is that some fine details on a given surface mesh may not be captured in the generated tetrahedral mesh. To capture surface details with a minimal number of elements, one may have to sacrifice the mesh quality (e.g., by allowing more than 1-depth-disparity as discussed in Section 2.3.1). While it is difficult to achieve all three goals simultaneously, we decide to keep a guaranteed mesh quality in our software but let users to decide between higher surface accuracy or smaller mesh sizes by using the provided parameter (i.e., height of the octree). In general, the topology in the given surface mesh can be correctly preserved if the octree is sufficiently refined. However, as mentioned above, too much refinement usually yields an unacceptably large tetrahedral mesh. The described software tool currently does not have the capability of exact topology preservation. Some recent techniques (such as [70]) will be explored in the future to improve our tool.
5. Conclusion
We presented computational approaches to generating and improving tetrahedral mesh models from very low-quality surface meshes that are originally reconstructed from 3D electron microscopic imaging data. The guaranteed quality of the obtained tetrahedral meshes provides good geometric models for finite element simulation. All these algorithms have been implemented in C++ and encapsulated into a software toolkit called BIMoS with a user-friendly graphical interface. The BIMoS toolkit is currently freely available in a binary form at www.bimos.org. A new version with the source code wherever the copyright permits will be made accessible on the same web-site. Although this paper is focused on the application of cardiac subcellular structures, the algorithms and software toolkit described are also applicable to other types of imaging data and mesh models.
Related to the current work are two problems we are working on. One is semi-automatic image segmentation requiring a minimal amount of user intervention. This can significantly reduce users’ burden on manual contour segmentation that our current work depends on. The other problem in progress is to utilize the produced tetrahedral meshes to study calcium dynamics and cell contraction in cardiac myocytes.
Acknowledgments
The work described was supported in part by an NIH Award (Number R15HL103497) from the National Heart, Lung, and Blood Institute (NHLBI) and the UWM Research Growth Initiative. Hoshijima is partly supported by American Heart Association (0840013N). Microscopy image acquisition was with Dr. Mark Ellisman of National Center for Microscopy and Imaging Research Center (P41RR004050).
Footnotes
Publisher's Disclaimer: This is a PDF file of an unedited manuscript that has been accepted for publication. As a service to our customers we are providing this early version of the manuscript. The manuscript will undergo copyediting, typesetting, and review of the resulting proof before it is published in its final citable form. Please note that during the production process errors may be discovered which could affect the content, and all legal disclaimers that apply to the journal pertain.
Conflict of Interest
The authors declare no conflict of interest.
References
- [1].Albu AB, Beugeling T. A morphology-based approach for interslice interpolation of anatomical slices from volumetric images. IEEE Transactions on Medical Imaging. 2008;55(8):2022–2038. doi: 10.1109/TBME.2008.921158. [DOI] [PubMed] [Google Scholar]
- [2].Alliez P, Cohen-Steiner D, Yvinec M, Desbrun M. Variational Tetrahedral Meshing. ACM Transactions on Graphics. 2005;24(3):617–625. [Google Scholar]
- [3].Bank RE, Smith RK. Mesh smoothing using a posteriori error estimates. SIAM Journal on Numerical Analysis. 1997;34(3):979–997. [Google Scholar]
- [4].Boyd SK, Muller R. Smooth Surface Meshing for Automated Finite Element Model Generation from 3D Image Data. Journal of Biomechanics. 2006;39:1287–1295. doi: 10.1016/j.jbiomech.2005.03.006. [DOI] [PubMed] [Google Scholar]
- [5].Chen L. Mesh smoothing schemes based on optimal Delaunay triangulations. The 13th International Meshing Roundtable. 2004:109–120. [Google Scholar]
- [6].Chen L, Xu J. Optimal Delaunay Triangulations. Journal of Computational Mathematics. 2004;22(2):299–308. [Google Scholar]
- [7].Chew LP. Guaranteed-quality Delaunay meshing in 3D. Proc. of The 13th Annual Symposium on Computational Geometry. 1997:391–393. [Google Scholar]
- [8].Choi W, Kwak D, Son I, Im Y. Tetrahedral Mesh Generation based on Advancing Front Technique and Optimization Scheme. International Journal for Numerical Methods in Engineering. 2003;58:1857–1872. [Google Scholar]
- [9].Couprie C, Grady L, Najman L, Talbot H. Power Watershed: A Unifying Graph-Based Optimization Framework. IEEE Transactions on Pattern Analysis and Machine Intelligence. 2011;33(7):1384–1399. doi: 10.1109/TPAMI.2010.200. [DOI] [PubMed] [Google Scholar]
- [10].Dada JO, Mendes P. Multi-Scale Modelling and Simulation in Systems Biology. Integrative Biology. 2011;3:86–96. doi: 10.1039/c0ib00075b. [DOI] [PubMed] [Google Scholar]
- [11].d’Otreppe V, Boman R, Ponthot J-P. Generating smooth surface meshes from multi-region medical images. International Journal for Numerical Methods in Biomedical Engineering. 2012;28(6-7):642–660. doi: 10.1002/cnm.1471. [DOI] [PubMed] [Google Scholar]
- [12].Du Q, Wang D. Tetrahedral mesh generation and optimization based on centroidal Voronoi tessellations. Int. J. Numer. Meth. Engng. 2003;56:1355–1373. [Google Scholar]
- [13].Escobar JM, Montenegro R, Montero G, Rodríguez E, Gonzáez-Yuste JM. Smoothing and local refinement techniques for improving tetrahedral mesh quality. Computers and Structures. 2005;83(28-30):2423–2430. [Google Scholar]
- [14].Feng X, Xia K, Tong Y, Wei GW. Geometric modeling of subcellular structures, organelles, and multiprotein complexes. International Journal for Numerical Methods in Biomedical Engineering. 2012;28(12):1198–223. doi: 10.1002/cnm.2532. [DOI] [PMC free article] [PubMed] [Google Scholar]
- [15].Field DA. Laplacian smoothing and Delaunay triangulations. Communications in Applied Numerical Methods. 1988;4(6):709–712. [Google Scholar]
- [16].Frangakis AS, Bohm J, Forster F, Nickell S, Nicastro D, Typke D, Hegerl R, Baumeister W. Identification of macromolecular complexes in cryoelectron tomograms of phantom cells. Proc Natl Acad Sci U S A. 2002;99(22):14153–14158. doi: 10.1073/pnas.172520299. [DOI] [PMC free article] [PubMed] [Google Scholar]
- [17].Freitag LA. On combining Laplacian and optimization-based mesh smoothing techniques. Trends in Unstructured Mesh Generation. 1997:37–43. [Google Scholar]
- [18].Freitag LA, Ollivier-Gooch C. Tetrahedral mesh improvement using swapping and smoothing. International Journal for Numerical Methods in Engineering. 1997;40(21):3979–4002. [Google Scholar]
- [19].Frey P, Borouchaki H, George P. Delaunay Tetrahedralization Using an Advancing Front Approach. Proc. of 5th Intl. Meshing Roundtable. 1996:31–46. [Google Scholar]
- [20].Gao Z, Yu Z, Holst M. Quality Tetrahedral Mesh Smoothing via Boundary-Optimized Delaunay Triangulation. Computer Aided Geometric Design. 2012;29(9):707–721. doi: 10.1016/j.cagd.2012.07.001. [DOI] [PMC free article] [PubMed] [Google Scholar]
- [21].George P, Frey P. Mesh Generation. 2nd Edition Wiley; 2008. [Google Scholar]
- [22].Gonzalez RC, Woods RE. Digital Image Processing. Addison-Wesley; 1992. [Google Scholar]
- [23].Hansbo P. Generalized Laplacian smoothing of unstructured grids. Communications in Numerical Methods in Engineering. 1995;11(5):455–464. [Google Scholar]
- [24].Hayashi T, Martone ME, Yu Z, Thor A, Doi M, Holst M, Ellisman MH, Hoshijima M. Three-dimensional reconstruction reveals new details of membrane systems for calcium signaling in the heart. Journal of Cell Science. 2009;122:1005–1013. doi: 10.1242/jcs.028175. [DOI] [PMC free article] [PubMed] [Google Scholar]
- [25].Herrmann LR. Laplacian-isoparametric grid generation scheme. Journal of the Engineering Mechanics Division. 1976;102(5):749–907. [Google Scholar]
- [26].Izu LT, Means SA, Shadid JN, Chen-Izu Y, Balke CW. Interplay of ryanodine receptor distribution and calcium dynamics. Biophys. J. 2006;91:95–112. doi: 10.1529/biophysj.105.077214. [DOI] [PMC free article] [PubMed] [Google Scholar]
- [27].Jiao X. Volume and feature preservation in surface mesh optimization. Proc. 15th Int. Meshing Roundtable. 2006:359–374. [Google Scholar]
- [28].Jiao X, Wang D, Zha H. Simple and effective variational optimization of surface and volume triangulations. Engineering with Computers. 2011;27:81–94. [Google Scholar]
- [29].Johnson E, Zhang Y, Shimada K. Estimating an equivalent wall-thickness of a cerebral aneurysm through surface parameterization and a non-linear spring system. International Journal for Numerical Methods in Biomedical Engineering. 2011;27(7):1054–1072. [Google Scholar]
- [30].Klingner BM, Shewchuk JR. Aggressive tetrahedral mesh improvement. Proceedings of the 16th international Meshing Roundtable. 2008:3–23. [Google Scholar]
- [31].Koh X, Srinivasan B, Ching HS, Levchenko A. A 3D Monte Carlo analysis of the role of dyadic space geometry in spark generation. Biophys. J. 2006;90:1999–2014. doi: 10.1529/biophysj.105.065466. [DOI] [PMC free article] [PubMed] [Google Scholar]
- [32].Kremer JR, Mastronarde DN, McIntosh JR. Computer visualization of three-dimensional image data using IMOD. J. Struct. Biol. 1996;116:71–76. doi: 10.1006/jsbi.1996.0013. [DOI] [PubMed] [Google Scholar]
- [33].Kuprata A, Khamaysehb A, Georgec D, Larkeyd L. Volume conserving smoothing for piecewise linear curves, surfaces, and triple lines. Journal of Computational Physics. 2001;172(1):99–118. [Google Scholar]
- [34].Labelle F, Shewchuk J. Isosurface Stuffing: Fast Tetrahedral Meshes with Good Dihedral Angles. ACM Transactions on Graphics. 2007;26(3):57.1–57.10. [Google Scholar]
- [35].Lawrence A, Bouwer JC, Perkins G, Ellisman MH. Transform-based backprojection for volume reconstruction of large format electron microscope tilt series. J. Struct. Biol. 2006;154:144–167. doi: 10.1016/j.jsb.2005.12.012. [DOI] [PubMed] [Google Scholar]
- [36].Liu WK, Lee TR, Kopacz AM, Kim H, Stroberg W, Man HB, Ho D, Kim MK, Chung JH, Decuzzi P. Multiscale framework for biomedical simulation from molecular dynamics to continuum mechanics. Journal of the Serbian Society for Computational Mechanics. 2011;5(2):61–80. [Google Scholar]
- [37].Lorensen WE, Cline HE. Marching cubes: a high resolution 3D surface construction algorithm. Computer Graphics. 1987;21:163–169. [Google Scholar]
- [38].Lu S, Michailova A, Saucerman J, Cheng Y, Yu Z, Kaiser T, Li W, Bank R, Holst M, Mccammon J, Hayashi T, Hoshijima M, Arzberger P, McCulloch A. Multiscale modeling in rodent ventricular myocytes. Engineering in Medicine and Biology Magazine, IEEE. 2009;28(2):46–57. doi: 10.1109/MEMB.2009.931787. [DOI] [PMC free article] [PubMed] [Google Scholar]
- [39].Ludtke SJ, Jakana J, Song JL, Chuang DT, Chiu W. A 11.5 A single particle reconstruction of GroEL using EMAN. J. Mol. Biol. 2001;314:253–262. doi: 10.1006/jmbi.2001.5133. [DOI] [PubMed] [Google Scholar]
- [40].Ludtke SJ, Serysheva II, Hamilton SL, Chiu W. The pore structure of the closed RyR1 channel. Structure. 2005;13:1203–1211. doi: 10.1016/j.str.2005.06.005. [DOI] [PMC free article] [PubMed] [Google Scholar]
- [41].Malladi R, Sethian JA, Vemuri BC. Shape modeling with front propagation: A level set approach. IEEE Trans. Pattern Anal. Machine Intell. 1995;17(2):158–175. [Google Scholar]
- [42].Michailova A, DelPrincipe F, Egger M, Niggli E. Spatiotemporal features of Ca2+ buffering and diffusion in atrial cardiac myocytes with inhibited sarcoplasmic reticulum. Biophysical Journal. 2002;83:3134–3151. doi: 10.1016/S0006-3495(02)75317-4. [DOI] [PMC free article] [PubMed] [Google Scholar]
- [43].Molino N, Bridson R, Teran J, Fedkiw R. A Crystalline, Red Green Strategy for Meshing Highly Deformable Objects with Tetrahedra. Proc. of the 12th Intl. Meshing Roundtable. 2003:103–114. [Google Scholar]
- [44].Nave D, Chrisochoides N, Chew LP. Guaranteed-quality parallel Delaunay refinement for restricted polyhedral domains. Computational Geometry: Theory and Applications. 2004;28(2-3):191–215. [Google Scholar]
- [45].Owen S. A Survey of Unstructured Mesh Generation Technology. Proc. 7th Intl. Meshing Roundtable. 1998:239–267. [Google Scholar]
- [46].Perkins GA, Renken CW, Song JY, Frey TG, Young ST, Lamont S, Martone ME, Lindsey S, Ellisman MH. Electron tomography of large, multicomponent biological structures. J. Struct. Biol. 1997;120:219–227. doi: 10.1006/jsbi.1997.3920. [DOI] [PubMed] [Google Scholar]
- [47].Rineau L, Yvinec M. A generic software design for Delaunay refinement meshing. Comput. Geom. Theory Appl. 2007;38:100–110. [Google Scholar]
- [48].Sazonov I, Nithiarasu P. Semi-automatic surface and volume mesh generation for subject-specific biomedical geometries. International Journal for Numerical Methods in Biomedical Engineering. 2012;28(1):133–157. doi: 10.1002/cnm.1470. [DOI] [PubMed] [Google Scholar]
- [49].Sazonov1 I, Yeo SY, Bevan RL, Xie X, van Loon R, Nithiarasu P. Modelling pipeline for subject-specific arterial blood flowA review. International Journal for Numerical Methods in Biomedical Engineering. 2011;27(12):1868–1910. [Google Scholar]
- [50].Semenova IB, Savchenko VV, Hagiwara I. Two techniques to improve mesh quality and preserve surface characteristics. Proceedings of 13th Int. Meshing Roundtable. 2004:277–288. [Google Scholar]
- [51].Sethian JA. Level Set Methods and Fast Marching Methods. 2nd edition Cambridge University Press; 1999. [Google Scholar]
- [52].Shewchuk JR. Constrained Delaunay tetrahedralizations and provably good boundary recovery. Proc. of 11th Intl. Meshing Roundtable. 2002 [Google Scholar]
- [53].Shi J, Malik J. Normalized cuts and image segmentation. Proceedings of IEEE Conference on Computer Vision and Pattern Recognition. 1997:731–737. [Google Scholar]
- [54].Si H, Gartner K. Meshing piecewise linear complexes by constrained Delaunay tetrahedralizations. Proceedings of the 14th International Meshing Roundtable. 2005 [Google Scholar]
- [55].Stern MD. Theory of Excitation-Contraction Coupling in Cardiac Muscle. Biophys. J. 1992;63:497–517. doi: 10.1016/S0006-3495(92)81615-6. [DOI] [PMC free article] [PubMed] [Google Scholar]
- [56].Tezduyar TE, Takizawa K, Brummer T, Chen PR. Space-time fluid-structure interaction modeling of patient-specific cerebral aneurysms. International Journal for Numerical Methods in Biomedical Engineering. 2011;27(11):1665–1710. [Google Scholar]
- [57].Valette S, Chassery JM, Prost R. Generic Remeshing of 3D Triangular Meshes with Metric-Dependent Discrete Voronoi Diagrams. IEEE Transactions on Visualization and Computer Graphics. 2008;14:369–381. doi: 10.1109/TVCG.2007.70430. [DOI] [PubMed] [Google Scholar]
- [58].Volkmann N. A novel three-dimensional variant of the watershed transform for segmentation of electron density maps. J Struct Biol. 2002;138:123–129. doi: 10.1016/s1047-8477(02)00009-6. [DOI] [PubMed] [Google Scholar]
- [59].Wang J, Yu Z. Feature-Sensitive Tetrahedral Mesh Generation with Guaranteed Quality. Computer-Aided Design. 2012;44(5):400–412. doi: 10.1016/j.cad.2012.01.002. [DOI] [PMC free article] [PubMed] [Google Scholar]
- [60].Whitley D. Drug Design Strategies: Computational Techniques and Applications. RSC Drug Discovery. The Royal Society of Chemistry; Cambridge: 2012. Analysing molecular surface properties; pp. 184–209. [Google Scholar]
- [61].Xu H, Newman TS. An angle-based optimization approach for 2D finite element mesh smoothing. Finite Elements in Analysis and Design. 2006;42:1150–1164. [Google Scholar]
- [62].Yan D-M, Lévy B, Liu Y, Sun F, Wang W. Isotropic Remeshing with Fast and Exact Computation of Restricted Voronoi Diagram. Computer Graphics Forum. 2009;28(5):1445–1454. [Google Scholar]
- [63].Yerry M, Shephard M. Automatic Three-Dimensional Mesh Generation by the Modified-Octree Technique. International Journal for Numerical Methods in Engineering. 1984;20(11):1965–1990. [Google Scholar]
- [64].Yu Z, Bajaj C. Image Segmentation Using Gradient Vector Diffusion and Region Merging. Proceedings of International Conference on Pattern Recognition. 2002:941–944. [Google Scholar]
- [65].Yu Z, Holst MJ, McCammon JA. High-fidelity geometric modeling for biomedical applications. Finite Elements in Analysis and Design. 2008;44(11):715–723. [Google Scholar]
- [66].Yu Z. A list-based method for fast generation of molecular surfaces. Proceedings of the 31st Intl Conf. of IEEE Engineering in Medicine and Biology Society. 2009:5909–5912. doi: 10.1109/IEMBS.2009.5334843. [DOI] [PMC free article] [PubMed] [Google Scholar]
- [67].Zhang Y, Bajaj C, Sohn S. 3D finite element meshing from imaging data. Computer Methods in Applied Mechanics and Engineering. 2005;194(48-49):5083–5106. doi: 10.1016/j.cma.2004.11.026. [DOI] [PMC free article] [PubMed] [Google Scholar]
- [68].Zhang Y, Bajaj C, Xu G. Surface smoothing and quality improvement of quadrilateral/hexahedral meshes with geometric flow. Proceedings of the 14th International Meshing Roundtable. 2005:449–468. [Google Scholar]
- [69].Zhang Y, Hughes TJR, Bajaj CL. An automatic 3D mesh generation method for domains with multiple materials. Computer Methods in Applied Mechanics and Engineering. 2010;199(5-8):405–415. doi: 10.1016/j.cma.2009.06.007. [DOI] [PMC free article] [PubMed] [Google Scholar]
- [70].Zhang Y, Qian J. Dual contouring for domains with topology ambiguity. Computer Methods in Applied Mechanics and Engineering. 2012;217-220:34–45. [Google Scholar]
- [71].Zhou T, Shimada K. An angle-based approach to two-dimensional mesh smoothing. Proceedings of the 9th International Meshing Roundtable. 2000:373–384. [Google Scholar]


