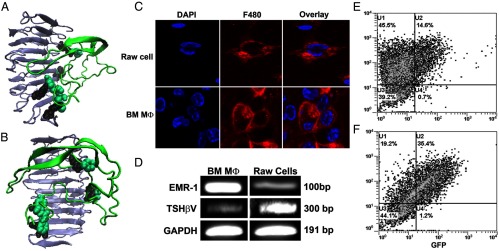
Figure 4.

(A and B) TSH-βv binding to the TSHR ECD. Computer modeling of the TSH-βv binding with the TSHR ECD showed docking of the peptide (green) at the concave surface of the leucine-rich repeat region (gray/black). Two rotated views are illustrated. The binding affinity of the variant was comparable with that of the native TSH-β subunit (638 vs 649 μm, respectively). (C–F) MØ phenotyping. (C) Validation of MØ content in BMDMØ cultures was obtained by staining for F480+ surface antigen (red) in a similar way to RAW cells, a MØ cell line, as a positive control. (D) By conventional PCR, the EMR1 gene, a specific MØ marker, was expressed in both BMDMØ and RAW cell cultures, and both were transcribed TSH-βv. (E and F) The BMDMØs were then subjected to FACS analysis to determine their M1 (C) vs M2 (D) phenotype. Analyses showed that 14.6% of the cells were of the M1 phenotype (CD-11c+), and 35.6% of the cells were of the M2 phenotype (CD14+). GAPDH, glyceraldehydes-3-phosphate dehydrogenase; DAPI, 4′,6′-diamidino-2-phenylindole. GFP, green fluorescence protein.
