

Abstract
OBJECTIVE
This study sought to investigate the progression and regression of diabetic retinopathy (DR) and the effects of population risk factors on the rates of transition across retinopathy stages.
RESEARCH DESIGN AND METHODS
The study cohort consisted of 44,871 observed DR events between the calendar years 1990 and 2011 for 4,758 diabetic patients who were diagnosed at 35 years of age or older. The first retinal observation was recorded within a year from diagnosis, and the result was recorded as free of retinopathy. A multistate Markov model was applied for analyzing the development of DR and its relation to the patterns of changes in risk factors.
RESULTS
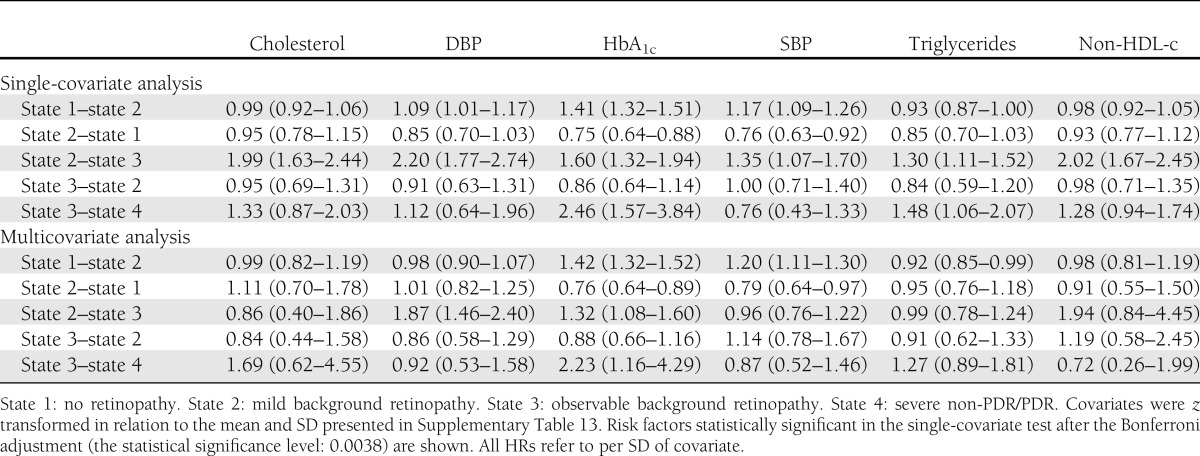
We observed a consistent risk effect of HbA1c on the progression (no retinopathy to mild background DR [BDR] hazard ratio per SD of HbA1c [HR] 1.42 [95% CI 1.32–1.52], mild BDR to observable BDR HR 1.32 [95% CI 1.08–1.60], and observable BDR to severe nonproliferative/proliferative DR HR 2.23 [95% CI 1.16–4.29]). Similarly, systolic blood pressure (SBP) and diastolic blood pressure increased the risk for the transition from the asymptomatic phase to mild BDR (HR 1.20 [95% CI 1.11–1.30]) and the mild BDR to observable BDR (HR 1.87 [95% CI 1.46–2.40]), respectively. Regression from mild BDR to no DR was associated with lower SBP (HR 0.79 [95% CI 0.64–0.97]) and lower HbA1c (HR 0.76 [95% CI 0.64–0.89]).
CONCLUSIONS
Progression and regression of DR were strongly associated with blood pressure and glycemic exposure.
Diabetic retinopathy (DR) is a microvascular complication of diabetes and is a significant cause of visual impairment and blindness among patients with diabetes. More than 60% of patients with type 2 diabetes are estimated to eventually develop retinopathy (1,2). The development of DR is broadly classified into nonproliferative and proliferative stages (3). The nonproliferative stage is characterized by the formation of microaneurysms caused by capillary nonperfusion or abnormal permeability (3). The advanced proliferative stage develops when retinal ischemia occurs, stimulating the growth of new blood vessels (namely, neovascularization) (3). The hemorrhage of these fragile blood vessels leads to blood accumulation in the vitreous cavity, potentially resulting in visual impairment (3). Currently, effective therapeutic interventions remain limited and are based around laser photocoagulation.
The existing, multistage classification of DR development has prompted the wide use of categorical data analysis strategies in clinical studies. Commonly, cross-sectional studies use DR case and control samples in logistic regression analysis or contingency tables for modeling population risk factor effects (4–7). Other studies have used the longitudinal nature of DR progression in proportional hazard models (8,9). To date, however, only one study (10) has included intermediate states from longitudinal, multistate DR data in the analysis, an approach that provides an increased ability to decipher the stage-wise development of retinopathy compared with a simple survival analysis. In the Genetics of Diabetes Audit and Research in Tayside Scotland (GoDARTS) database, we have ongoing, longitudinal collection of DR clinical outcome from 1990 for Tayside patients with diabetes, and additionally we have access to all biochemistry measurements for these patients. These rich data resources enable us to investigate changes in patients’ retinal status over the duration of their diabetes. A multistate Markov model was developed to analyze panel data of a complex, multistaged disease process in continuous time (11). This longitudinal analysis approach has recently been applied in a wide range of medical fields, including hepatic cancer (12), diabetes complications (10,13), breast cancer screening (14), and liver cirrhosis (15). The early study (10) on DR using the multistate Markov approach was not able to assess the clinical effects of relevant risk factors on DR state transitions, possibly owing to insufficient computational power back in the mid-1990s. In this study, we have used the GoDARTS database to incorporate longitudinal measures of multiple risk factors and assess their role in the specific developmental stages of DR.
RESEARCH DESIGN AND METHODS
Description of data
We performed a prospective cohort study of DR in Tayside, Scotland. Diabetic patients’ ophthalmology records were ascertained from the Scottish Care Information Diabetes Collaboration (SCIDC), a Scotland-wide computerized diabetes register. Retinal screening has been undertaken in Tayside since 1990, initially using Polaroid images, with a progression to digital imaging in 2000. The Tayside DR screening protocol has previously been described (16). In brief, patients undergo screening for diabetic eye disease from diagnosis. Patients’ retinopathy stages are determined from grading of single-field 45-degree retinal photographs where staged mydriasis is given. Retinal screening was previously shown to have a sensitivity of >80% (17,18) and since 2006 has been adopted as a national screening program in Scotland (19). The ophthalmology data include DR stages and dates. The retinal events of interest are on a scale from no retinopathy, mild background DR (BDR), observable BDR to severe nonproliferative/proliferative DR (non-PDR/PDR), and diagnostic criteria are described in Supplementary Table 1. All retinal events were separately recorded for both eyes. We observed that the numbers of DR events and the distributions of follow-up time collected for both eyes were comparable, and to preclude the artifacts reflected as observed remission and recurrence of the final, stable phase of DR, produced from compounding longitudinal data from both eyes, we collated and analyzed retinopathy data from the same eye.
The ophthalmology data used in this study were from the complete calendar years 1990–2011. GoDARTS is a study of patients with a diagnosis of type 2 diabetes, but we further reduced the chance of including misclassified type 1 diabetes patients by only considering subjects who were diagnoses with diabetes at 35 years of age or older. The cohort included patients who had at least two longitudinal retinal records. The primary start point for this study obtained from this dataset was the first retinal record indicative of no retinopathy within 1 year from the date of diabetes diagnosis. Patients were followed until the onset of severe non-PDR/PDR, date of death, or 16 years’ duration of diabetes. Intermediate retinopathy observations were included in this study.
Additional independent datasets (e.g., demography and regional biochemistry database) were integrated through electronic record linkage (20). Population risk factors extracted were sex, smoking status (ever smoked against never smoked), and longitudinal records of age, BMI, total cholesterol, serum creatinine, diastolic blood pressure (DBP), HbA1c, HDL cholesterol (HDL-c), systolic blood pressure (SBP) and triglycerides. Non-HDL-c was estimated from total cholesterol and HDL-c measurements recorded on an identical date. As LDL cholesterol (LDL-c) measurements were often missing, throughout this study non-HDL-c was considered a valid surrogate for LDL-c, which was in concordance with a prior estimate of Pearson correlation coefficient (0.987) that we attained using weighted mean non-HDL-c and LDL-c in the overall GoDARTS sample (16,928 subjects). Time-variant covariates were matched to a retinal event that occurred at the closest time point. Covariates measured on a quantitative scale were standardized by sample mean and SD. In this study, we only included patients with the complete set of covariate data.
Multistate model
The discrete, nonoverlapping stages of DR were translated into distinctive states in the multistate model. The effect of explanatory variables on DR development is modeled in an adapted form of proportional hazard model (10) (Supplementary Note). Patients' diabetic duration at retinal examination was considered in the model. Between follow-up visits, patients' DR development is usually unmonitored, and the exact time of transition from one state to the other is unknown. Thus, we specified a relevant sampling scheme to accommodate an intermittently observed disease process.
Model fitting and comparisons
DR data were analyzed in R (version 2.14.2) software environment, using the “msm” package (version 1.1.1). We postulated two baseline multistate models, which together aimed to decipher the process underlying the development of DR from the observed retinal event data by modeling distinct putative transition paths between states. In the first model, DR development is modeled as one-way progression (Fig. 1A), and misclassification was allowed to occur between adjacent states except for the absorbing state (Supplementary Note). The second model is specified by a two-way transition intensity matrix and an identical misclassification probability matrix (Fig. 1B and Supplementary Note). The best-fitted model was selected from likelihood ratio (LR) tests and Akaike information criterion (AIC) statistic. This model was then used for assessing covariate effects. Covariate model selection procedures also used LR and AIC measures. The study complies with the Declaration of Helsinki.
Figure 1.
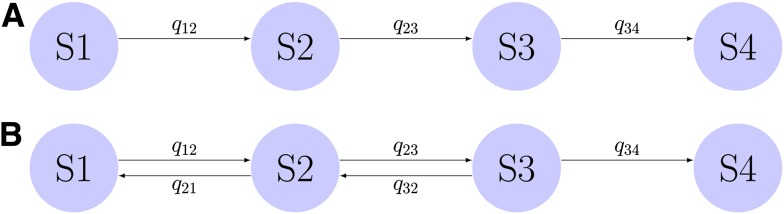
A: A base multistate Markov model describes one-way transition of four states of DR. B: A second base model describes two-way transition of four states of DR. The process of entering the final absorbing state is irreversible. Rates of transition (or transition intensities) are specified as qij, where transition occurs from the current state i to the future state j.
RESULTS
Characteristics of the study sample
Overall, 49,959 retinal measurements were studied in 4,758 diabetes patients (Supplementary Table 2). At the end of this study, 100 patients developed severe non-PDR/PDR (Supplementary Table 2). The full raw data on numbers and prevalence of retinal events, state transitions, and additionally, the statistically estimated misclassification probabilities are shown in Supplementary Tables 2–7 and 10, Fig. 2, and Supplementary Fig. 2.
Figure 2.

Prevalence of DR in the GoDARTS panel data by duration of diabetes. This shows the retinopathy state as a percentage of the sample, recorded at each year of duration of diabetes from 1 to 16 years of diabetes duration.
Baseline model without risk factor adjustment
Initial unadjusted modeling demonstrated the better fit of the two-way transition model (one-way transition model AIC 32,042.2, two-way transition model AIC 31,574.2; P < 0.0001). A comparison between the observed and model-predicted prevalence indicated a close fit of the model to the DR data and thus supported the internal validity of the model (Supplementary Fig. 1).
This model indicated that the rates of remission from mild BDR to a DR-free state and from observable BDR to mild BDR were significantly faster than the rates of progression (2.0 times faster and 4.2 times faster, respectively), with the remission from observable to mild being almost double the rate of that observed for mild to no retinopathy (Supplementary Table 8). The expected total length of time for DR-free, mild BDR, observable BDR, and severe non-PDR/PDR states were 12.6 years (95% CI 12.41–12.83), 2.91 years (95% CI 2.70–3.11), 0.37 years (95% CI 0.27–0.48), and 0.11 years (95% CI 0.06–0.19), respectively. For the maximum follow-up time (16 years), the estimated transition matrix showed 26, 4.3, and 2% probabilities that a patient free of DR will progress to mild background, observable, and severe non-PDR/PDR, respectively (Supplementary Table 9).
Assessment of traditional risk factors
We standardized values of BMI, cholesterol, creatinine, DBP, HbA1c, HDL-c, SBP, triglycerides, and non-HDL-c (Supplementary Table 13). As we have the full longitudinal medical record of each patient, we adjusted each specific retinal event using risk factor data that were measured as close to that event as available. We found that BMI, DBP, HbA1c, and SBP provided generally very close measures for each retinal assessment, probably due to their measure by diabetes specialists (Supplementary Table 13). However, measures of vascular risk such as total cholesterol, serum creatinine, HDL-c, triglycerides, and non-HDL-c were measured more distally to the retinal screening events (Supplementary Table 13).
In a univariate analyses, there was a significant effect on progression rates for age of diagnosis, age, cholesterol, DBP, HbA1c, SBP, triglycerides, and non-HDL-c, even after Bonferroni correction (threshold 0.0038) (Table 1). In contrast, there was no significant effect of BMI, serum creatinine, HDL-c, sex, or smoking status (Table 1 and Supplementary Table 14). We then examined the effects of the risk factors on the individual transitions between disease states. An increase in HbA1c level by 1 SD (15.83 mmol/mol, 1.4%) had a 42% increased risk of progression from no retinopathy state to mild BDR, a 32% increased risk of progression from mild BDR to observable BDR, and a 123% increased risk in progression from observable BDR to severe non-PDR/PDR (Table 2). Conversely, a reduction in the HbA1c level by 1 SD was associated with a 24% increased possibility of recovering from mild BDR to the retinopathy-free state (Table 2), but the HbA1c level was unrelated to the regression from observable BDR to mild BDR in this cohort. A raised level of DBP by 1 SD (10.41 mmHg) elevated the risk for developing observable BDR from the mild BDR by 87% (Table 2). SBP was also a significant risk factor for progression to mild BDR from the initial retinopathy-free state (Table 2), and the reduction in SBP by 1 SD (17.28 mmHg) was associated with a 20% increased chance of regression back to the retinopathy-free state (Table 2). The risk effect of cholesterol and non-HDL-c on the progression from mild BDR to observable BDR reached statistical significance in the univariate models (Table 2) but was insignificant after adjustment in the multivariate model (Table 2). In the multivariate analysis, at the 5% significance level, triglyceride values influenced the transition from the retinopathy-free state to mild BDR (Table 2), which, however was statistically insignificant in the univariate assessment (Table 2).
Table 1.
LR tests of single-covariable model against the two-way transition model (base model AIC 31,574.2)
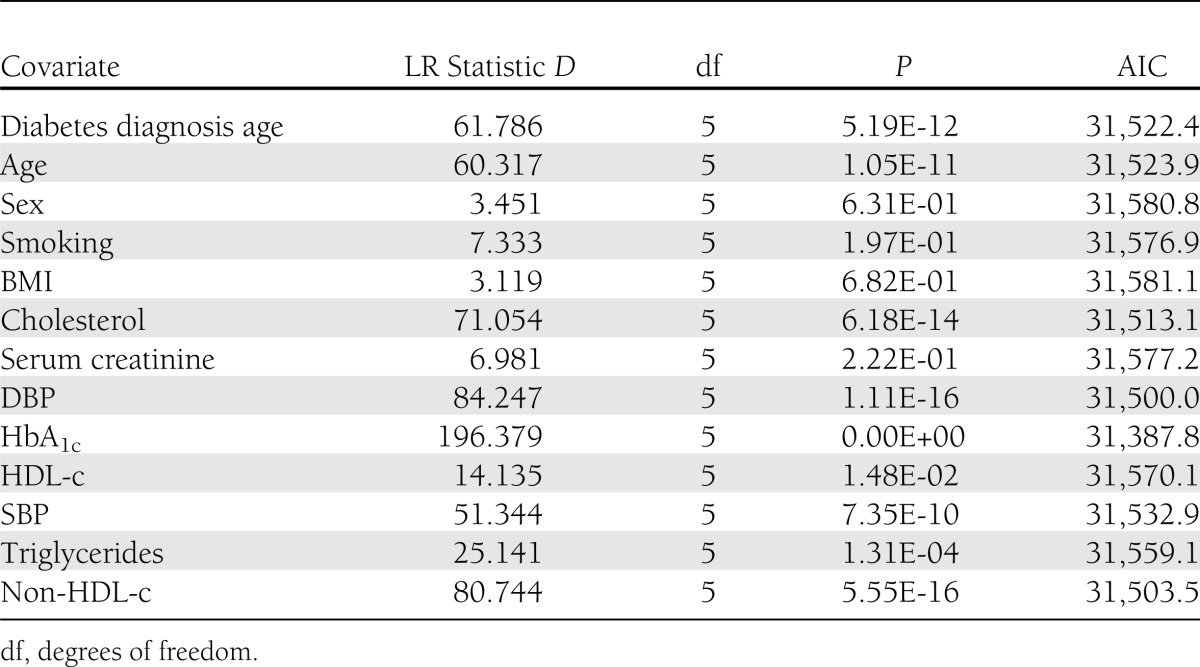
Table 2.
HR (95% CI) for DR progression (state 1–2, 2–3, and 3–4) and regression (state 2–1, 3–2)
CONCLUSIONS
Our analysis has demonstrated that in the development of DR, the initial, asymptomatic phase was stable, followed by transient mid-stages, and that substantial rates of disease regression could be observed. The risk of DR progression from the retinopathy-free state to mild BDR, from mild BDR to observable BDR, and from observable BDR to severe non-PDR/PDR was strongly positively associated with glycemic exposure. We also found a significant risk effect of DBP on the progression of mild BDR to observable BDR and of SBP on the state transition from the retinopathy-free state to mild BDR. There was no evidence in this study that the risk effects for DR state transitions were influenced by sex, smoking status, BMI, serum creatinine, or HDL-c. We did not find the evidence for independent risk effects of cholesterol, triglycerides, and non-HDL-c on DR state transitions with the adjustment for blood pressure and glycemic control. This study provides the first evidence showing that better HbA1c and SBP are strongly correlated with the regression from mild BDR back to the retinopathy-free state.
One of the strengths of this study is the 15-fold greater overall sample size compared with an earlier study on DR using an identical approach and a substantially extended follow-up time. A potential limitation in this longitudinal study of historical events remains the paucity of follow-up data on the study subjects that were recruited more recently. Also, halfway through, the follow-up screening was switched from Polaroid films to digital images, although a similar grading category was followed.
In this study, our data yielded an important novel estimation about the time spent in each state in this cohort. To date, most longitudinal studies on DR development have been directed at estimating incidence and/or progression rate in a study sample, and few have examined the average length of time spent in each stage of DR. In the late 1980s, the Wisconsin Epidemiologic Study of Diabetic Retinopathy (WESDR) reported that 0.4% of patients with diabetes diagnosed at ≥30 years of age and without retinopathy at the first retinal examination progressed to PDR within 4 years (21). The UK Prospective Diabetes Study (UKPDS) identified that 0.2% of 2,316 type 2 diabetic patients with no retinopathy at baseline required photocoagulation treatments at 3 years, 1.1% at 6 years, and 2.6% at 9 years (22,23). A recent study on 16,444 patients with type 2 diabetes without retinopathy at the first retinal examination found that the cumulative incidence of non-PDR, severe non-PDR, and PDR was 36, 4, and 0.68%, respectively, after 5 years follow-up, and after 10 years follow-up, these estimates rose to 66, 16, and 1.5%, respectively (24). These findings broadly support the estimated total length of time in the retinopathy-free state reported in this study.
Extensive evidence from published randomized clinical trials (25–27) and prospective (28–34) and retrospective (35) studies support our findings on HbA1c as an important risk factor for DR progression (Table 2). The Diabetes Control and Complications Trial (DCCT) (27) reported a hazard rate of 1.63 (P < 0.001) for the risk effect of 1 SD of HbA1c in type 1 diabetic patients. UKPDS (26) has found per 1-SD increase in the HbA1c variable a hazard rate of 1.48 (95% CI 1.40–1.61) and 1.96 (95% CI 1.79–2.16), respectively, for microvascular complications in patients with type 2 diabetes. These results broadly support the hazard ratios (HRs) we found in this study for HbA1c on DR. Additionally, we demonstrate that lower HbA1c is associated with regression of retinopathy from mild BDR to no DR. However, once a more severe retinopathy state, e.g., observable BDR is reached, the protective effect associated with lowering HbA1c is not observed, suggesting that good glycemic control only facilitates DR remission at an early stage.
Previous studies have shown mixed results on the association between blood pressure and DR. The UKPDS (23) demonstrated that the incidence of retinopathy was associated with SBP values in top versus bottom tertiles and that lowering blood pressure resulted in a marked reduction in development or progression of DR. In one of the WESDR reports (29), in which a prospective cohort of type 1 diabetic patients was followed up for 14 years, the baseline DBP variable was a significant predictor of progression to PDR. A study in the late-1980s (36) showed no association of SBP and DBP variables in the highest and lowest quartiles with the incidence or the progression of retinopathy in type 2 diabetic patients. In contrast, it was shown in the same study that in type 1 diabetic patients, SBP and DBP were correlated with the progression of retinopathy. Our study firmly supports a role for blood pressure in DR progression in individuals with type 2 diabetes.
In this study, we have applied an innovative approach for the analysis of population-based longitudinal retinopathy cohort data. Our findings delineated state-by-state transitions underlying DR development, and our assessment of population risk factors influencing progressive and regressive state transitions yielded the evidence for the role of blood pressure and glycemic control in DR development. Furthermore, the analytical approach used in this study holds the potential to be extended for investigating the additional independent effect from antidiabetes oral agents on the course of DR or the interaction between antidiabetes medications with HbA1c on the development of DR. These lines of interest on the front of pharmacoepidemiology may deserve a separate, thorough investigation, with additional input from population prescribing datasets. However, we have the confidence that the strategy we applied here will become the cornerstone for increasingly more clinical studies.
Acknowledgments
The Wellcome Trust provides support for Wellcome Trust United Kingdom Type 2 Diabetes Case Control Collection (GoDARTS), and informatics support is provided by the Chief Scientist Office. The Wellcome Trust funds the Scottish Health Informatics Programme. Y.L. is supported by the University of Dundee College of Medicine, Dentistry, and Nursing PhD studentship.
No potential conflicts of interest relevant to this article were reported.
Y.L. reviewed the literature, designed the study, collected and analyzed data, and wrote the manuscript. M.W. contributed to discussion on the study design. A.D.M., A.S.F.D., and G.P.L. reviewed and edited the manuscript. E.R.P. reviewed the literature, conceived the study idea, contributed to the study design, and reviewed and edited the manuscript. C.N.A.P. reviewed the literature, designed the study, and reviewed and edited the manuscript. C.N.A.P. is the guarantor of this work and, as such, had full access to all the data in the study and takes responsibility for the integrity of the data and the accuracy of the data analysis.
The authors thank all the participants in this study, the general practitioners, the Scottish School of Primary Care for their help in recruiting the participants, and the whole team, which includes interviewers, computer and laboratory technicians, clerical workers, research scientists, volunteers, managers, receptionists, and nurses. The authors acknowledge the support of the Health Informatics Centre, University of Dundee, for managing and supplying the anonymized data and NHS Tayside, the original data owner. The authors thank C.H. Jackson, Medical Research Council Biostatistics Unit, for discussions on the use of the “msm” package.
Footnotes
This article contains Supplementary Data online at http://care.diabetesjournals.org/lookup/suppl/doi:10.2337/dc12-2392/-/DC1.
References
- 1.Aiello LP, Gardner TW, King GL, et al. Diabetic retinopathy. Diabetes Care 1998;21:143–156 [DOI] [PubMed] [Google Scholar]
- 2.Klein R, Klein BE, Moss SE, Davis MD, DeMets DL. The Wisconsin epidemiologic study of diabetic retinopathy. III. Prevalence and risk of diabetic retinopathy when age at diagnosis is 30 or more years. Arch Ophthalmol 1984;102:527–532 [DOI] [PubMed] [Google Scholar]
- 3.Williams R, Airey M, Baxter H, Forrester J, Kennedy-Martin T, Girach A. Epidemiology of diabetic retinopathy and macular oedema: a systematic review. Eye (Lond) 2004;18:963–983 [DOI] [PubMed] [Google Scholar]
- 4.He BB, Wei L, Gu YJ, et al. Factors associated with diabetic retinopathy in Chinese patients with type 2 diabetes mellitus. Int J Endocrinol 2012;2012:157940 [DOI] [PMC free article] [PubMed]
- 5.Klein R, Klein BE, Moss SE, Davis MD, DeMets DL. Glycosylated hemoglobin predicts the incidence and progression of diabetic retinopathy. JAMA 1988;260:2864–2871 [PubMed] [Google Scholar]
- 6.Teuscher A, Schnell H, Wilson PW. Incidence of diabetic retinopathy and relationship to baseline plasma glucose and blood pressure. Diabetes Care 1988;11:246–251 [DOI] [PubMed] [Google Scholar]
- 7.Janka HU, Warram JH, Rand LI, Krolewski AS. Risk factors for progression of background retinopathy in long-standing IDDM. Diabetes 1989;38:460–464 [DOI] [PubMed] [Google Scholar]
- 8.Semeraro F, Parrinello G, Cancarini A, et al. Predicting the risk of diabetic retinopathy in type 2 diabetic patients. J Diabetes Complications 2011;25:292–297 [DOI] [PubMed] [Google Scholar]
- 9.Ahmed KR, Karim MN, Bhowmik B, Habib SH, Bukht MS, Ali L, Hussain A. Incidence of diabetic retinopathy in Bangladesh: a 15-year follow-up study. J Diabetes 2012;4:386–391 [DOI] [PubMed]
- 10.Marshall G, Jones RH. Multi-state models and diabetic retinopathy. Stat Med 1995;14:1975–1983 [DOI] [PubMed] [Google Scholar]
- 11.Jackson CH, Sharples LD, Thompson SG, Duffy SW, Couto E. Multistate Markov models for disease progression with classification error. J ROY STAT SOC D-STA 2003;52:193–209 [Google Scholar]
- 12.Kay R. A Markov model for analysing cancer markers and disease states in survival studies. Biometrics 1986;42:855–865 [PubMed] [Google Scholar]
- 13.Andersen PK. Multistate models in survival analysis: a study of nephropathy and mortality in diabetes. Stat Med 1988;7:661–670 [DOI] [PubMed] [Google Scholar]
- 14.Duffy SW, Chen HH, Tabar L, Day NE. Estimation of mean sojourn time in breast cancer screening using a Markov chain model of both entry to and exit from the preclinical detectable phase. Stat Med 1995;14:1531–1543 [DOI] [PubMed] [Google Scholar]
- 15.Andersen PK, Hansen LS, Keiding N. Assessing the influence of reversible disease indicators on survival. Stat Med 1991;10:1061–1067 [DOI] [PubMed] [Google Scholar]
- 16.Leese GP, Morris AD, Swaminathan K, et al. Implementation of national diabetes retinal screening programme is associated with a lower proportion of patients referred to ophthalmology. Diabet Med 2005;22:1112–1115 [DOI] [PubMed] [Google Scholar]
- 17.Olson JA, Strachan FM, Hipwell JH, et al. A comparative evaluation of digital imaging, retinal photography and optometrist examination in screening for diabetic retinopathy. Diabet Med 2003;20:528–534 [DOI] [PubMed] [Google Scholar]
- 18.Murgatroyd H, Ellingford A, Cox A, et al. Effect of mydriasis and different field strategies on digital image screening of diabetic eye disease. Br J Ophthalmol 2004;88:920–924 [DOI] [PMC free article] [PubMed] [Google Scholar]
- 19.Scotland NHS. National diabetes retinal screening [Internet]. Available from http://www.ndrs.scot.nhs.uk/ Accessed 5 November 2012
- 20.Morris AD, Boyle DIR, MacAlpine R, et al. DARTS/MEMO Collaboration The diabetes audit and research in Tayside Scotland (DARTS) study: electronic record linkage to create a diabetes register. BMJ 1997;315:524–528 [DOI] [PMC free article] [PubMed] [Google Scholar]
- 21.Klein R, Klein BE, Moss SE, Davis MD, DeMets DL. The Wisconsin Epidemiologic Study of Diabetic Retinopathy. X. Four-year incidence and progression of diabetic retinopathy when age at diagnosis is 30 years or more. Arch Ophthalmol 1989;107:244–249 [DOI] [PubMed] [Google Scholar]
- 22.Kohner EM, Stratton IM, Aldington SJ, Holman RR, Matthews DR, UK Prospective Diabetes Study (IKPDS) Group Relationship between the severity of retinopathy and progression to photocoagulation in patients with Type 2 diabetes mellitus in the UKPDS (UKPDS 52). Diabet Med 2001;18:178–184 [DOI] [PubMed] [Google Scholar]
- 23.Stratton IM, Kohner EM, Aldington SJ, et al. UKPDS 50: risk factors for incidence and progression of retinopathy in Type II diabetes over 6 years from diagnosis. Diabetologia 2001;44:156–163 [DOI] [PubMed] [Google Scholar]
- 24.Jones CD, Greenwood RH, Misra A, Bachmann MO. Incidence and progression of diabetic retinopathy during 17 years of a population-based screening program in England. Diabetes Care 2012;35:592–596 [DOI] [PMC free article] [PubMed] [Google Scholar]
- 25.Warram JH, Scott LJ, Hanna LS, et al. Progression of microalbuminuria to proteinuria in type 1 diabetes: nonlinear relationship with hyperglycemia. Diabetes 2000;49:94–100 [DOI] [PubMed] [Google Scholar]
- 26.Stratton IM, Adler AI, Neil HAW, et al. Association of glycaemia with macrovascular and microvascular complications of type 2 diabetes (UKPDS 35): prospective observational study. BMJ 2000;321:405–412 [DOI] [PMC free article] [PubMed] [Google Scholar]
- 27.DCCT The relationship of glycemic exposure (HbA1c) to the risk of development and progression of retinopathy in the diabetes control and complications trial. Diabetes 1995;44:968–983 [PubMed] [Google Scholar]
- 28.Gerstein HC, Pogue J, Mann JFE, et al. HOPE investigators The relationship between dysglycaemia and cardiovascular and renal risk in diabetic and non-diabetic participants in the HOPE study: a prospective epidemiological analysis. Diabetologia 2005;48:1749–1755 [DOI] [PubMed] [Google Scholar]
- 29.Klein R, Klein BEK, Moss SE, Cruickshanks KJ. The Wisconsin Epidemiologic Study of Diabetic Retinopathy: XVII. The 14-year incidence and progression of diabetic retinopathy and associated risk factors in type 1 diabetes. Ophthalmology 1998;105:1801–1815 [DOI] [PubMed] [Google Scholar]
- 30.Klein R, Klein BEK, Moss SE. Relation of glycemic control to diabetic microvascular complications in diabetes mellitus. Ann Intern Med 1996;124:90–96 [DOI] [PubMed] [Google Scholar]
- 31.Klein R, Klein BEK, Moss SE, Cruickshanks KJ. Relationship of hyperglycemia to the long-term incidence and progression of diabetic retinopathy. Arch Intern Med 1994;154:2169–2178 [PubMed] [Google Scholar]
- 32.Florkowski CM, Scott RS, Coope PA, Graham PJ, Moir CL. Age at diagnosis, glycaemic control and the development of retinopathy in a population-based cohort of Type 1 diabetic subjects in Canterbury, New Zealand. Diabetes Res Clin Pract 2001;52:125–131 [DOI] [PubMed] [Google Scholar]
- 33.Yoshida Y, Hagura R, Hara Y, Sugasawa G, Akanuma Y. Risk factors for the development of diabetic retinopathy in Japanese type 2 diabetic patients. Diabetes Res Clin Pract 2001;51:195–203 [DOI] [PubMed] [Google Scholar]
- 34.Nakagami T, Kawahara R, Hori S, Omori Y. Glycemic control and prevention of retinopathy in Japanese NIDDM patients. A 10-year follow-up study. Diabetes Care 1997;20:621–622 [DOI] [PubMed] [Google Scholar]
- 35.Arun CS, Pandit R, Taylor R. Long-term progression of retinopathy after initiation of insulin therapy in Type 2 diabetes: an observational study. Diabetologia 2004;47:1380–1384 [DOI] [PubMed] [Google Scholar]
- 36.Klein R, Klein BEK, Moss SE, Davis MD, DeMets DL. Is blood pressure a predictor of the incidence or progression of diabetic retinopathy? Arch Intern Med 1989;149:2427–2432 [PubMed] [Google Scholar]