

Abstract
OBJECTIVE
Type 2 diabetes (T2DM) is associated with brain atrophy and cerebrovascular disease. We aimed to define the regional distribution of brain atrophy in T2DM and to examine whether atrophy or cerebrovascular lesions are feasible links between T2DM and cognitive function.
RESEARCH DESIGN AND METHODS
This cross-sectional study used magnetic resonance imaging (MRI) scans and cognitive tests in 350 participants with T2DM and 363 participants without T2DM. With voxel-based morphometry, we studied the regional distribution of atrophy in T2DM. We measured cerebrovascular lesions (infarcts, microbleeds, and white matter hyperintensity [WMH] volume) and atrophy (gray matter, white matter, and hippocampal volumes) while blinded to T2DM status. With use of multivariable regression, we examined for mediation or effect modification of the association between T2DM and cognitive measures by MRI measures.
RESULTS
T2DM was associated with more cerebral infarcts and lower total gray, white, and hippocampal volumes (all P < 0.05) but not with microbleeds or WMH. T2DM-related gray matter loss was distributed mainly in medial temporal, anterior cingulate, and medial frontal lobes, and white matter loss was distributed in frontal and temporal regions. T2DM was associated with poorer visuospatial construction, planning, visual memory, and speed (P ≤ 0.05) independent of age, sex, education, and vascular risk factors. The strength of these associations was attenuated by almost one-half when adjusted for hippocampal and total gray volumes but was unchanged by adjustment for cerebrovascular lesions or white matter volume.
CONCLUSIONS
Cortical atrophy in T2DM resembles patterns seen in preclinical Alzheimer disease. Neurodegeneration rather than cerebrovascular lesions may play a key role in T2DM-related cognitive impairment.
Type 2 diabetes (T2DM) is associated with an increased risk of incident cognitive impairment, dementia, and Alzheimer disease as a possible result of cerebrovascular and/or neurodegenerative disease (1–3). T2DM is associated with brain infarcts (4,5) on magnetic resonance imaging (MRI) and less consistently with cerebral white matter hyperintensities (WMHs) (6,7) and cerebral microbleeds (8,9). Lower hippocampal volume (10–12) and total brain volume (13), which are features of Alzheimer disease, are also more likely to occur in T2DM. However, few studies have clarified the regional distribution of brain atrophy attributable to T2DM (14–16). These studies were small, and only one compared people with and without T2DM, with the results suggesting that temporal lobe gray matter may be affected in T2DM (15). Understanding the pattern of brain atrophy in T2DM may provide clues toward the underlying neurodegenerative process. For example, gray matter atrophy occurs early in the temporal, parietal, and limbic cortices before spreading to involve frontal and occipital regions in Alzheimer disease (17). Moreover, although some studies demonstrated associations of T2DM with brain atrophy or cerebrovascular disease, no data describe how MRI measures of atrophy and cerebrovascular disease mediate the difference in cognitive function between those with and without T2DM. Manschot et al. (18) found an association between T2DM and more deep white matter lesions, cortical and subcortical atrophy, and infarcts as well as impaired cognitive performance. In subgroup analysis of only those with T2DM, they found that cognitive performance was inversely associated with deep white matter lesion volume, atrophy, and infarcts. In the current study, we examined the distribution of brain atrophy in older people with T2DM, predicting that MRI measures of brain atrophy and cerebrovascular disease would mediate or modify the association between T2DM and cognitive function.
RESEARCH DESIGN AND METHODS
Sampling
We used a cross-sectional study design, recruiting participants ≥55 years of age with T2DM who lived in Southern Tasmania and who were enrolled in the Cognition and Diabetes in Older Tasmanians (CDOT) study between January 2008 and January 2010. We used the National Diabetes Service Scheme (NDSS) as a sampling frame. Diabetes Australia administers the NDSS, providing products, information, and support to people with diabetes who voluntarily enroll. The diagnosis of T2DM in the NDSS is based on careful physician assessment by standard criteria (fasting plasma glucose ≥7.0 mmol/L, random plasma glucose ≥11.1 mmol/L, or 2-h glucose ≥11.1 mmol/L after oral glucose tolerance test). Registrants indicated a willingness to participate in research. Approach letters were sent to all eligible people aged ≥55 years living in the postcodes 7000–7199. Exclusion criteria were people living in nursing homes, signifying severe frailty; those with insufficient English for cognitive testing; and contraindication to MRI. We derived the comparison group from a sample of people aged ≥60 years without T2DM who were recruited into the population-based Tasmanian Study of Cognition and Gait (TASCOG), which has been described previously (19). Approach letters were sent to residents randomly identified from the electoral roll who lived in the same postcodes as those in the CDOT study. Exclusion criteria were identical to the CDOT study. Absence of T2DM in the comparison group was defined as a fasting plasma glucose <7.0 mmol/L, random plasma glucose <11.1 mmol/L, and HbA1c <6.5% (48 mmol/mol) in those without a history of T2DM. We calculated that 300 participants were needed in each group to detect a partial R2 in the range of 2% (no covariates) to 3% (10 covariates). The Southern Tasmanian Health and Medical Human Research Ethics Committee and the Monash University Human Research Ethics Committee approved the study, and written informed consent was obtained.
Outcome measurements
MRI scans.
MRI scans were obtained with a single 1.5-T General Electric scanner with the following sequences: high-resolution T1-weighted spoiled gradient echo (GRE) (repetition time [TR] 35 ms, echo time [TE] 7 ms, flip angle 35°, field of view 24 cm, 120 contiguous slices, isotropic voxel size 1 mm3), T2-weighted fast spin echo (TR 4,300 ms, TE 120 ms, number of excitations 1, turbo factor 48, voxel size 0.90 × 0.90 × 3 mm); fluid attenuated inversion recovery (FLAIR) (TR 8,802 ms, TE 130 ms, inversion time 2,200 ms, voxel size 0.50 × 0.50 × 3 mm); GRE (TR 0.8 ms, TE 0.015, flip angle 30°, voxel size 0.9 × 0.9 × 7 mm).
Cerebrovascular lesions.
Fully automated WMH segmentation was performed on FLAIR sequences using a validated method (20), and WMH volume was computed by a voxel counting algorithm. A single trained rater (C.M.) determined the presence of MRI infarct and microbleed with confirmation by consensus between two stroke experts (T.P., V.S.). Infarct was defined as a hypointensity ≥3 mm in diameter on three-dimensional T1-weighted and FLAIR images with a surrounding hyperintense rim on FLAIR (21). Microbleeds were defined as small, rounded, hypointense lesions with clear margins, ranging from 2 to 10 mm on GRE sequences. All measurements were done while blinded to group, age, sex, and outcome measures.
Brain atrophy.
Three-dimensional T1 and GRE sequences were registered in the standard Montreal Neurological Institute space using the Functional MRI of the Brain Linear Image Registration Tool (22). This process has the effect of normalizing the brain according to a standard template to take account of variation in brain size. A multispectral segmentation process was applied with the use of three-dimensional T1 and GRE sequences, and Statistical Parametric Mapping version 5 software (23) was used to produce tissue probability maps of gray and white matter. The images were modulated to correct for volume change induced by the normalization process. We also created maps of white matter unaffected by WMH by marking locations corresponding to WMH as empty in the tissue probability maps. Tissue maps were smoothed with an isotropic Gaussian kernel (full width at half maximum 8 mm) before voxel-based morphometric (VBM) analysis. With these tissue probability maps, we used a voxel counting algorithm to calculate gray, white, and WMH volumes. A single expert manually segmented both hippocampi by established methods known to have high test–retest reliability in our laboratory (intraclass correlation coefficient 0.97) (24). Tissue volumes of the segmented areas (total gray, normal-appearing white matter, and hippocampal) were calculated with voxel counting algorithms.
Cognitive testing.
A standardized test battery was applied, which included the digit span, digit symbol coding, and symbol search subtests of the Wechsler Adult Intelligence Scale–Third Edition (25); the Hopkins Delayed Verbal Recall (26); the Controlled Oral Word Association Test (COWAT) (letter and animal categories) (26); the Victoria Stroop test (dot, color, and word) (26); and the Rey-Osterrieth Complex Figure (RCFT) copy and delayed recall tests (Supplementary Table 1) (26).
Other measurements.
Fasting plasma glucose was recorded by a Roche cobas 6000 analyzer with hexokinase and HbA1c determined with a Bio-Rad D-10 analyzer. We used standardized questionnaires to record demographic and clinical information about duration of T2DM; years of formal education; health and medical history, including vascular disease and risk factors; ever smoked; medication use; and alcohol use (grams per day). We measured weight, height, and waist and hip circumferences and calculated the BMI as weight in kilograms divided by height in meters squared. Habitual physical activity was calculated from the mean number of steps per day measured with a Yamax pedometer worn over a 7-day period. Mood was determined with the 15-item Geriatric Depression Scale (GDS) (27). Blood pressure (BP) measured with an Omron M4 sphygmomanometer while sitting was the average of three recordings from the right arm.
Data analysis
Student t and χ2 tests were applied to compare mean scores and proportions of demographic, clinical, and cognitive variables between the T2DM and unaffected groups.
Voxel-based morphometry.
VBM allows for unbiased, voxelwise comparison of local tissue volumes between groups. To identify the regions of brain atrophy attributable to T2DM, we used linear regression modeling to generate maps of gray and white matter atrophy associated with T2DM, including age, sex, education, and total intracranial volume as covariates, and a stringent false discovery rate (P < 0.001) to correct for multiple comparisons. Clusters of >100 statistically significant voxels were considered important and placed on a standard brain image to aid visualization. We used the Talairach atlas (28) to identify the anatomical locations of these clusters.
Multivariable regression.
We studied the associations of T2DM with individual MRI measures, adjusting each regression for age, sex, and total intracranial volume. We used linear regression for continuous variables (total gray, total white, total WMH, and right and left hippocampal volumes) and logistic regression for infarcts and microbleeds (presence vs. absence). Similarly, we performed linear regressions of T2DM against cognitive scores, adjusting for age, sex, education, and mood. For all these analyses, potential for confounding was examined for additional covariates and adjustments made if the addition of these terms changed the coefficient for T2DM by >10%. Covariates considered were hypertension (defined as mean BP >140/90 mmHg or previous diagnosis), hyperlipidemia (yes/no), alcohol use (grams per day), ever smoked (yes/no), mean steps per day, ischemic heart disease, stroke (except in the analysis of brain infarcts), psychoactive medication use, BMI, and waist–hip ratio.
To examine whether MRI measures mediated the associations detected between T2DM and cognition, we successively entered terms for MRI measures (total gray matter, total white matter, total WMH, right and left hippocampal volumes, cerebral infarcts, and cerebral microbleeds) into the models relating T2DM to relevant cognitive scores, adjusting for age, sex, and total intracranial volume. If the MRI measure introduced substantially attenuated the β coefficient for T2DM (>30%) and the coefficient of the MRI measure remained unchanged from its unadjusted value without T2DM in the model, it was considered a potential mediator. We also examined for two-way interactions between T2DM and MRI variables with a test of significance of product terms. We applied standard regression diagnostics to assess the adequacy of models. Statistical analyses were carried out with STATA 11.1 (StataCorp, College Station, TX) software.
RESULTS
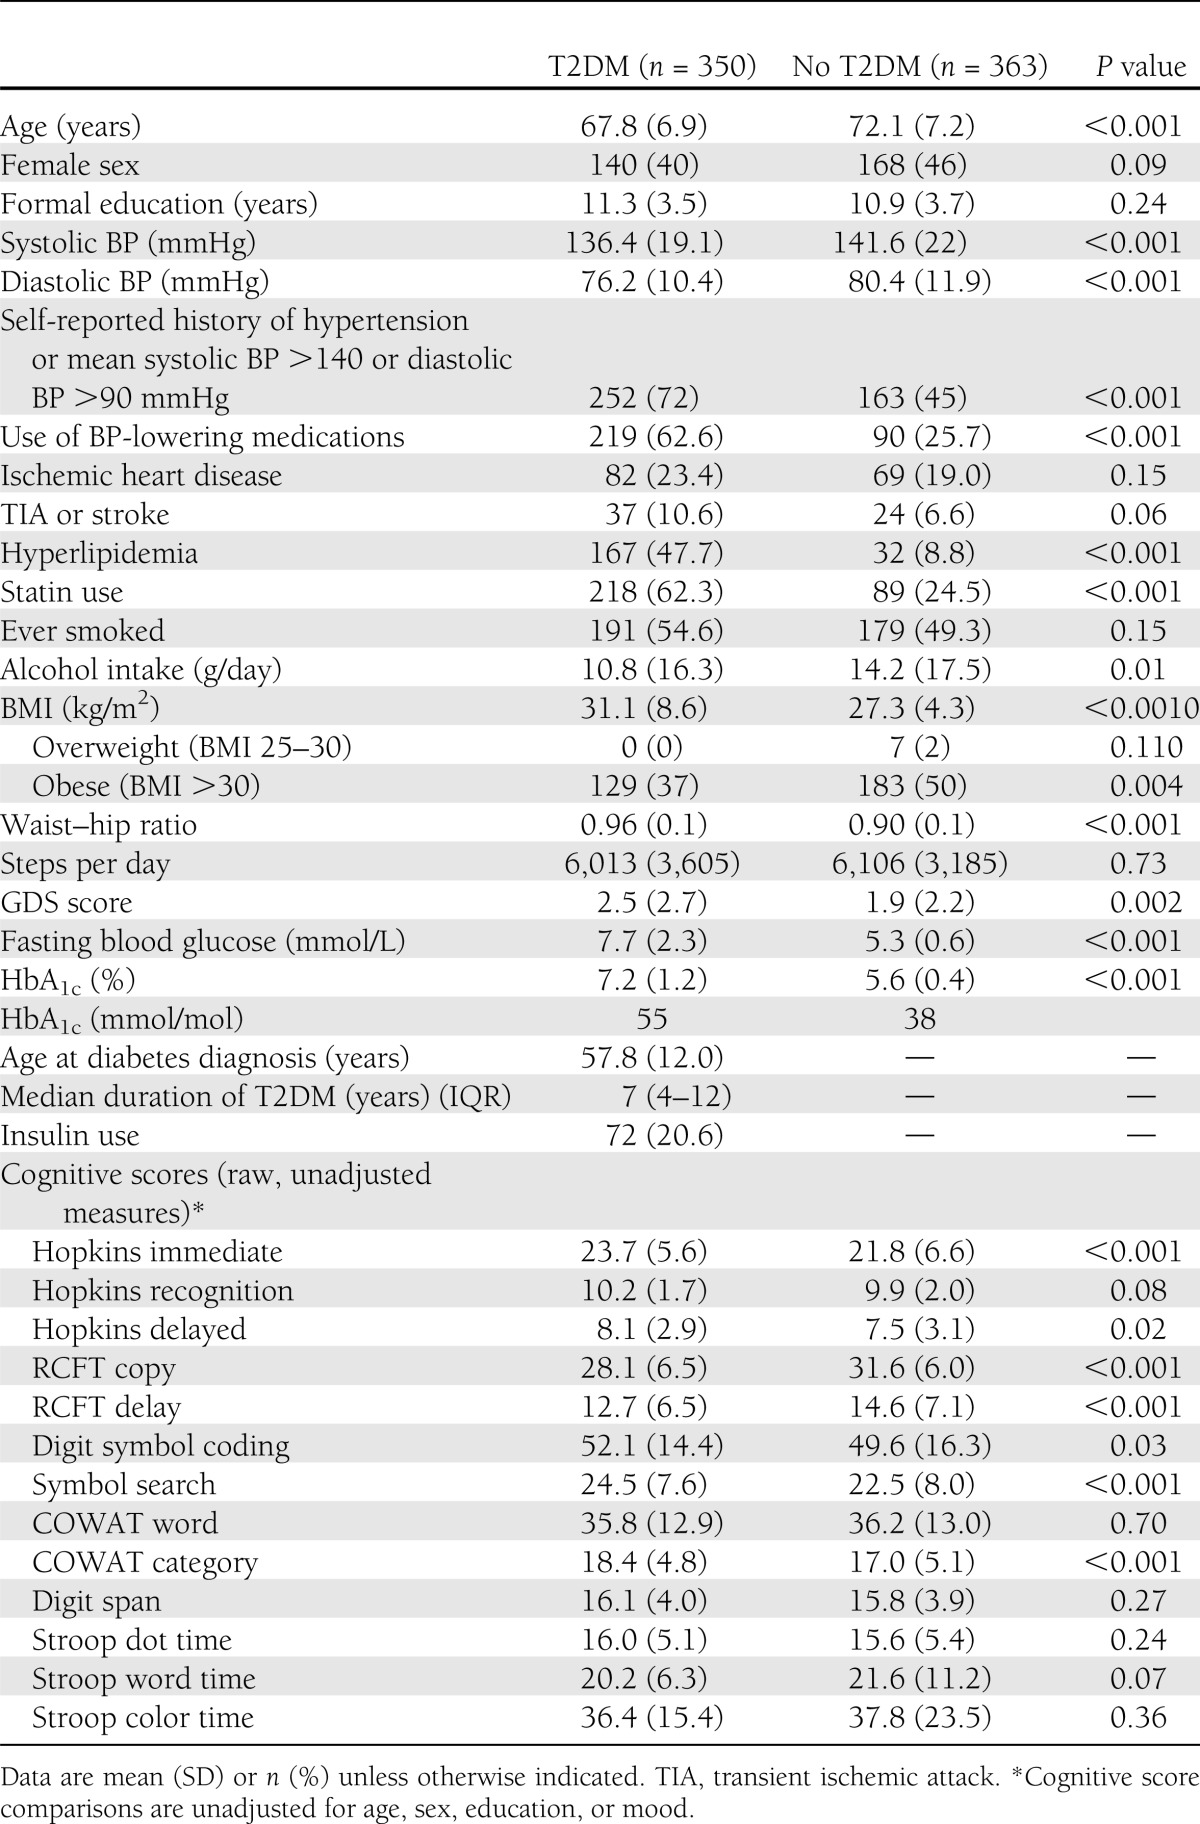
There were 350 people in the T2DM group (mean age 67.8 [SD 6.9] years) and 363 in the non-T2DM comparison group (mean age 72.1 [7.2] years). Group characteristics and comparisons are presented in Table 1. Participants with T2DM reported a median disease duration of 7 years (interquartile range 4–12 years). T2DM participants had greater fasting blood glucose levels and HbA1c values, higher BMI and waist–hip ratio, and greater GDS scores and were more likely to report a history of hypertension and hyperlipidemia, treatment with antihypertensive drugs and statins, and lower daily alcohol consumption.
Table 1.
Sample characteristics
T2DM and MRI measures
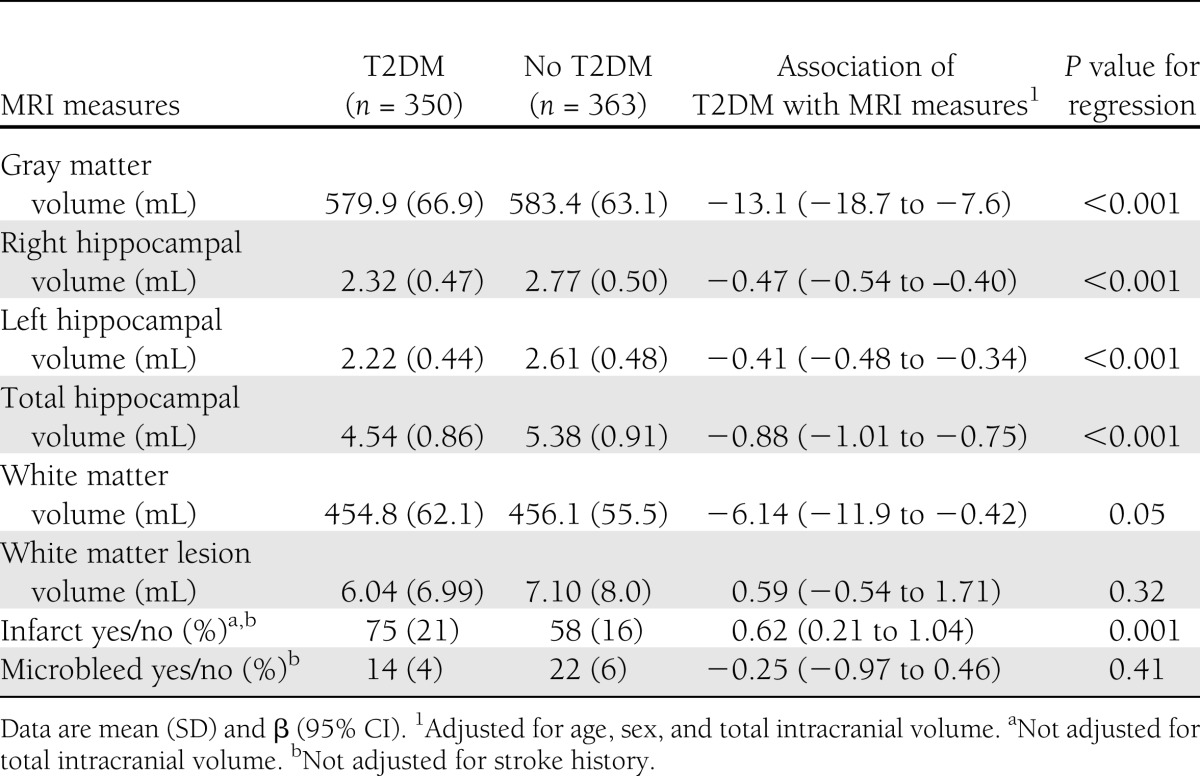
Unadjusted and adjusted comparisons of the MRI measures between groups are presented in Table 2. After adjusting for age, sex, and total intracranial volume, T2DM was associated with lower total gray, white, and hippocampal volumes (P < 0.001) and the presence of infarct (P < 0.001) but not with WMH volume or microbleeds. Restricting the analyses for only the highest quartiles of WMH volume did not alter the findings. Adjustment for other vascular risk factors did not appreciably attenuate the association of T2DM with the MRI measures (data not shown).
Table 2.
Associations between T2DM and MRI measures
Results of VBM analysis of gray matter volume loss attributable to T2DM are shown in Fig. 1, and the anatomical regions of gray matter volume loss are listed in Supplementary Table 2. T2DM was associated with loss of cortical gray matter mainly in temporal, parahippocampal, cingulate, precuneus, insula, and medial frontal regions and with loss of subcortical gray matter in the caudate nucleus and putamen. The left hemisphere demonstrated more cortical gray matter loss than the right. T2DM was associated with white matter loss, mainly in frontal and temporal white matter (Supplementary Table 3). These associations were largely unchanged when further adjusted for gray matter volume.
Figure 1.

Probability map of location of gray matter atrophy attributable to T2DM. VBM was used to create a probability map of areas of gray matter atrophy attributable to T2DM when adjusted for age, sex, education, and total intracranial volume. Voxels highlighted are those areas most likely to have gray matter atrophy attributable to T2DM, with a false discovery rate P < 0.001 (orange) to P < 0.0001 (yellow). These areas are detailed in Supplementary Table 2. A: Inferior region. B: Temporal region. C: Medial region. D: Superior region.
T2DM and cognition
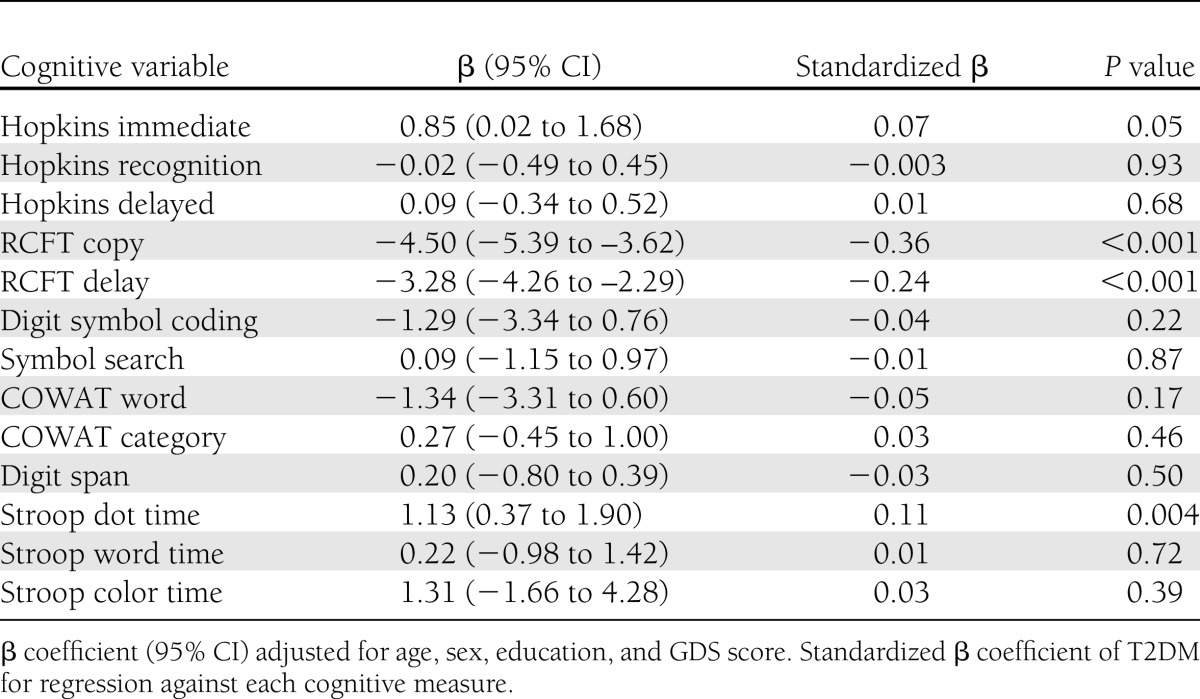
T2DM was independently associated with worse scores in RCFT copy (P < 0.001) and delayed recall (P < 0.001) and with a longer time to complete the Stroop dot test (P = 0.004) (Table 3). A longer duration of T2DM (≥15 years [n = 157]) was associated with poorer scores in RCFT copy (P = 0.03), digit symbol coding (P = 0.001), and symbol search (P = 0.001) than was <15 years disease duration (n = 183). Although there was a trend for poorer performance in other cognitive tests with longer duration of T2DM, these associations were not significant.
Table 3.
Associations between T2DM and cognitive measures
T2DM, MRI measures, and cognition
Supplementary Table 4 shows the magnitude of change in the β coefficients for T2DM against the cognitive scores caused by the stepwise addition of relevant MRI variables, wherein all models were adjusted for age, sex, education, mood, and total intracranial volume. The addition of total gray matter volume (including hippocampal volume) substantially attenuated the β coefficients of T2DM in RCFT copy (by 36.2%), RCFT delayed recall (by 54.9%), and Stroop dot (by 71.7%) scores. However, only very small additional changes in these coefficients were observed with the inclusion of terms for WMH volume (≤9.4%), white matter volume (≤1%), or infarcts (≤17.2%). We did not find biologically meaningful interactions between T2DM and MRI measures to explain cognitive performance.
CONCLUSIONS
This study provides novel voxel-based data from a large sample on the regional distribution of brain atrophy in older people with T2DM. In addition to the previously established association with hippocampal atrophy, T2DM was associated with temporal, frontal, and limbic gray matter atrophy and to a lesser extent with frontal and temporal white matter atrophy. To our knowledge, this study is the first to demonstrate that brain atrophy rather than cerebrovascular lesions may substantially mediate the relationship between T2DM and cognitive impairment, emphasizing the need to explore its underlying biological mechanisms.
Strengths of the study are the large sample size; careful definition of T2DM, the use of comprehensive MRI measures, fully automated brain segmentation, lesion detection while blinded to group status, a voxel-based whole-brain approach to study distribution of atrophy, and careful regression modeling to examine for mediation and effect modification. The study also has certain limitations. The cross-sectional design limits inference regarding causality, but the findings provide a strong basis for studying the global and regional effects of T2DM on brain atrophy longitudinally. Because we recruited T2DM participants from those indicating willingness to participate in research through their NDSS membership, participants at the healthier end of the spectrum of T2DM may have been overrepresented in the sample, explaining why cognitive differences were not more widespread. However, strong and consistent differences were found in more-sensitive brain MRI measures, suggesting that we may have captured people at an early stage of brain disease commensurate with less advanced T2DM. T2DM may be associated with changes in visual acuity, which may affect performance in visual cognitive tasks. However, if this were the case, we should expect that performance in all visual cognitive tasks would be confounded by vision. This is unlikely to be the case given that no association was found between those with T2DM and other complex visual attention/scanning tasks, such as digit symbol search, symbol coding, and Stroop word/color. In addition, we ensured that visual aids were used if required. Furthermore, visual acuity is unlikely to invalidate the mediation of cognitive differences by gray matter volume and hippocampal volume. Although we carefully adjusted for several important confounders, we cannot exclude the small possibility of residual confounding. Of note, the comparison sample was drawn from the same source population as those with T2DM, adding confidence to the observed results.
Until now, the distribution of brain atrophy in T2DM has been poorly defined. Results of few previous studies showed that T2DM is associated with total gray matter (16,29,30) and hippocampal volume loss (10–12). To our knowledge, only three were designed to examine regional gray matter loss associated with T2DM (14–16). A region of interest approach showed that gray matter volume is lower in the hippocampus in middle-aged people with T2DM (age range 60–64 years) (16). A study comparing 56 patients (mean age 68.1 years) with 30 control subjects found T2DM to be associated with lower cortical thickness in the middle temporal gyri (14). In the only published VBM study (n = 16 per group, mean age 61.2), T2DM was found to be associated with gray matter atrophy in the right temporal and precentral gyri (15). The present study, with the advantage of being much larger and having a substantial comparison group, demonstrates that T2DM is associated with gray matter in several bilateral regions of temporal, cingulate, and medial frontal cortices, with peak associations tending to be seen more in the left hemisphere. A notable parallel is that a similar distribution of cortical atrophy was described in early Alzheimer disease in neuropathological studies (31) and a longitudinal MRI study (17), where gray matter loss began in the temporal, entorhinal, and parietal lobes before progressing to orbitofrontal regions and more so in the left hemisphere. Increased insulin resistance has also been found to be associated with gray matter atrophy in a distribution similar to that found in Alzheimer disease (32). Although the study was not powered to assess the role of T2DM, the results suggested that glucose dysregulation may contribute to the pathophysiology of Alzheimer disease (32). The present results regarding white matter loss adds to findings of a single previous study (15) in which T2DM was found to be associated with temporal white matter volume loss. Although gray matter loss may lead to downstream white matter atrophy, the regional associations of white matter loss with T2DM were unchanged by the addition of gray matter volume in the model, suggesting a primary effect of T2DM on white matter. The association between T2DM and cerebral infarcts is well recognized (4,5) and likely to result from the proinflammatory vascular effects of T2DM as well as from other commonly coexistent risk factors, such as hypertension, smoking, and ischemic heart disease. We found no association between T2DM and WMH or microbleeds, which agrees with some studies in the field (16) but is inconsistent with others (8,29,33). It is possible that we may observe associations with these measures with longitudinal follow-up and accrual of more lesions. We were unable to estimate the association of T2DM with cerebral microvasculature, which is difficult to measure with current MRI techniques. Effects on blood-brain barrier integrity, neurovascular coupling, and cerebral microinfarcts are best estimated in basic models or pathological studies.
This study is the first in our knowledge to directly examine the mediating effect of MRI measures on the difference in cognitive performance between people with and without T2DM. Previous analyses were limited to within-T2DM groups alone (30,34). In one study, baseline total brain volume was correlated with a decline in the immediate Picture Learning Test (r = −0.292, P = 0.01) (30), and in another (34), periventricular WMH volume was associated with poor motor speed (β = −0.269, P = 0.04). In contrast, we were able to examine the mediation of the T2DM–cognition relationship by MRI measures in a large comparison group. In the present sample, T2DM was clearly associated with poorer function in visual construction, planning, visual memory, and cognitive speed. Although infarcts and WMH were by themselves associated with poorer cognition (data not shown), the findings suggest that the predominant pathway linking T2DM and cognition (at least early in the course of disease) is brain atrophy. We also explored whether the presence of cerebrovascular lesions rendered the brain more susceptible to the effects of T2DM-related atrophy on cognitive function but were unable to demonstrate such an interaction. However, the study may have been underpowered to detect very small interactions, which may become apparent with a longer duration of T2DM and a greater load of cerebrovascular lesions, best demonstrable in longitudinal cohorts. Moreover, current modalities of brain imaging are not sensitive measures of blood-brain barrier integrity or microinfarcts, and thus, we cannot exclude a mediating role for microvascular disease.
The mechanisms underlying brain atrophy in T2DM may include endocrine, metabolic, and vascular pathways (35). T2DM is characterized by impaired glucose control and insulin resistance. Chronic hyperglycemia increases the formation of advanced glycation end products, which promote oxidative stress, cross-linking of amyloid fibrils, modification of cytoskeletal tau proteins, and inflammation (36). Insulin plays a major role in modulating cerebral glucose metabolism, and insulin receptors are selectively distributed in the hippocampus and cerebral cortex (37). Reduced insulin transport across the blood-brain barrier and cerebral insulin resistance in areas of high receptor concentrations may impair regional glucose metabolism (37) and contribute to preferential atrophy in these areas. Insulin and insulin-degrading enzyme also modulate intracellular β-amyloid release and extracellular clearance, potentially contributing to an Alzheimer-like neurodegeneration (32,38). Inflammatory cytokines associated with T2DM may also contribute, with interleukin-6, C-reactive protein, and homocysteine having been shown to be associated with cerebral atrophy (39). In addition, microvascular disease related to T2DM may be a cause of neuronal apoptosis and brain atrophy through impaired blood flow to the neurovascular unit.
In summary, gray matter atrophy associated with T2DM is widely and bilaterally distributed in hippocampi, temporal, frontal, and cingulate cortices and subcortical nuclei. It appears to be the primary driver of cognitive dysfunction in people with T2DM.
Acknowledgments
This study was funded by the National Health and Medical Research Council (NHMRC) (project grants 403000 and 436797), Australia. C.M. is a recipient of an Alzheimer’s Australia Dementia Research Foundation Scholarship and a Clinical Academic Training Fellowship from Southern Health. T.G.P., R.B., G.M., and S.P. are recipients of NHMRC project grants. L.B. is supported by an NHMRC Career Development Fellowship and is a recipient of NHMRC project grants. A.V. and J.F. are recipients of an NHMRC fellowship and NHMRC project grants. V.S. is a recipient of a National Heart Foundation/NHMRC Career Development Fellowship (606544) and NHMRC project grants (403000 and 436797). Participants were recruited via the National Diabetes Service Scheme (NDSS), an initiative of the Australian Government administered by Diabetes Australia.
T.M.G. has received research funding from Novo Nordisk; lecture fees from Novartis, Amgen, Novo Nordisk, Merck, and Boehringer Ingelheim; and conference support from Novo Nordisk. No other potential conflicts of interest relevant to this article were reported.
C.M. contributed to the statistical analysis and data analysis and interpretation and drafted the manuscript. T.G.P. and J.C. contributed to the image analysis, data interpretation, and revision of the manuscript. L.B. contributed to the study concept and design, supervision of the statistical analysis, and revision of the manuscript. R.B. contributed to the development and supervision of the image analysis and revision of the manuscript. A.V., A.G.W., and J.F. contributed to the study design, data interpretation, and revision of the manuscript. G.M. contributed to the study concept, data interpretation, and revision of the manuscript. T.M.G. and S.P. contributed to the study design and revision of the manuscript. V.S. contributed to the study concept, design, and supervision; analyses; data interpretation; and revision of the manuscript and obtained the funding. V.S. is the guarantor of this work and, as such, had full access to all the data in the study and takes responsibility for the integrity of the data and the accuracy of the data analysis.
Parts of this study were presented in abstract form at the 73rd Scientific Sessions of the American Diabetes Association, Chicago, Illinois, 21–25 June 2013.
Footnotes
This article contains Supplementary Data online at http://care.diabetesjournals.org/lookup/suppl/doi:10.2337/dc13-0143/-/DC1.
See accompanying commentary, p. 3855.
A slide set summarizing this article is available online.
C.M., L.B., and V.S. contributed equally to the statistical analysis.
References
- 1.Ott A, Stolk RP, van Harskamp F, Pols HA, Hofman A, Breteler MM. Diabetes mellitus and the risk of dementia: the Rotterdam Study. Neurology 1999;53:1937–1942 [DOI] [PubMed] [Google Scholar]
- 2.Peila R, Rodriguez BL, Launer LJ, Honolulu-Asia Aging Study Type 2 diabetes, APOE gene, and the risk for dementia and related pathologies: the Honolulu-Asia Aging Study. Diabetes 2002;51:1256–1262 [DOI] [PubMed] [Google Scholar]
- 3.Biessels GJ, Staekenborg S, Brunner E, Brayne C, Scheltens P. Risk of dementia in diabetes mellitus: a systematic review. Lancet Neurol 2006;5:64–74 [DOI] [PubMed] [Google Scholar]
- 4.Longstreth WT, Jr, Bernick C, Manolio TA, Bryan N, Jungreis CA, Price TR. Lacunar infarcts defined by magnetic resonance imaging of 3660 elderly people: the Cardiovascular Health Study. Arch Neurol 1998;55:1217–1225 [DOI] [PubMed] [Google Scholar]
- 5.Vermeer SE, Den Heijer T, Koudstaal PJ, Oudkerk M, Hofman A, Breteler MM, Rotterdam Scan Study Incidence and risk factors of silent brain infarcts in the population-based Rotterdam Scan Study. Stroke 2003;34:392–396 [DOI] [PubMed] [Google Scholar]
- 6.Streifler JY, Eliasziw M, Benavente OR, et al. North American Symptomatic Carotid Endarterectomy Trial Group Development and progression of leukoaraiosis in patients with brain ischemia and carotid artery disease. Stroke 2003;34:1913–1916 [DOI] [PubMed] [Google Scholar]
- 7.Lazarus R, Prettyman R, Cherryman G. White matter lesions on magnetic resonance imaging and their relationship with vascular risk factors in memory clinic attenders. Int J Geriatr Psychiatry 2005;20:274–279 [DOI] [PubMed] [Google Scholar]
- 8.Cordonnier C, Al-Shahi Salman R, Wardlaw J. Spontaneous brain microbleeds: systematic review, subgroup analyses and standards for study design and reporting. Brain 2007;130:1988–2003 [DOI] [PubMed] [Google Scholar]
- 9.Qiu C, Cotch MF, Sigurdsson S, et al. Retinal and cerebral microvascular signs and diabetes: the age, gene/environment susceptibility-Reykjavik study. Diabetes 2008;57:1645–1650 [DOI] [PubMed] [Google Scholar]
- 10.den Heijer T, Vermeer SE, van Dijk EJ, et al. Type 2 diabetes and atrophy of medial temporal lobe structures on brain MRI. Diabetologia 2003;46:1604–1610 [DOI] [PubMed] [Google Scholar]
- 11.Hayashi K, Kurioka S, Yamaguchi T, et al. Association of cognitive dysfunction with hippocampal atrophy in elderly Japanese people with type 2 diabetes. Diabetes Res Clin Pract 2011;94:180–185 [DOI] [PubMed] [Google Scholar]
- 12.Kamiyama K, Wada A, Sugihara M, et al. Potential hippocampal region atrophy in diabetes mellitus type 2: a voxel-based morphometry VSRAD study. Jpn J Radiol 2010;28:266–272 [DOI] [PubMed] [Google Scholar]
- 13.Schmidt R, Launer LJ, Nilsson LG, et al. CASCADE Consortium Magnetic resonance imaging of the brain in diabetes: the Cardiovascular Determinants of Dementia (CASCADE) Study. Diabetes 2004;53:687–692 [DOI] [PubMed] [Google Scholar]
- 14.Brundel M, van den Heuvel M, de Bresser J, Kappelle LJ, Biessels GJ, Utrecht Diabetic Encephalopathy Study Group Cerebral cortical thickness in patients with type 2 diabetes. J Neurol Sci 2010;299:126–130 [DOI] [PubMed] [Google Scholar]
- 15.Chen Z, Li L, Sun J, Ma L. Mapping the brain in type II diabetes: voxel-based morphometry using DARTEL. Eur J Radiol 2012;81:1870–1876 [DOI] [PubMed] [Google Scholar]
- 16.Kumar R, Anstey KJ, Cherbuin N, Wen W, Sachdev PS. Association of type 2 diabetes with depression, brain atrophy, and reduced fine motor speed in a 60- to 64-year-old community sample. Am J Geriatr Psychiatry 2008;16:989–998 [DOI] [PubMed]
- 17.Thompson PM, Hayashi KM, de Zubicaray G, et al. Dynamics of gray matter loss in Alzheimer’s disease. J Neurosci 2003;23:994–1005 [DOI] [PMC free article] [PubMed]
- 18.Manschot SM, Brands AM, van der Grond J, et al. Utrecht Diabetic Encephalopathy Study Group Brain magnetic resonance imaging correlates of impaired cognition in patients with type 2 diabetes. Diabetes 2006;55:1106–1113 [DOI] [PubMed] [Google Scholar]
- 19.Srikanth V, Westcott B, Forbes J, et al. Methylglyoxal, cognitive function and cerebral atrophy in older people. J Gerontol A Biol Sci Med Sci 2013;68:68–73 [DOI] [PubMed] [Google Scholar]
- 20.Beare R, Srikanth V, Chen J, et al. Development and validation of morphological segmentation of age-related cerebral white matter hyperintensities. Neuroimage 2009;47:199–203 [DOI] [PubMed] [Google Scholar]
- 21.Moran C, Phan TG, Srikanth VK. Cerebral small vessel disease: a review of clinical, radiological, and histopathological phenotypes. Int J Stroke 2012;7:36–46 [DOI] [PubMed]
- 22.Jenkinson M, Smith S. A global optimisation method for robust affine registration of brain images. Med Image Anal 2001;5:143–156 [DOI] [PubMed] [Google Scholar]
- 23.Ashburner J, Friston KJ. Unified segmentation. Neuroimage 2005;26:839–851 [DOI] [PubMed] [Google Scholar]
- 24.Wrench JM, Wilson SJ, Bladin PF, Reutens DC. Hippocampal volume and depression: insights from epilepsy surgery. J Neurol Neurosurg Psychiatry 2009;80:539–544 [DOI] [PubMed] [Google Scholar]
- 25.Wechsler D. Adult Intelligence Scale. New York, Psychological Corporation, 1997 [Google Scholar]
- 26.Lezak M. Neuropsychological Assessment, 4th ed. New York, Oxford University Press, 2004 [Google Scholar]
- 27.Yesavage JA, Brink TL, Rose TL, et al. Development and validation of a geriatric depression screening scale: a preliminary report. J Psychiatr Res 1982–1983;17:37–49 [DOI] [PubMed] [Google Scholar]
- 28.Lancaster JL, Woldorff MG, Parsons LM, et al. Automated Talairach atlas labels for functional brain mapping. Hum Brain Mapp 2000;10:120–131 [DOI] [PMC free article] [PubMed] [Google Scholar]
- 29.Jongen C, van der Grond J, Kappelle LJ, Biessels GJ, Viergever MA, Pluim JP, Utrecht Diabetic Encephalopathy Study Group Automated measurement of brain and white matter lesion volume in type 2 diabetes mellitus. Diabetologia 2007;50:1509–1516 [DOI] [PMC free article] [PubMed] [Google Scholar]
- 30.van Elderen SG, de Roos A, de Craen AJ, et al. Progression of brain atrophy and cognitive decline in diabetes mellitus: a 3-year follow-up. Neurology 2010;75:997–1002 [DOI] [PubMed] [Google Scholar]
- 31.Braak H, Braak E. Neuropathological stageing of Alzheimer-related changes. Acta Neuropathol 1991;82:239–259 [DOI] [PubMed] [Google Scholar]
- 32.Willette AA, Xu G, Johnson SC, et al. Insulin resistance, brain atrophy, and cognitive performance in late middle-aged adults. Diabetes Care 2013;36:443–449 [DOI] [PMC free article] [PubMed] [Google Scholar]
- 33.van Harten B, de Leeuw FE, Weinstein HC, Scheltens P, Biessels GJ. Brain imaging in patients with diabetes: a systematic review. Diabetes Care 2006;29:2539–2548 [DOI] [PubMed] [Google Scholar]
- 34.van Harten B, Oosterman J, Muslimovic D, van Loon BJ, Scheltens P, Weinstein HC. Cognitive impairment and MRI correlates in the elderly patients with type 2 diabetes mellitus. Age Ageing 2007;36:164–170 [DOI] [PubMed] [Google Scholar]
- 35.Exalto LG, Whitmer RA, Kappele LJ, Biessels GJ. An update on type 2 diabetes, vascular dementia and Alzheimer’s disease. Exp Gerontol 2012;47:858–864 [DOI] [PubMed] [Google Scholar]
- 36.Srikanth V, Maczurek A, Phan T, et al. Advanced glycation endproducts and their receptor RAGE in Alzheimer’s disease. Neurobiol Aging 2011;32:763–777 [DOI] [PubMed] [Google Scholar]
- 37.Cholerton B, Baker LD, Craft S. Insulin resistance and pathological brain ageing. Diabet Med 2011;28:1463–1475 [DOI] [PubMed] [Google Scholar]
- 38.Correia SC, Santos RX, Carvalho C, et al. Insulin signaling, glucose metabolism and mitochondria: major players in Alzheimer’s disease and diabetes interrelation. Brain Res 2012;1441:64–78 [DOI] [PubMed] [Google Scholar]
- 39.Whitmer RA. Type 2 diabetes and risk of cognitive impairment and dementia. Curr Neurol Neurosci Rep 2007;7:373–380 [DOI] [PubMed] [Google Scholar]