

Abstract
OBJECTIVE
To compare two validated closed-loop (CL) algorithms versus patient self-control with CSII in terms of glycemic control.
RESEARCH DESIGN AND METHODS
This study was a multicenter, randomized, three-way crossover, open-label trial in 48 patients with type 1 diabetes mellitus for at least 6 months, treated with continuous subcutaneous insulin infusion. Blood glucose was controlled for 23 h by the algorithm of the Universities of Pavia and Padova with a Safety Supervision Module developed at the Universities of Virginia and California at Santa Barbara (international artificial pancreas [iAP]), by the algorithm of University of Cambridge (CAM), or by patients themselves in open loop (OL) during three hospital admissions including meals and exercise. The main analysis was on an intention-to-treat basis. Main outcome measures included time spent in target (glucose levels between 3.9 and 8.0 mmol/L or between 3.9 and 10.0 mmol/L after meals).
RESULTS
Time spent in the target range was similar in CL and OL: 62.6% for OL, 59.2% for iAP, and 58.3% for CAM. While mean glucose level was significantly lower in OL (7.19, 8.15, and 8.26 mmol/L, respectively) (overall P = 0.001), percentage of time spent in hypoglycemia (<3.9 mmol/L) was almost threefold reduced during CL (6.4%, 2.1%, and 2.0%) (overall P = 0.001) with less time ≤2.8 mmol/L (overall P = 0.038). There were no significant differences in outcomes between algorithms.
CONCLUSIONS
Both CAM and iAP algorithms provide safe glycemic control.
The burden of managing type 1 diabetes mellitus (T1DM) is considerable for the patient (1). Automating glucose measurements and insulin administration may ease diabetes management. This is known as a “closed-loop system” or “artificial pancreas” (AP). A computer algorithm determines insulin infusion rates from continuously measured glucose levels, aiming to keep glucose levels within target range. AP systems have a long development history (2). One of the earliest systems was the Biostator device (Miles Laboratories, Elkhart, IN), which entered the market in 1977 (3). The Biostator was a bedside device that required intravenous access to determine blood glucose and infuse insulin or glucose. The necessity of intravenous access limited usability of the device to in-hospital settings. Outpatient use became conceivable with the advent of continuous glucose monitoring (CGM) systems, which measure glucose in interstitial fluid via placement of a sensor in the subcutaneous fat. Although subcutaneous CGM combined with continuous subcutaneous insulin infusion (CSII) allowed for closed-loop (CL) experiments, CGM accuracy needs to be improved upon and is considered to be one of the limiting factors in development of AP systems (4,5). CL algorithms should take into account the uncertainty surrounding CGM reported glucose values, as well as the delay of insulin action after its administration. Many current algorithms used to develop an AP are based on model predictive control (MPC) (6,7), while others are based on the proportional-integral-derivative approach (8–11), which may also use insulin feedback (12). MPC can be used to take into account limited CGM accuracy, delays in insulin absorption, and glucose peaks brought about by meals (4). This work aims to compare two CL algorithms: one from the University of Cambridge (CAM) and the other from collaboration between the Universities of Pavia, Padova (13); University of Virginia; and University of California at Santa Barbara (international AP [iAP]) (14) against patient self-management (open loop [OL]). Both algorithms use MPC to control blood glucose levels and have shown that their use leads to diminished occurrence of hypoglycemia at night when used for CL control in small-scale clinical research center (CRC) trials (15,16). The CAM algorithm is initialized using the subject’s weight, total daily insulin, and the basal 24-h pump profile, while the iAP algorithm uses the subject’s weight and basal 24-h pump profile. The iAP but not CAM algorithm also uses information about correction factors, insulin-to-carbohydrate ratios, and pump setting during exercise. Both algorithms use mealtime announcement to apply prandial insulin boluses, which has been shown to lead to improved postprandial glucose excursions (17); however, while the CAM algorithm uses this information to administrate the meal bolus computed with the conventional therapy, the iAP meal bolus is automatically computed by the MPC control algorithm including in the cost function the conventional therapy as references. The CAM algorithm uses a two-compartment model of glucose kinetics and a three-compartment model of insulin action solved analytically for computational speed and robustness. The model is adapted at each control cycle to a particular subject by modifying two model parameters representing unexplained glucose flux to accommodate the prediction error and meal carbohydrate bioavailability. In addition, several versions of the model are tested to assess the likelihood of slow/fast insulin absorption and slow/fast meal absorption. The versions are combined in a probabilistic fashion taking into account prediction accuracy of each model version. The iAP MPC algorithm uses the mean linearized model of the in silico population of the U.S. Food and Drug Administration–approved Virginia/Padova simulator for all the patients. Both algorithms are only aware of the CGM data monitored during the trial and do not take into account safety blood glucose values measured for safety reasons during trials. Recent results on a near full-day study showed that the iAP algorithm reduced mean glucose concentration without increasing hypoglycemia (18). This study aims to assess safety of these systems on a broader scale, i.e., in a large series of 48 patients investigated in several clinical research sites, including centers naïve to such trials, in order to increase external validity of the reported results. Secondly, we wanted to extend duration of experiments beyond nighttime to encompass a near full day (23 h). By doing this, we were able to test the algorithms’ ability to cope with meals and exercise, which are important challenges for CL control (4,11,18,19).
RESEARCH DESIGN AND METHODS
Forty-eight patients with T1DM were included in this three-way randomized crossover intervention study in six clinical centers (Academic Medical Center, Amsterdam, the Netherlands; Centre Hospitalier Regional Universitaire, Montpellier, France; Medical University, Graz, Austria; Profil Institute for Metabolic Research GmbH, Neuss, Germany; University of Cambridge, Cambridge, U.K.; and University of Padova, Padova, Italy). The study was powered to detect a 5% difference in time in target between any of the two algorithms (primary outcome) with 90% power and an α of 0.05 (N = 44). Allowing for dropout, we included eight patients per center (n = 48).The trial was conducted in accordance with the ethics principles set forth in the Declaration of Helsinki and was approved by the medical ethics committees of participating centers.
Main inclusion criteria included age ≥18 years and T1DM treated with CSII with a rapid-acting insulin analog for at least 3 months. Main exclusion criteria included pregnancy and use of medications that significantly impact glucose metabolism (Supplementary Table 1). Patients visited the CRC for an inclusion visit and provided informed consent. The remainder of the inclusion visit included CGM training and determination or estimation of Vo2max.
The main intervention comprised three 24-h admissions (duration of intervention 23 h) to the CRC during which patients underwent the study interventions in random order (CL with CAM or iAP and OL). Admissions were at least 1 week apart to prevent carry-over effects. Between 24 and 48 h before admission, a nonblinded Dexcom Seven Plus CGM sensor (Dexcom, San Diego, CA) was placed and calibrated using finger-stick glucose values. During each study visit, CGM was calibrated with plasma glucose measurements performed either with a YSI (YSI, Yellow Springs, OH) (Graz, Neuss, and Padova) or with a blood glucose meter (Roche Diagnostics, Mannheim, Germany) (Amsterdam, Cambridge, and Montpellier). Calibration was performed four times per 24 h: at 1875 h (before dinner), 2300 h (before bedtime), 0700 h (before breakfast), and 1450 h (before exercise). At the beginning of each admission, an Omnipod Insulin Patch-Pump (Insulet, Bedford, MA) filled with insulin aspart (Novo Nordisk, Bagsvaerd, Denmark) was placed on the abdomen. The CL algorithms ran on a personal computer loaded with Windows XP Professional (Microsoft, Redmond, WA), and code was executed using MatLab 2009b (MathWorks, Natick, MA) in case of iAP and as a separate executable in case of CAM. The CL algorithm was fed with CGM data either automatically (Amsterdam, Montpellier, and Padova) or by manual transfer of glucose data (Cambridge, Graz, and Neuss), depending on regulatory requirements and availability of devices. The algorithms were unaware of plasma glucose values. The CL algorithms calculated the appropriate insulin doses, which were then automatically or manually transferred to the patch pump. The control cycle was 5 min for iAP and 15 min for CAM in automated centers and 15 min for both algorithms in manual centers.
In both automated and manual centers, the attending physician could override actions initiated or suggested by the CL algorithm at any time.
Admission days
Patients arrived at the CRC at 1800 h (Fig. 1). A meal of 80 g carbohydrates was given at 1900 h for dinner, followed by sleep from 2300 h through 0700 h the next day. A 50-g carbohydrate breakfast was given at 0800 h, followed by a 60-g carbohydrate lunch at noon. Exercise, consisting of two bouts of 15-min exercise at 50% Vo2max, was started at 1500 h, and the study ended at 1800 h. Time and carbohydrate contents of meals were announced to the system 15 min before eating. In case of the iAP algorithm, the mealtime insulin bolus was then calculated by the algorithm. In case of the CAM algorithm, the algorithm advised a bolus of 80% of the patient’s usually calculated mealtime bolus. In case of OL control, patients treated themselves as usual with the advice to administer mealtime boluses 15 min before commencement of the meal, as this has been shown to significantly reduce postprandial glucose excursion (20). Size of mealtime boluses was determined by patients themselves based on carbohydrate contents of the meals, which was announced to them. During OL visits, subjects were given the option of reducing usual basal rates 1–2 h before exercise. Patients could also choose to eat a snack before exercise, while all patients were given a snack consisting of 20 g carbohydrates if the reference plasma glucose was <7.8 mmol/L 30 min before exercise. This snack was announced to the iAP algorithm but not to the CAM algorithm. In case of hypoglycemia measured by YSI, patients were treated with a 15-g carbohydrate snack; such recue carbohydrates were announced to both algorithms. Rescue carbohydrates were given on the basis of YSI values only at ≤3.3 mmol/L in patients experiencing symptoms of hypoglycemia and at ≤2.8 mmol/L in patients not experiencing symptoms. No additional carbohydrates were provided to the patient other than those mentioned before. Throughout the admission, blood was sampled for measurement of plasma glucose and insulin levels every 30 min. Blood sampling frequency increased to every 15 min after meals and exercise and decreased to once an hour at night. Blood was sampled for plasma glucose measurement using the YSI 2300STATplus analyzer (YSI). Heparinized plasma was frozen for central determination of insulin aspart concentrations using an insulin chemiluminescence assay (Invitron, Monmouth, U.K.) (S. Luzio, The Institute of Life Sciences, Swansea University, Swansea, U.K.).
Figure 1.
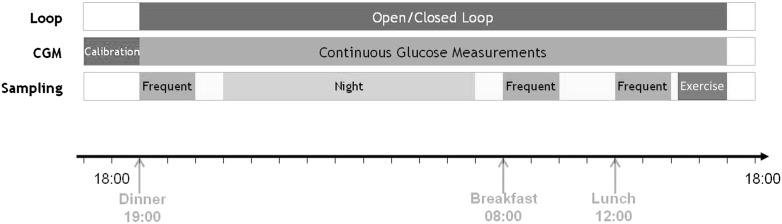
Overview of the admission day. Patients underwent OL or CL control and were served three meals. The admission day also included an exercise bout. CL control was continuous for 23 h.
Data acquisition
An electronic clinical data-management system was used (OpenClinica; OpenClinica, Waltham, MA). The CL software also kept records of all CGM glucose data, YSI glucose data, administered insulin data, and information concerning meals and exercise. All these files where checked and locked in a central database before data analysis.
Data analysis and outcomes
All outcome measures were predefined in a statistical analysis plan. The primary outcome was time spent in the target range, defined as plasma glucose values between 3.9 and 8.0 mmol/L in the basal or late postprandial state and plasma glucose values between 3.9 and 10.0 mmol/L in the early postprandial phase (up to 3 h after the meals). Other outcomes are listed in Table 1. In the case of administration of rescue carbohydrates, an analysis was performed on the number of times a rescue amount was administered. Amounts administered within a short time of each other were not aggregated into a single event. An intention-to-treat analysis (ITT) and a per-protocol analysis (PP) were done. The aim of the IIT analysis was to describe overall performance of the system, accepting any failure or poor performance of any system component (e.g., insulin pump, sensor, algorithms, or operator failure). The aim of the PP analysis was to describe performance of the CL algorithms at times that all other parts of the system were functioning adequately. For the PP analysis, time frames were removed from the intervention session in case of poor performance of system components. This was defined by consensus of all clinical partners and according to a predefined and objective set of implementation rules (Supplementary Table 2). Linear interpolation was used between CGM data points to allow for 1-min pairing of YSI and CGM data. If >3 h data were missing, no interpolation was performed. For each outcome, a repeated-measures ANOVA taking into account the sequence of study interventions was fitted. When the repeated-measures model detected a significant difference, pairwise testing was done between all three treatments using a two-tailed t test. In addition, differences in outcome measures were assessed between centers using manual control and centers using fully automated control and between centers using YSI values for sensor calibrations and those who used finger-stick values for sensor calibration. All statistical analyses were performed with PASW Statistics 18.0 (IBM, Armonk, NY).
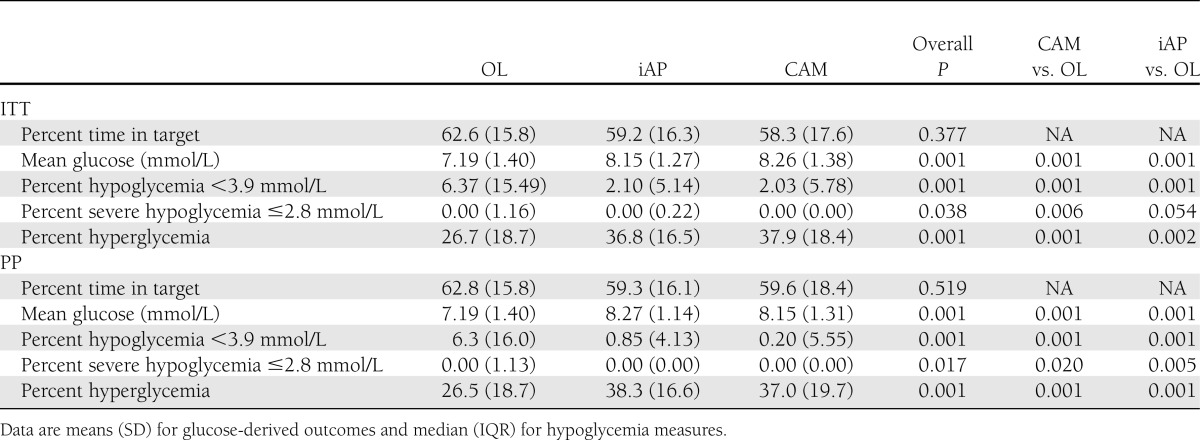
Table 1.
Glucose-derived outcomes and hypoglycemic measures: percent time in target, hypoglycemia, severe hypoglycemia, and hyperglycemia
RESULTS
Available data
Forty-seven patients completed the study, and one patient dropped out after visit 1. The PP analysis excluded on average 10.2% of all available data (0.4% for OL, 13% for iAP, and 17% for CAM), including time frames with technical errors that could affect CL control or, less frequently, human factors such as operator error, which could influence OL control.
Baseline characteristics
Fourteen (30%) participants were female. Patients had a median age of 41.5 years (interquartile range [IQR] 17.0), HbA1c level of 7.6% (1.2), BMI of 25.0 kg/m2 (4.9), duration of diabetes of 19.8 years (19.2), and duration of pump use of 3.6 years (6.1).
Glucose-derived outcomes: intention-to-treat analysis
Time in target.
Time in target, defined as a plasma glucose level between 3.9 and 8.0 mmol/L or up to 10 mmol/L postprandially, was not significantly different between interventions: 62.6% for OL, 59.2% for iAP, and 58.3% for CAM (overall P = 0.377).
Time in hypoglycemia (<3.9 mmol/L).
There was significantly less time spent in hypoglycemia, defined as a plasma glucose level <3.9 mmol/L, during CL: 6.4%, 2.1%, and 2.0% for OL, iAP, and CAM, respectively (P = 0.001).
Time in hypoglycemia (≤2.8 mmol/L).
There was significantly less hypoglycemia ≤2.8 mmol/L during CL: 0%, 0%, and 0% (P = 0.038).
Mean glucose level.
Average glucose levels were lower in OL than with CL: 7.19, 8.15, and 8.26 mmol/L (overall P = 0.001). Figure 2 depicts glucose levels over the time course of the experiments.
Figure 2.

Mean glucose profiles over time for OL, CAM, and iAP. Meals were given at 1900 h, 0800 h, and 1200 h. Exercise was performed at 1500 h. The dashed lines mark the target range. m, minute.
Time in hyperglycemia.
Time in hyperglycemia defined as a blood glucose level >8.0 mmol/L or >10 mmol/L postprandially was lower in OL than with CL: 26.7%, 36.8%, and 37.9% (P = 0.001).
Glycemic variability.
Glycemic variability as expressed by mean absolute glucose (MAG) and SD of blood glucose levels was not significantly different: MAG of 1.802 mmol/L/h (0.445) for OL, 1.969 mmol/L/h (0.422) for iAP, and 1.833 mmol/L/h (0.431) for CAM (overall P = 0.080). The SD was 2.568 (0.821) for OL, 2.514 (0.767) for iAP, and 2.592 (0.799) for CAM (overall P = 0.872).
Inter-CL algorithm differences.
There were no significant differences in any of these outcomes in a head-to-head comparison of the two CL algorithms (data not shown) (Table 1).
Glucose-derived outcomes: per protocol analysis
Time in target.
Time in target, defined as a blood glucose level between 3.9 and 8.0 mmol/L or up to 10 mmol/L postprandially, was not different between interventions: 62.8%, 59.3%, and 59.6% (P = 0.519).
Time in hypoglycemia (<3.9 mmol/L).
There was significantly less time spent in hypoglycemia, defined as a blood glucose level <3.9 mmol/L, during CL: 6.3%, 0.85, and 0.2% (P = 0.001).
Time in hypoglycemia (≤2.8 mmol/L).
There was significantly less hypoglycemia (≤2.8 mmol/L) with CL: 0%, 0%, and 0% (P = 0.017).
Mean glucose level.
Mean glucose level was significantly lower in OL than with CL: 7.19, 8.27, and 8.15 mmol/L (P = 0.001).
Time in hyperglycemia.
Time in hyperglycemia defined as a blood glucose level >8.0 mmol/L or >10 mmol/L postprandially was lower in OL than with CL: 26.5%, 38.3%, and 37.0% (P = 0.001).
Glycemic variability.
Glycemic variability as expressed by MAG (SD) of blood glucose levels was not significantly different: MAG of 1.798 mmol/L/h (0.438) for OL, 1.982 mmol/L/h (0.505) for iAP, and 1.816 mmol/L/h (0.484) for CAM (overall P = 0.051). The SD was 2.569 mmol/L/h (0.821) for OL, 2.337 mmol/L/h (0.766) for iAP, and 2.392 mmol/L/h (0.681) for CAM (overall P = 0.257).
Interalgorithm differences.
There were no significant differences in any of these outcomes between the two CL algorithms (Table 1).
Additional analyses
CGM performance.
The mean absolute relative difference of the CGM data compared with reference values was 15.1% (9.2) in the ITT analysis versus 14.1% (6.0) in the PP analysis. Mean absolute relative difference was calculated per subject and then averaged.
Manual versus automated centers.
There were no differences in outcome measures between centers that used manual control versus those who used fully automated control (data not shown, ITT analysis), except in the case of time in target for the CAM algorithm, which showed a higher time in target in the manual centers (64.7% [14.4] versus 51.7% [18.4] in automated centers P = 0.010), and for time spent in hyperglycemia, which was lower in manual centers (31.6% [15.0] versus 44.4% [19.6] in automated centers, P = 0.016).
Blood glucose meter versus YSI calibration.
There were no differences in any of the glucose outcome measures between those centers calibrating the CGM devices with YSI values and those calibrating with blood glucose meter measurements (data not shown, ITT analysis).
Insulin parameters.
The total number of infused insulin units per hour (ITT analysis) was lower in CL than with OL: median 1.80 IU/h (interquartile range [IQR] 1.0), 1.70 IU/h (0.70), and 1.60 IU/h (0.60) for OL, iAP, and CAM, respectively (P = 0.001). The difference between CL algorithms, with CAM infusing less than with iAP, was also significant (P = 0.001). Subsequently, the mean plasma insulin concentrations were higher in OL than with CL: 160.2 pmol/L (109.7), 156.2 pmol/L (114.2), and 138.7 pmol/L (107.0) (P = 0.001). This difference was also significant between iAP and CAM algorithms (P = 0.009). Mean postprandial insulin infusion profiles per algorithm are depicted in Supplementary Fig. 1.
Safety parameters.
The manual override function of the system was never used in any of the experiments.
Rescue carbohydrates.
The number of events in which a carbohydrate snack was given to the patient as a safety precaution when the patient was in hypoglycemia was significantly lower in CL (ITT analysis). This occurred a median of 0 (IQR 1.0) times per patient for CAM, 0 (1.0) times for iAP, and 1.0 (2.0) times for OL (total number of events 20, 30, and 78 for CAM, iAP, and OL, respectively; overall P = 0.001) with no statistical difference between the CL algorithms P = 0.598). In the PP Analysis, there was a median of 0 (0.0) times per patient for CAM, 0 (0.0) times for iAP, and 1.0 (2.0) times for OL (total number of events 11, 10, and 76 for CAM, iAP, and OL, respectively; overall P = 0.001; with no statistical difference between the CL algorithms, P = 0.861).
CONCLUSIONS
In the largest multicenter CL trial performed so far with overnight and daytime control, which incorporated both meal and exercise challenges, we showed that either two CL systems can keep glucose in the target range comparable with patient’s self-management of CSII, with the benefit of significantly less time spent in hypoglycemia. Reduction of time spent in hypoglycemia is important in view of future home use of such algorithm-driven insulin-infusion systems.
This, however, came at the expense of higher mean glucose values and more time spent in hyperglycemia. We think that the latter was due to intentional detuning of both algorithms before commencement of this trial, with respect to previous studies (15,18), to enhance safety. Lower insulin levels during CL in both algorithms support this hypothesis, especially in the CAM algorithm, where earlier overnight experiments showed similar mean insulin and similar mean glucose levels during OL and CL control (15). Similarly, in previous 18-h experiments the iAP algorithm reduced mean glucose (18). Detuning was primarily done to negate challenges with accuracy and functionality of the Dexcom Seven plus sensor. Because of the possibility of occasional but substantial overread, detuning of algorithms was necessary. Second, the algorithms had not been designed to accommodate an exercise bout. Now that the trial is completed and the next generation of CGM has become available, there is room for retuning the algorithms to enhance efficacy. In addition to detuning, there is of course a well-known inverse relation between mean glucose achieved and hypoglycemia in T1DM (21). This trial was conducted in patients with fairly good glycemic control (median HbA1c 7.6%), and although mean glucose in CL was higher than in OL, time in target range during CL was acceptable.
Another limitation was in the assessment of the postexercise period, which was relatively short; there are no data available regarding the occurrence of hypoglycemia beyond 3 h postexercise. Also, this study was limited in that in three centers, fully automated control was not allowed for regulatory reasons. Because all required manual actions could not be completed within 5 min, the control cycle in manual centers was once every 15 min. However, this only affected the iAP algorithm, as the CAM algorithm had a 15-min control cycle both in automated and manual control centers. In this study, manual mealtime announcements were used, which has as an important advantage: more rapid rises in insulinemia appear than with a fully CL approach. However, mealtime announcement including its content is severely dependent on carbohydrate counting by patients, which could limit its usefulness in real-life settings.
This trial also showed that CL experiments can be performed in relatively inexperienced centers, extending the external validity of the results beyond the centers that have been doing such experiments for years and where close collaboration between algorithm developers and clinical researchers is present.
For moving forward in terms of miniaturization of the system, many of the supporting software layers will be removed and software will be embedded, which most likely will decrease the amount of software failures significantly. With the results of the current trial and further miniaturization, we feel experiments outside the clinical research center are now needed to move the field forward. In particular, trials with an extended period of CL control are needed to assess long-term effects on HbA1c levels.
In conclusion, we show that a full day of CL glucose control is possible, even when systems are challenged with meals and exercise, and that the level of glycemic control is comparable with OL control. CL control resulted in less time spent in hypoglycemia at the expense of higher mean glucose with intentionally detuned algorithms according to the “safety first” principle. CL control may be achieved with currently available insulin pumps and sensors, and AP experiments can be brought into the homes of patients with T1DM.
Acknowledgments
This research was supported by the European Community Framework Programme 7 (FP7-ICT-2009-4 grant no. 247138). J.K.M. reports having received grant support from the European Commission and support for travel to study and related meetings by the European Commission. R.H. reports on his institution receiving grants or having grants pending from JDRF, Diabetes UK, National Institutes of Health, National Institute for Health Research Biomedical Research Centres, and European Foundation for the Study of Diabetes.
J.H.D. reports serving on the board of Roche Diagnostics and Johnson & Johnson, having received grants from Dexcom and Medtronic, and receiving speaker’s fees from Dexcom and Medtronic. R.H. reports serving on advisory boards for Animas and Medtronic and having received consultancy fees from Profil GmbH and B. Braun; reports on his institution having received payment for lectures including service on speaker’s bureaus for Medtronic, Eli Lilly, LifeScan, and Novo Nordisk and receiving a license fee from Beckton Dickinson; and reports having four patents pending relevant to this work. J.K.M. received speaker’s fees from Novo Nordisk and travel funding from Novo Nordisk and Novartis. E.R. reports receiving speakers fees from Dexcom and serving on the advisory board for Novo Nordisk. M.L.E. reports receiving speaker’s fees from Ypsomed, Roche, Medtronic, and Cellnovo; owning stock options from Cellnovo; and receiving speaker’s fees from Abbott Diabetes Care and Animas. C.C. reports serving on the board of Animas and having received grants from Dexcom. No other potential conflicts of interest relevant to this article were reported.
Dexcom, Inc., and Insulet Corporation did not have any influence on the trial design, analysis, or preparation of the manuscript, and they did not have access to any of the trial data.
Y.M.L. contributed to study design, gathered and analyzed data, and wrote the manuscript. J.H.D., M.E., C.C., and L.H. contributed to study design and reviewed and edited the manuscript. K.Z. and A.A. contributed to discussion. L.L. contributed to study design, gathered and analyzed data, and edited the manuscript. M.N. analyzed data. K.C., K.K., D.E., J.M.A., W.D., J.K.M., J.P., A.Fa., D.B, A.Fi., R.S., G.L., P.S., C.T., G.D.N., S.A., and C.B. gathered data. M.E.W. contributed to study design and validated the Cambridge closed-loop algorithm including simulation studies. M.L.E. contributed to study design and acted as the principal clinical investigator for Cambridge site. R.H. developed the Cambridge closed-loop algorithm, contributed to study design, and reviewed and edited the manuscript. E.R. drafted the study design and reviewed and edited the manuscript. S.D.F. and C.D.M. gathered data and analyzed data and contributed to the analysis plan. L.M. and F.D.P. gathered and analyzed data. Y.M.L. is the guarantor of this work and, as such, had full access to all the data in the study and takes responsibility for the integrity of the data and the accuracy of the data analysis.
Parts of this study were presented at the 72nd Scientific Sessions of the American Diabetes Association, Philadelphia, Pennsylvania, 8–12 June 2012 and the 48th Annual Meeting of the European Association for the Study of Diabetes, Berlin, Germany, 1–5 October 2012.
The authors thank Dexcom, Inc., and Insulet Corporation for providing the materials necessary for this trial at a research rate.
Footnotes
Clinical trial reg. no. ISRCTN62034905, www.isrctn.org.
This article contains Supplementary Data online at http://care.diabetesjournals.org/lookup/suppl/doi:10.2337/dc12-1956/-/DC1.
References
- 1.Watkins KW, Connell CM, Fitzgerald JT, Klem L, Hickey T, Ingersoll-Dayton B. Effect of adults’ self-regulation of diabetes on quality-of-life outcomes. Diabetes Care 2000;23:1511–1515 [DOI] [PubMed] [Google Scholar]
- 2.Cobelli C, Renard E, Kovatchev B. Artificial pancreas: past, present, future. Diabetes 2011;60:2672–2682 [DOI] [PMC free article] [PubMed] [Google Scholar]
- 3.Clemens AH, Chang PH, Myers RW. The development of Biostator, a Glucose Controlled Insulin Infusion System (GCIIS). Horm Metab Res 1977;7(Suppl. 7):23–33 [PubMed] [Google Scholar]
- 4.Hovorka R. Closed-loop insulin delivery: from bench to clinical practice. Nat Rev Endocrinol 2011;7:385–395 [DOI] [PubMed] [Google Scholar]
- 5.Steil GM, Rebrin K. Closed-loop insulin delivery—what lies between where we are and where we are going? Expert Opin Drug Deliv 2005;2:353–362 [DOI] [PubMed] [Google Scholar]
- 6.Magni L, Raimondo DM, Bossi L, et al. Model predictive control of type 1 diabetes: an in silico trial. J Diabetes Sci Tech 2007;1:804–812 [DOI] [PMC free article] [PubMed] [Google Scholar]
- 7.Hovorka R, Canonico V, Chassin LJ, et al. Nonlinear model predictive control of glucose concentration in subjects with type 1 diabetes. Physiol Meas 2004;25:905–920 [DOI] [PubMed] [Google Scholar]
- 8.Albisser AM, Leibel BS, Ewart TG, Davidovac Z, Botz CK, Zingg W. An artificial endocrine pancreas. Diabetes 1974;23:389–396 [DOI] [PubMed] [Google Scholar]
- 9.Clemens AH. Feedback control dynamics for glucose controlled insulin infusion system. Med Prog Technol 1979;6:91–98 [PubMed] [Google Scholar]
- 10.Marchetti G, Barolo M, Jovanovic L, Zisser H, Seborg DE. An improved PID switching control strategy for type 1 diabetes. IEEE Trans Biomed Eng 2008;55:857–865 [DOI] [PubMed] [Google Scholar]
- 11.Steil GM, Rebrin K, Darwin C, Hariri F, Saad MF. Feasibility of automating insulin delivery for the treatment of type 1 diabetes. Diabetes 2006;55:3344–3350 [DOI] [PubMed] [Google Scholar]
- 12.Steil GM, Palerm CC, Kurtz N, et al. The effect of insulin feedback on closed loop glucose control. J Clin Endocrinol Metab 2011;96:1402–1408 [DOI] [PMC free article] [PubMed] [Google Scholar]
- 13.Soru P, De NG, Toffanin C, Dalla MC, Cobelli C, Magni L, AP@home Consortium MPC based artificial pancreas: strategies for individualization and meal compensation. Annu Rev Control 2012;36:118-128 [Google Scholar]
- 14.Patek SD, Magni L, Dassau E, et al. International Artificial Pancreas (iAP) Study Group Modular closed-loop control of diabetes. IEEE Trans Biomed Eng 2012;59:2986–2999 [DOI] [PMC free article] [PubMed] [Google Scholar]
- 15.Hovorka R, Allen JM, Elleri D, et al. Manual closed-loop insulin delivery in children and adolescents with type 1 diabetes: a phase 2 randomised crossover trial. Lancet 2010;375:743–751 [DOI] [PubMed] [Google Scholar]
- 16.Kovatchev B, Cobelli C, Renard E, et al. Multinational study of subcutaneous model-predictive closed-loop control in type 1 diabetes mellitus: summary of the results. J Diabetes Sci Tech 2010;4:1374–1381 [DOI] [PMC free article] [PubMed] [Google Scholar]
- 17.Weinzimer SA, Steil GM, Swan KL, Dziura J, Kurtz N, Tamborlane WV. Fully automated closed-loop insulin delivery versus semiautomated hybrid control in pediatric patients with type 1 diabetes using an artificial pancreas. Diabetes Care 2008;31:934–939 [DOI] [PubMed] [Google Scholar]
- 18.Breton M, Farret A, Bruttomesso D, et al. International Artificial Pancreas Study Group Fully integrated artificial pancreas in type 1 diabetes: modular closed-loop glucose control maintains near normoglycemia. Diabetes 2012;61:2230–2237 [DOI] [PMC free article] [PubMed] [Google Scholar]
- 19.Russell SJ, El-Khatib FH, Nathan DM, Magyar KL, Jiang J, Damiano ER. Blood glucose control in type 1 diabetes with a bihormonal bionic endocrine pancreas. Diabetes Care 2012;35:2148–2155 [DOI] [PMC free article] [PubMed] [Google Scholar]
- 20.Luijf YM, van Bon AC, Hoekstra JB, Devries JH. Premeal injection of rapid-acting insulin reduces postprandial glycemic excursions in type 1 diabetes. Diabetes Care 2010;33:2152–2155 [DOI] [PMC free article] [PubMed] [Google Scholar]
- 21.The Diabetes Control and Complications Trial Research Group The effect of intensive treatment of diabetes on the development and progression of long-term complications in insulin-dependent diabetes mellitus. N Engl J Med 1993;329:977–986 [DOI] [PubMed] [Google Scholar]