

Abstract
OBJECTIVE
The incidence of type 1 diabetes complications appears to be decreasing, but relative contributions of risk factors are unclear. We thus estimated the effect of modifiable risk factors on the incidence of a composite end point, major outcomes of diabetes (MOD).
RESEARCH DESIGN AND METHODS
The Pittsburgh Epidemiology of Diabetes Complications (EDC) Study was used to derive two cohorts based on diabetes diagnosis year (1960–1969 and 1970–1980). Baseline exam data in the current analysis for the 1960s group were collected in 1986–1988 and for the 1970s in 1996–1998. Each group was followed for 8 years for MOD incidence (diabetes-related death, myocardial infarction, revascularization procedure/blockage ≥50%, stroke, end-stage renal disease, blindness, and amputation). Assessed risk factors include the following: HbA1c, hypertension, microalbuminuria, BMI, hypercholesterolemia, and smoking. Accelerated failure time models were used to estimate the acceleration factor.
RESULTS
MOD incidence decreased in the 1970s cohort (15.8% [95% CI 11.6–21.4]) compared with the 1960s (22.6% [17.0–29.1]) over the 8-year follow-up (P = 0.06). Hypertension and microalbuminuria were associated with significantly accelerated MOD incidence in both cohorts (P < 0.01 for both). High HbA1c (P = 0.0005), hypercholesterolemia (P = 0.01), and current smoking (P = 0.003) significantly accelerated the incidence of MOD in the 1960s but not 1970s cohort. BMI was not associated with MOD in either cohort.
CONCLUSIONS
These results suggest that hypertension and microalbuminuria remain important predictors of complications that are not being adequately addressed.
The Diabetes Control and Complications Trial/Epidemiology of Diabetes Interventions and Complications (DCCT/EDIC) Study provides convincing evidence that more intensive diabetes therapy is associated with long-term benefits for both microvascular (1) and macrovascular (2) complications, which likely relates to the decrease in incidence of most type 1 diabetes complications. However, little is known about the relative impact of HbA1c and other major risk factors on complication risk in cohorts experiencing generally improved glycemic control after the publication of the DCCT/EDIC results and implementation of those standards of care (3). Also, although many studies (1,2,4–18) have reported risk factors for individual complications, only one recent publication has focused on the combined incidence of major outcomes of diabetes (MOD) (19). This report, which examined how well MOD was predicted by various definitions of the metabolic syndrome and their components, did not examine the impact of risk factor differences over time. Thus, it is largely unknown which and to what degree risk factor changes account for improvements in MOD. Our objective was thus to determine the relative roles of major modifiable risk factors, specifically, glycemia, hypertension, hypercholesterolemia, microalbuminuria, BMI, and smoking, on the 8-year incidence of any MOD within two subcohorts of the Pittsburgh Epidemiology of Diabetes Complications (EDC) Study; participants diagnosed with type 1 diabetes between 1960 and 1969 and those diagnosed between 1970 and 1980. We also examined whether adjustments for these risk factors affect the temporal (i.e., cohort) association with MOD incidence.
RESEARCH DESIGN AND METHODS
Study population
The Pittsburgh EDC Study is a prospective cohort study of childhood-onset (<17 years old) type 1 diabetes. All participants were diagnosed or seen within 1 year of diagnosis at Children’s Hospital of Pittsburgh between 1950 and 1980. The cohort has been described in detail elsewhere (3). In brief, participants have been followed since 1986–1988, initially with biennial examinations for 10 years and thereafter with biennial questionnaires and a further examination 18 years postbaseline. Data used in the current analyses are from two subcohorts of the EDC Study based on year of diabetes diagnosis (1960–1969 or 1970–1980). To obtain comparable distributions of age and diabetes duration in the cohorts and equivalent follow-up, baseline for the 1960s cohort consisted of exam data collected during the first examination period (1986–1988), whereas for the 1970s cohort, data collected during the sixth examination period (1996–1998) was used for baseline. Research protocols were approved by the University of Pittsburgh institutional review board, and all participants provided written informed consent.
Ascertainment of MOD
MOD incidence was defined as the first instance of diabetes-related death, myocardial infarction, revascularization procedure and/or blockage ≥50%, stroke or carotid endarterectomy, end-stage renal disease (ESRD), blindness, or amputation. Death certificates, next of kin interviews, and medical records, as appropriate, were reviewed by a mortality classification committee composed of at least two physician epidemiologists, and cause of death was classified according to the Diabetes Epidemiology Research International (DERI) system (20). Medical records were also obtained for all cardiovascular events, which were classified as 1) coronary artery disease (CAD), including myocardial infarction, revascularization procedure, and blockage ≥50%, and 2) cerebrovascular disease (CBVD), including stroke and carotid endarterectomy. ESRD was ascertained by self-report of a history of dialysis or renal transplantation. Blindness was ascertained by self-report of physician-diagnosed blindness and by visual acuity testing during either the 1994–1996 (1960s cohort) or the 2004–2006 (1970s cohort) examinations. Amputation was ascertained by self-report and/or physician examination. Complication status was assessed biennially, and each subcohort was followed for 8 years to ascertain MOD incidence status.
Clinical measurements
For the first 18 months of the study (May 1986 to November 1987), fasting blood samples were analyzed for HbA1 using microcolumn cation exchange (Isolab, Akron, OH). For the remainder of the baseline examinations, automated high-performance liquid chromatography (Diamat; Bio-Rad, Hercules, CA) was performed. Correlation between the two assays was very high (r = 0.95; Diamat HbA1 = –0.18 + 1.00[Isolab HbA1]). HbA1 values were converted to DCCT-aligned values for all analyses using a regression equation derived from duplicate assays (DCCT HbA1c = 0.14 + 0.83[EDC HbA1]). Three seated blood pressure readings were taken with a random-zero sphygmomanometer, and the mean of the second and third readings was used in analyses, according to the hypertension detection and follow-up protocol (21). Hypertension was defined as blood pressure at least 140/90 mmHg or use of antihypertensive medication. Alternate analyses were also performed using a cut point of 130/80 mmHg. Serum total cholesterol and triglycerides were determined enzymatically (22,23), and HDL cholesterol was determined using a modified precipitation technique (24) based on the lipid research clinics method (25). Eight-hour fasting LDL cholesterol levels were calculated from measurements of total cholesterol, triglycerides, and HDL cholesterol using the Friedewald equation (26). Hypercholesterolemia was defined as LDL cholesterol of ≥130 mg/dL or cholesterol medication use. Alternate analyses were performed using a cut point of ≥100 mg/dL. Microalbuminuria (or worse) was determined as an albumin excretion rate of ≥20 μg/min in two out of three timed urine samples (24-h, overnight, and 4-h collections collected over a 2-week period). Alternate analyses were performed with microalbuminuria defined as above plus use of ACE inhibitors. Urinary albumin was measured by immunonephelometry (27). Participants were weighed in light clothing on a balance beam scale. Height was measured using a wall-mounted stadiometer. BMI was calculated as the weight in kilograms divided by the square of the height in meters. Current and ever smoker status was obtained by self-report.
Statistical analysis
Baseline characteristics were compared between MOD incident cases and noncases for each subcohort using Student t test and χ2 test for binary variables.
To assess the impact of risk factors on MOD incidence, prevalent cases of MOD were excluded at baseline, and the 8-year incidence of the first occurrence of MOD by risk factor status was estimated using Weibull accelerated failure-time models, separately for each subcohort. All models were adjusted for diabetes duration. The risk factors of interest, specifically, HbA1c, hypertension, microalbuminuria (or worse), hypercholesterolemia, and both a history of smoking and current smoking status, were assessed using the acceleration factor k, which measures the impact of the presence relative to the absence of a factor in either accelerating or slowing the rate of incidence. The interpretation of k is as follows: k = 1, the factor has no impact on incidence; k >1, the factor is associated with an accelerated incidence; and k <1, the factor is associated with a decelerated incidence. To calculate its acceleration factor, HbA1c was dichotomized at the median, which was 8.4% (68 mmol/mol) at baseline in both subcohorts. Analyses of HbA1c were also performed using 8% (64 mmol/mol) and 9% (75 mmol/mol) as alternative cut points.
To determine the impact of risk factors on the temporal incidence of MOD, data from the two subcohorts were pooled. Cox proportional hazards models, which included a subcohort indicator variable as a predictor of MOD, were then examined to assess the impact of different risk factors on the subcohort variable’s regression coefficient and hazard ratio (HR). Statistical significance was defined as P < 0.05. SAS version 9.3 (SAS Institute, Cary, NC) was used for all analyses.
RESULTS
At baseline, the prevalence of any MOD was 15.9% in the 1960s cohort and declined insignificantly to 13.0% in the 1970s cohort (P = 0.35). The prevalence of each component of MOD at baseline generally declined, with the exception of CAD, which remained the same (1960s, 2.9% vs. 1970s, 2.9%; P = 0.98), and amputation, which increased slightly (1960s, 1.7% vs. 1970s, 2.5%; P = 0.50). No differences in prevalence between the 1960s and 1970s cohorts reached statistical significance. Blindness was the most common prevalent complication in both cohorts (1960s, 10.9% vs. 1970s, 7.6%; P = 0.19), whereas CBVD was the most rare (0.8 vs. 0.4%, respectively, P = 0.60). Prevalence of ESRD in the 1970s cohort (2.5%) was less than half that seen in the 1960s cohort (5.4%) (P = 0.09).
After excluding all prevalent cases of MOD at baseline, the estimated 8-year incidence of any MOD was 22.6% (95% CI 17.0–29.1) in the 1960s cohort, and 15.8% (11.6–21.4) in the 1970s cohort (P = 0.06). The change in the 8-year incidence of individual MOD types is shown in Fig. 1. The most significant declines were seen in diabetes-related death (13 vs. 7%, P = 0.02), CAD (12 vs. 5%, P = 0.005), and ESRD (12 vs. 4%, P < 0.0001) from the 1960s to the 1970s cohort. The incidence of CBVD, although low, also decreased (3 vs. 0.7%, P = 0.09), whereas blindness declined only slightly (7 vs. 5%, P = 0.42), and the low incidence of amputation remained the same (1 vs. 1%, P = 0.99).
Figure 1.

Change in 8-year incidence of specific MOD by diagnosis cohort. T1D, type 1 diabetes.
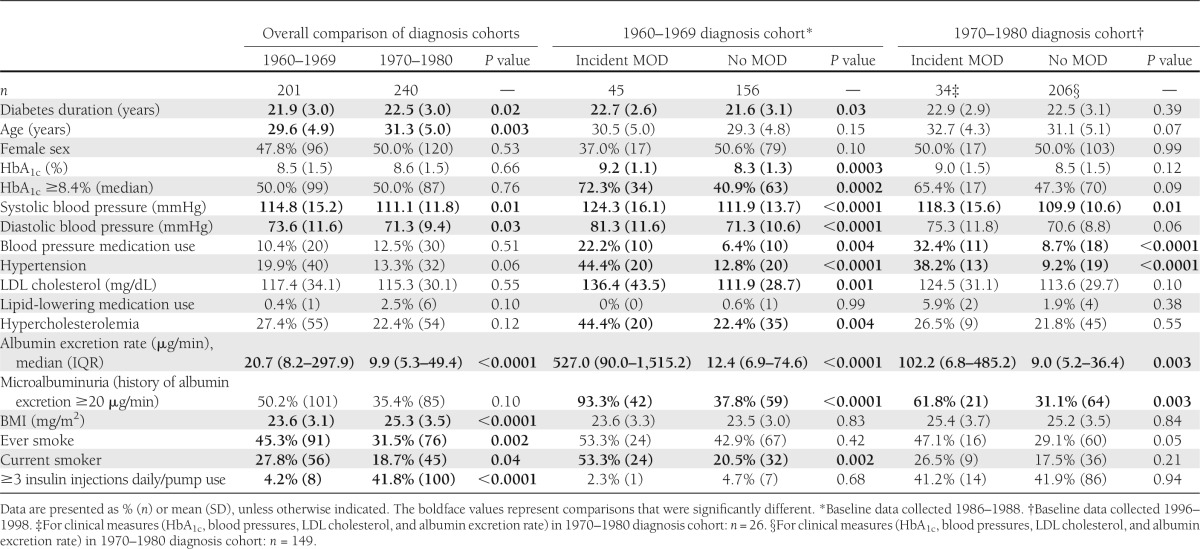
The baseline characteristics of the two cohorts after excluding prevalent cases of MOD are shown in Table 1. Diabetes duration, HbA1c, systolic and diastolic blood pressure, LDL cholesterol level, albumin excretion rate, current smoking status, the proportion with HbA1c greater than the median, hypertension, hypercholesterolemia, microalbuminuria, and the proportion using blood pressure–lowering medications at baseline were all significantly higher (P < 0.05) in those with incident MOD in the 1960s cohort. However, in the 1970s, only systolic blood pressure, blood pressure–lowering medication use, hypertension, albumin excretion rate, and proportion with microalbuminuria were significantly higher (P < 0.05) in those with incident MOD. Because we only have one HbA1c measurement in the 1970s cohort after baseline (i.e., at the 8-year follow-up examination), and this is only available for survivors and those able to attend that clinical examination, we cannot fully examine change in risk factors. Mean HbA1c remained fairly stable in the 1960s cohort, being 8.5% (69 mmol/mol) at baseline and 8.6% (70 mmol/mol) at the 8-year follow-up, whereas in the 1970s cohort, mean HbA1c decreased from 8.6% (70 mmol/mol) at baseline to 8.2% (66 mmol/mol) at 8 years.
Table 1.
Baseline characteristics by incidence status of MOD by diabetes diagnosis cohort in participants free of complication at baseline
In the 1960s cohort, the estimated 8-year incidence of MOD was 49.2% in those with hypertension at baseline and 16.5% in those without (Table 2), yielding a significant acceleration factor of 4.5 (P = 0.0002). The 1970s cohort showed a similar difference in 8-year MOD incidence by baseline hypertension (42.8 vs. 11.8%), and acceleration factor of 4.2 (P = 0.001) (Table 3). Three subgroups of those with hypertension were examined separately: BP ≥140/90 and untreated, ≥140/90 despite treatment with medication, or <140/90 on treatment with medication (Supplementary Table 1). The group with successfully controlled hypertension accounted for 84% of the 32 participants with hypertension in the 1970s cohort, but nonetheless showed a significantly higher risk of MOD than those without hypertension (P = 0.001). The numbers were too small to obtain reliable comparisons in the other hypertension groups. When these analyses were repeating using a lower definition of hypertension (130/80 mmHg or medication), hypertension remained significantly predictive of MOD in both the 1960s and 1970s cohorts. Additionally, microalbuminuria was associated with accelerated MOD incidence in both cohorts, although to a greater degree in the 1960s cohort (k = 13.2, P < 0.0001 vs. 1970s, k = 3.0, P = 0.008), and these results did not differ when using an alternate definition of microalbuminuria that included the use of ACE inhibitors. Whereas hypertension and microalbuminuria were the only factors to predict MOD incidence in the 1970s cohort (Table 2), hypercholesterolemia (k = 2.5, P = 0.01), HbA1c ≥8.4% (68 mmol/mol, median) (k = 4.7, P = 0.0005), and current smoking status at baseline (k = 3.1, P = 0.003) were all significantly predictive of MOD incidence in the 1960s cohort (Table 2). In alternate analyses, HbA1c ≥8% (64 mmol/mol) showed similar results to the 8.4% cut point, being predictive only in the 1960s (k = 4.2, P = 0.003 vs. 1970s, k = 1.7, P = 0.20), as was HbA1c ≥9% (75 mmol/mol) (k = 4.7, P = 0.0005 vs. 1970s, k = 1.1, P = 0.74). Using the alternate hypercholesterolemia cut point of LDL cholesterol ≥100 mg/dL also showed similar results to those above and was predictive of MOD only in the 1960s cohort. BMI was not associated with MOD incidence in either cohort.
Table 2.
Effect of modifiable risk factor status on estimated 8-year incidence of the first MOD by type 1 diabetes diagnosis cohort, adjusted for diabetes duration
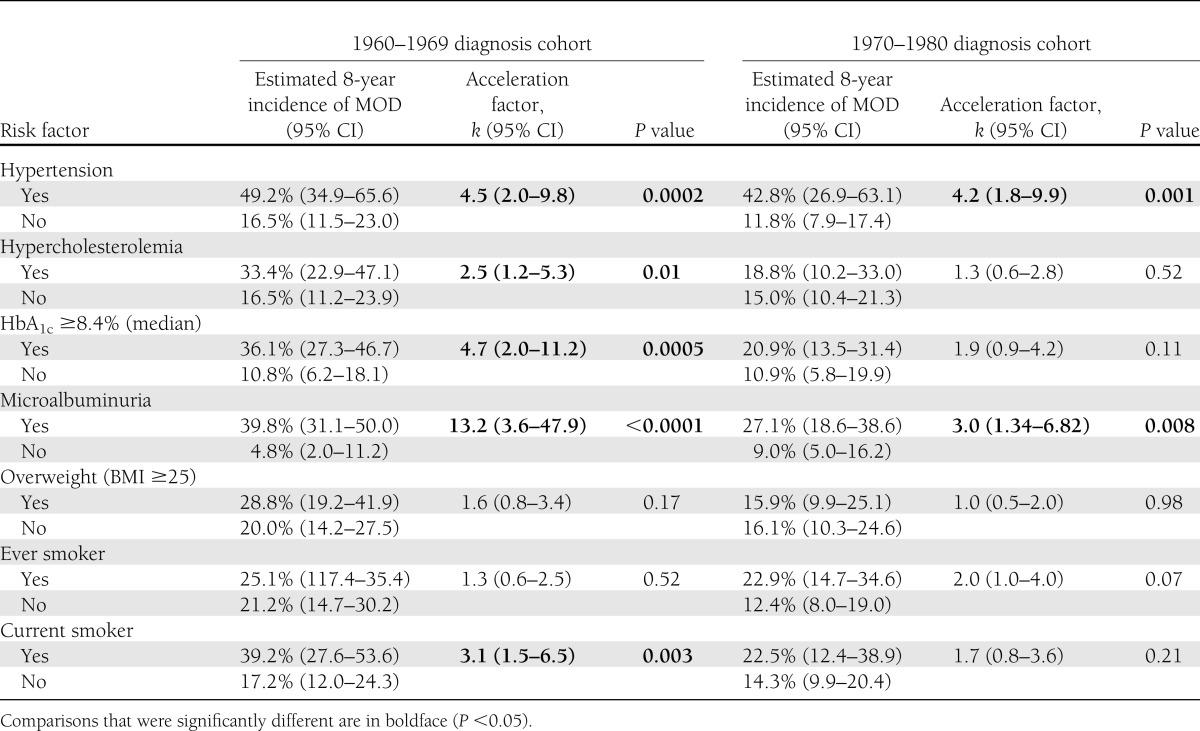
Table 3.
HR of a MOD associated with type 1 diabetes diagnosis cohort
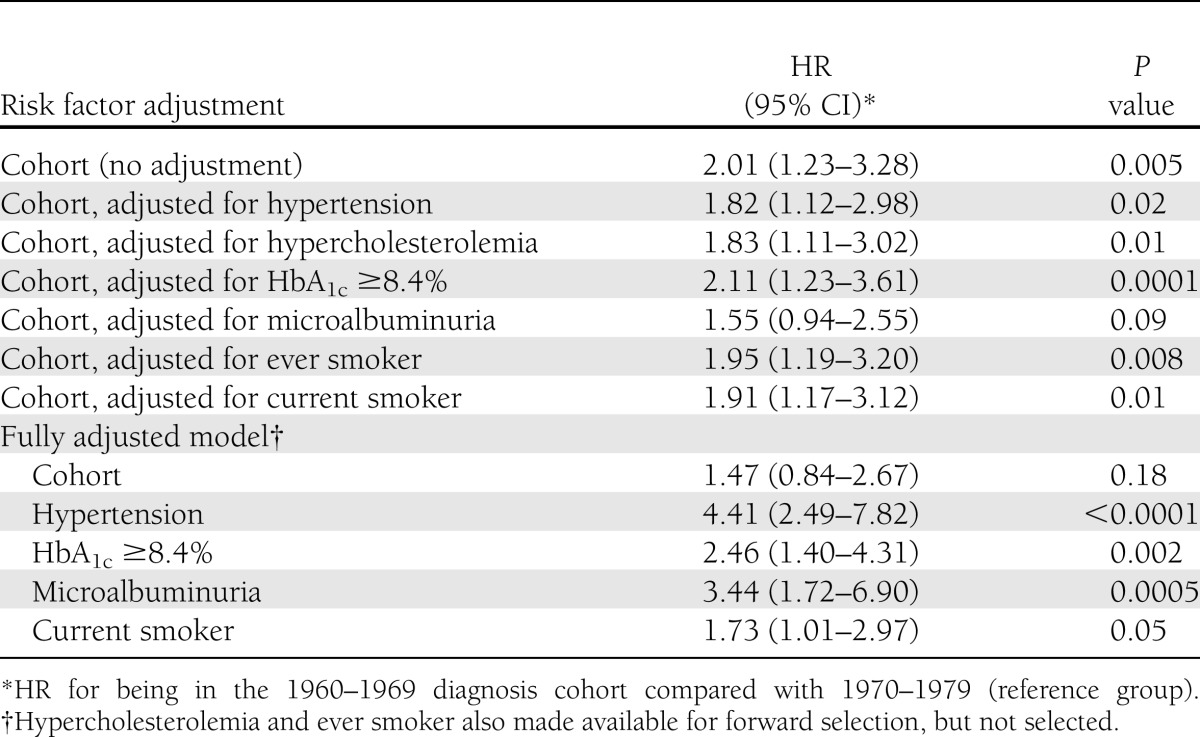
In a univariate Cox proportional hazards model assessing the relationship between cohort membership and MOD incidence, individuals in the 1960s cohort were twice as likely to develop a MOD event during the 8-year follow-up compared with the 1970s cohort (HR 2.01 [95% CI 1.23–3.28], P = 0.005). Adjusting for each of the risk factors of interest separately (hypertension, hypercholesterolemia, HbA1c greater than or equal to the median, and ever and current smoking status) showed little effect on the increased hazard of the 1960s cohort (Table 3). However, adjusting for microalbuminuria status attenuated the cohort effect so that it was no longer statistically significant (P = 0.09). In a final multivariable model that allowed for all of the risk factors and included hypertension, HbA1c greater than or equal to the median, microalbuminuria, and current smoking after forward selection, the cohort effect was also attenuated (1960s cohort HR 1.47, P = 0.18).
CONCLUSIONS
The results of our study suggest that the impact of glycemia, cholesterol, and smoking on the development of MOD was lower in those diagnosed with type 1 diabetes in the 1970s compared with those diagnosed in the 1960s. However, hypertension showed no change in its impact, accelerating the incidence of a MOD to a similar degree in both cohorts. The persistence of hypertension as a strong predictor of MOD is in spite of the fact that treatment of hypertension increased dramatically, from 50% in the 1960s cohort to >90% in the 1970s cohort. Additionally, whereas BMI was higher in the 1970s compared with the 1960s cohort, it was not associated with the incidence of MOD in either. Finally, microalbuminuria was a significant factor in accelerating the incidence of MOD in both diagnosis cohorts, although to a much greater degree in the 1960s cohort compared with the 1970s. Furthermore, only microalbuminuria appears to account for much of the cohort effect on MOD incidence.
It is important to note that the two cohorts analyzed here both had median HbA1c levels of 8.4% at their respective baselines, suggesting that control had not significantly improved. However, as we have previously reported, there has been a decrease in the HbA1c in the total EDC cohort, particularly since 1996–1998 (28). The equivalent HbA1c in the two cohorts presented here thus likely reflects the exclusion of prevalent MOD case subjects who were greater in number in the 1960s cohort and in worse control. Unfortunately, we do not have sufficient follow-up data to effectively assess the impact of change in glycemia throughout follow-up as the 1970s cohort had only one subsequent exam (8 years postbaseline), although as mean HbA1c at 8 years follow-up decreased in the 1970s cohort but remained nearly unchanged in the 1960s, it is likely that HbA1c improved over follow-up to a greater extent in the 1970s cohort.
Although the prevalence of any MOD at a mean diabetes duration of 22 years decreased only nonsignificantly from the 1960s cohort to the 1970s, by 18%, after excluding prevalent MOD cases, a much larger proportion of the 1960s diagnosis cohort experienced an incident MOD than the 1970s cohort. The most marked differences were seen in death, CAD, CBVD, and ESRD incidence, whereas the 8-year incidence of blindness was only slightly lower in the 1970s cohort and incidence of amputation was ∼1% in both cohorts.
A number of issues merit further discussion, the first being the failure of amputations and blindness to decline, as have other complications. Although numbers of amputations are small, their failure to decline does not seem to be the result of an increased trend to minor (e.g., toe) amputations, as might be expected. It should also be noted that for both cohorts, the prevalence is lower than the 25-year cumulative incidence of 10.1% observed in the Wisconsin Epidemiologic Study of Diabetic Retinopathy (WESDR) from 1979–1980 to 2004–2005 (29). The lack of a decline in the incidence of blindness might reflect improved ascertainment. This, however, seems unlikely, as virtually all cases were ascertained using the same method in both cohorts (3% by visual acuity measurement and the remainder through self-report of physician-diagnosed blindness). These results are also consistent with data on blindness in diabetes from the 1980–1996 data from the WESDR (30) and the 1965–1979 data from the Danish Hvidore Hospital cohort (31), neither of which demonstrated a significant decline in the incidence of blindness over time. The WESDR investigators more recently examined change in the prevalence of visual impairment by diagnosis period 1922–1979 and concluded that for any visual impairment (visual acuity ≤20/40 in the better eye), the prevalence was significantly lower in the more recent diagnosis periods (32); however, this was a milder degree of impairment than in our current analysis. The 25-year cumulative incidence of blindness in the WESDR cohort of comparable diabetes duration at baseline was ∼6% (33), which is somewhat lower than the 9% observed when our two subcohorts are combined. Additionally, a significant decrease in the incidence of blindness has been observed in the Japanese cohort from the Diabetes Epidemiology Research International study when comparing the 1965–1969 and 1975–1979 diagnosis cohorts (34).
The analysis of risk factors of major clinical concern (Table 2) raise considerable potential implications, suggesting that a greater focus is needed for blood pressure control, as it remains a major predictor even though blood pressure levels have fallen in the more recent cohort (Table 2). We primarily used the cut point of 140/90 mmHg, as this was the goal for most of the follow-up period. When the data were reanalyzed using a cut point of 130/80 mmHg, hypertension remained a significant predictor of MOD in both cohorts, but its effect was somewhat stronger in the 1960s and slightly attenuated in the 1970s. This persistence of hypertension as a risk factor at either level implies that although blood pressure levels are lower and blood pressure medication use higher in the 1970s cohort, these improvements are not eliminating the prior damage of higher blood pressure, or that the medications themselves are not without risk or are not lowering blood pressure enough, or that other derangements associated with higher blood pressure are not being addressed. In the current study, we observe that although the vast majority of participants with hypertension in the 1970s cohort have blood pressure levels that are controlled to <140/90, only ∼34% of those with hypertension are controlled to <130/80 (Supplementary Tables 1 and 2), thus suggesting that lower levels may be beneficial in type 1 diabetes. The complexity of these issues and the importance of their resolution are underscored given the surprising results from the blood pressure arm of the ACCORD trial in type 2 diabetes, which failed to show benefit (in terms of CVD risk and mortality) from a more aggressive blood pressure control protocol (35). Similarly, a recent review and meta-analysis of clinical trials in type 2 diabetes found that intensive blood pressure control is not associated with decreased risk for mortality or myocardial infarction but was associated with decreased risk of stroke (36). Finally, from a CAD and renal disease viewpoint, another recent review and meta-analysis found no consistent benefit for lowering blood pressure <130/80 mmHg (37). Unfortunately, there are no relevant blood pressure control trials focused on type 1 diabetic subjects to determine specific target goal levels. Further highlighting this issue, the American Diabetes Association recently issued new clinical practice recommendations, which included a higher systolic blood pressure goal of <140 mmHg, with the diastolic blood pressure goal remaining at <80 mmHg, based on information from the aforementioned clinical trials of type 2 diabetes (38). This important issue of appropriate blood pressure goals for type 1 diabetes thus requires a relevant clinical trial, which should be a high priority.
Another interesting result is that, like hypertension, microalbuminuria is still predictive in the 1970s cohort, but markedly less so than in it was the 1960s cohort. This effect may partially be explained by the observation that despite the decrease in the continuous values of albumin excretion rate from the 1960s to 1970s, many in the 1970s cohort still meet the definition of microalbuminuria. Thus, the microalbuminuria in the 1970s cohort is, on average, milder than that of the 1960s cohort. These findings also underscore the importance of microalbuminuria as a predictor of adverse outcome and are consistent with our recent confirmation over a 20-year follow-up period that micro- (or greater) albuminuria fully accounts for the excess mortality in type 1 diabetes (9), as was first shown in the Finnish Diabetic Nephropathy (FinnDiane) Study (14).
Another finding of interest is the observation that a history of ever smoking does not predict MOD in the 1960s cohort, where rates are high in both smokers (25%) and nonsmokers (22%). However, in the 1970s, rates remain similar in the smokers (23%) but have halved in the nonsmokers (12%), revealing a borderline risk factor (P = 0.07). The lack of a smoking effect seen in some diabetes studies may reflect a minimal impact of the formation of advanced glycation end products (one putative pathway for damage in smokers) in those with poor glycemic control (as here in the 1960s), when cumulative excess advanced glycation end product formation may be higher; thus, the added effect of smoking is small. In contrast, in the 1970s cohort, when glycemic control improves, this added risk factor emerges. Interestingly, the impact of current smoking shows a different pattern, being a major predictor in the 1960s cohort, but not in the 1970s.
Another major observation of interest is that high HbA1c (>8.4%, 68 mmol/mol) in the 1970s cohort is not associated with an increased risk of MOD, whereas the same cut point in the 1960s cohort increases risk significantly. However, there still is an almost twofold difference in MOD rates by HbA1c status in the 1970s cohort (21 vs. 11%), albeit not as great as in the 1960s (36 vs. 11%). Also, HbA1c levels decreased during the 8-year follow-up in the 1970s cohort but did not change in the 1960s cohort; thus, baseline values are more representative of follow-up values in the 1960s cohort than the 1970s. More extensive analysis of the impact of change in HbA1c was not possible here, as the numbers of participants with repeated HbA1c measures at 8 years of follow-up were small and biased because of mortality. Nevertheless, these data are consistent with our previous observation that long-term change in HbA1c may be a better predictor of cardiovascular events than baseline, or even mean, HbA1c (39). Finally, it is possible that better blood pressure and lipid management in the later period of the 1970s cohort follow-up helps to ameliorate the damage of poor glycemic control per se.
Our study has many strengths, including its prospective design and wide range of diabetes diagnosis years, which allowed us to compare the two cohorts. Additionally, deaths and cardiovascular events were verified using death certificates and medical records by reviewers who were masked to risk factor status. The main limitation is the potential for a “survivor bias,” because prevalent cases of MOD were excluded from incident risk factor analysis. This exclusion means that we have not been able to assess the impact of risk factors in the earliest, higher-risk cases, which predominate in the earlier 1960s cohort. This exclusion may also minimize the impact of baseline HbA1c in the 1970s cohort, as discussed above. Although we have standardized the two cohorts in terms of duration of diabetes, we are not able to fully account for exposure to various risk factors over time, which is likely to differ between the two cohorts (e.g., changes in clinical practice, introduction of medications, etc.). Despite these limitations, the original objective, to examine risk factors in the setting of improved control, is still addressable with this data set.
In conclusion, the incidence of MOD decreased in people diagnosed during 1970–1980 compared with those diagnosed during 1960–1969, with the exceptions of amputation and blindness. A decline in microalbuminuria appears to explain much of this improvement. Additionally, whereas the impact of hyperglycemia and hypercholesterolemia on the development of major complications appears to have been reduced, most likely reflecting improved control, the impact of hypertension remains an important predictor of complications, raising the need for further research to determine appropriate blood pressure goals and management.
Acknowledgments
This work was supported by National Institutes of Health Grant R01-DK-034818.
No potential conflicts of interest relevant to this article were reported.
R.G.M. conceived and designed the study, acquired data, analyzed and interpreted data, drafted the manuscript, critically reviewed the manuscript for important intellectual content, performed statistical analysis, and provided administrative, technical, or material support. A.M.S. conceived and designed the study, acquired data, analyzed and interpreted data, critically reviewed the manuscript for important intellectual content, and provided administrative, technical, or material support. D.E. and D.J.B. conceived and designed the study, analyzed and interpreted data, critically reviewed the manuscript for important intellectual content, and provided administrative, technical, or material support. T.J.O. conceived and designed the study; analyzed and interpreted data; critically reviewed the manuscript for important intellectual content; obtained funding; performed administrative, technical, or material support; and supervised the study. T.J.O. is the guarantor of this work and, as such, had full access to all the data in the study and takes responsibility for the integrity of the data and the accuracy of the data analysis.
An abstract of preliminary results was presented at the 70th Scientific Sessions of the American Diabetes Association, Orlando, Florida, 25–29 June 2010.
The authors thank the EDC Study participants for their long-term help.
Footnotes
This article contains Supplementary Data online at http://care.diabetesjournals.org/lookup/suppl/doi:10.2337/dc13-1142/-/DC1.
References
- 1.The Diabetes Control and Complications Trial Research Group The effect of intensive treatment of diabetes on the development and progression of long-term complications in insulin-dependent diabetes mellitus. N Engl J Med 1993;329:977–986 [DOI] [PubMed] [Google Scholar]
- 2.Nathan DM, Cleary PA, Backlund J-YC, et al. Diabetes Control and Complications Trial/Epidemiology of Diabetes Interventions and Complications (DCCT/EDIC) Study Research Group Intensive diabetes treatment and cardiovascular disease in patients with type 1 diabetes. N Engl J Med 2005;353:2643–2653 [DOI] [PMC free article] [PubMed] [Google Scholar]
- 3.Pambianco G, Costacou T, Ellis D, Becker DJ, Klein R, Orchard TJ. The 30-year natural history of type 1 diabetes complications: the Pittsburgh Epidemiology of Diabetes Complications Study experience. Diabetes 2006;55:1463–1469 [DOI] [PubMed] [Google Scholar]
- 4.Maser RE, Wolfson SK, Jr, Ellis D, et al. Cardiovascular disease and arterial calcification in insulin-dependent diabetes mellitus: interrelations and risk factor profiles. Pittsburgh Epidemiology of Diabetes Complications Study-V. Arterioscler Thromb 1991;11:958–965 [DOI] [PubMed] [Google Scholar]
- 5.Coonrod BA, Ellis D, Becker DJ, et al. Pittsburgh Epidemiology of Diabetes Complications Study Predictors of microalbuminuria in individuals with IDDM. Diabetes Care 1993;16:1376–1383 [DOI] [PubMed] [Google Scholar]
- 6.Lloyd CE, Becker D, Ellis D, Orchard TJ. Incidence of complications in insulin-dependent diabetes mellitus: a survival analysis. Am J Epidemiol 1996;143:431–441 [DOI] [PubMed] [Google Scholar]
- 7.Lloyd CE, Kuller LH, Ellis D, Becker DJ, Wing RR, Orchard TJ. Coronary artery disease in IDDM. Gender differences in risk factors but not risk. Arterioscler Thromb Vasc Biol 1996;16:720–726 [DOI] [PubMed] [Google Scholar]
- 8.Orchard TJ, Olson JC, Erbey JR, et al. Insulin resistance-related factors, but not glycemia, predict coronary artery disease in type 1 diabetes: 10-year follow-up data from the Pittsburgh Epidemiology of Diabetes Complications Study. Diabetes Care 2003;26:1374–1379 [DOI] [PubMed] [Google Scholar]
- 9.Orchard TJ, Secrest AM, Miller RG, Costacou T. In the absence of renal disease, 20 year mortality risk in type 1 diabetes is comparable to that of the general population: a report from the Pittsburgh Epidemiology of Diabetes Complications Study. Diabetologia 2010;53:2312–2319 [DOI] [PMC free article] [PubMed] [Google Scholar]
- 10.Secrest AM, Prince CT, Costacou T, Miller RG, Orchard TJ. Predictors of and survival after incident stroke in type 1 diabetes. Diab Vasc Dis Res 2013;10:3–10 [DOI] [PMC free article] [PubMed] [Google Scholar]
- 11.The Diabetes Control and Complications Trial/Epidemiology of Diabetes Interventions and Complications Research Group Retinopathy and nephropathy in patients with type 1 diabetes four years after a trial of intensive therapy. N Engl J Med 2000;342:381–389 [DOI] [PMC free article] [PubMed] [Google Scholar]
- 12.Klein R, Knudtson MD, Lee KE, Gangnon R, Klein BEK. The Wisconsin Epidemiologic Study of Diabetic Retinopathy: XXII the twenty-five-year progression of retinopathy in persons with type 1 diabetes. Ophthalmology 2008;115:1859–1868 [DOI] [PMC free article] [PubMed] [Google Scholar]
- 13.Soedamah-Muthu SS, Chaturvedi N, Witte DR, Stevens LK, Porta M, Fuller JH, EURODIAB Prospective Complications Study Group Relationship between risk factors and mortality in type 1 diabetic patients in Europe: the EURODIAB Prospective Complications Study (PCS). Diabetes Care 2008;31:1360–1366 [DOI] [PMC free article] [PubMed] [Google Scholar]
- 14.Groop P-H, Thomas MC, Moran JL, et al. FinnDiane Study Group The presence and severity of chronic kidney disease predicts all-cause mortality in type 1 diabetes. Diabetes 2009;58:1651–1658 [DOI] [PMC free article] [PubMed] [Google Scholar]
- 15.Hovind P, Tarnow L, Rossing P, et al. Predictors for the development of microalbuminuria and macroalbuminuria in patients with type 1 diabetes: inception cohort study. BMJ 2004;328:1105. [DOI] [PMC free article] [PubMed] [Google Scholar]
- 16.Krolewski AS, Kosinski EJ, Warram JH, et al. Magnitude and determinants of coronary artery disease in juvenile-onset, insulin-dependent diabetes mellitus. Am J Cardiol 1987;59:750–755 [DOI] [PubMed] [Google Scholar]
- 17.Skupien J, Warram JH, Smiles AM, et al. The early decline in renal function in patients with type 1 diabetes and proteinuria predicts the risk of end-stage renal disease. Kidney Int 2012;82:589–597 [DOI] [PMC free article] [PubMed] [Google Scholar]
- 18.Dabelea D, Kinney G, Snell-Bergeon JK, et al. Coronary Artery Calcification in Type 1 Diabetes Study Effect of type 1 diabetes on the gender difference in coronary artery calcification: a role for insulin resistance? The Coronary Artery Calcification in Type 1 Diabetes (CACTI) Study. Diabetes 2003;52:2833–2839 [DOI] [PubMed] [Google Scholar]
- 19.Pambianco G, Costacou T, Orchard TJ. The prediction of major outcomes of type 1 diabetes: a 12-year prospective evaluation of three separate definitions of the metabolic syndrome and their components and estimated glucose disposal rate: the Pittsburgh Epidemiology of Diabetes Complications Study experience. Diabetes Care 2007;30:1248–1254 [DOI] [PubMed] [Google Scholar]
- 20.International evaluation of cause-specific mortality and IDDM. Diabetes Epidemiology Research International Mortality Study Group. Diabetes Care 1991;14:55–60 [DOI] [PubMed] [Google Scholar]
- 21.Hypertension Detection and Follow-up Program Cooperative Group The hypertension detection and follow-up program: Hypertension detection and follow-up program cooperative group. Prev Med 1976;5:207–215 [DOI] [PubMed] [Google Scholar]
- 22.Bucolo G, David H. Quantitative determination of serum triglycerides by the use of enzymes. Clin Chem 1973;19:476–482 [PubMed] [Google Scholar]
- 23.Allain CC, Poon LS, Chan CSG, Richmond W, Fu PC. Enzymatic determination of total serum cholesterol. Clin Chem 1974;20:470–475 [PubMed] [Google Scholar]
- 24.Warnick GR, Albers JJ. Heparin—Mn2+ quantitation of high-density-lipoprotein cholesterol: an ultrafiltration procedure for lipemic samples. Clin Chem 1978;24:900–904 [PubMed] [Google Scholar]
- 25.Lipid Research Clinics Program. Lipid and liproprotein analysis. In Manual of Laboratory Operations Vol. 1. Washington, DC, National Institutes of Health, Department of Health, US Govt. Printing Office, 1974 [Google Scholar]
- 26.Friedewald WT, Levy RI, Fredrickson DS. Estimation of the concentration of low-density lipoprotein cholesterol in plasma, without use of the preparative ultracentrifuge. Clin Chem 1972;18:499–502 [PubMed] [Google Scholar]
- 27.Ellis D, Coonrod BA, Dorman JS, et al. Choice of urine sample predictive of microalbuminuria in patients with insulin-dependent diabetes mellitus. Am J Kidney Dis 1989;13:321–328 [DOI] [PubMed] [Google Scholar]
- 28.Nathan DM, Zinman B, Cleary PA, et al. Diabetes Control and Complications Trial/Epidemiology of Diabetes Interventions and Complications (DCCT/EDIC) Research Group Modern-day clinical course of type 1 diabetes mellitus after 30 years’ duration: the diabetes control and complications trial/epidemiology of diabetes interventions and complications and Pittsburgh epidemiology of diabetes complications experience (1983-2005). Arch Intern Med 2009;169:1307–1316 [DOI] [PMC free article] [PubMed] [Google Scholar]
- 29.Sahakyan K, Klein BEK, Lee KE, Myers CE, Klein R. The 25-year cumulative incidence of lower extremity amputations in people with type 1 diabetes. Diabetes Care 2011;34:649–651 [DOI] [PMC free article] [PubMed] [Google Scholar]
- 30.Moss SE, Klein R, Klein BE. The 14-year incidence of visual loss in a diabetic population. Ophthalmology 1998;105:998–1003 [DOI] [PubMed] [Google Scholar]
- 31.Rossing K, Jacobsen P, Rossing P, Lauritzen E, Lund-Andersen H, Parving HH. Improved visual function in IDDM patients with unchanged cumulative incidence of sight-threatening diabetic retinopathy. Diabetes Care 1998;21:2007–2015 [DOI] [PubMed] [Google Scholar]
- 32.Klein R, Lee KE, Knudtson MD, Gangnon RE, Klein BEK. Changes in visual impairment prevalence by period of diagnosis of diabetes: the Wisconsin Epidemiologic Study of Diabetic Retinopathy. Ophthalmology 2009;116:1937–1942 [DOI] [PMC free article] [PubMed] [Google Scholar]
- 33.Klein R, Lee KE, Gangnon RE, Klein BEK. The 25-year incidence of visual impairment in type 1 diabetes mellitus the wisconsin epidemiologic study of diabetic retinopathy. Ophthalmology 2010;117:63–70 [DOI] [PMC free article] [PubMed] [Google Scholar]
- 34.Sano H, Nishimura R, Asao K, et al. Diabetes Epidemiology Research International Study Group Blindness and laser photocoagulation in patients with childhood-onset type 1 diabetes in Japan. Br J Ophthalmol 2009;93:726–730 [DOI] [PubMed] [Google Scholar]
- 35.Cushman WC, Evans GW, Byington RP, et al. ACCORD Study Group Effects of intensive blood-pressure control in type 2 diabetes mellitus. N Engl J Med 2010;362:1575–1585 [DOI] [PMC free article] [PubMed] [Google Scholar]
- 36.McBrien K, Rabi DM, Campbell N, et al. Intensive and standard blood pressure targets in patients with type 2 diabetes mellitus: systematic review and meta-analysis. Arch Intern Med 2012;172:1296–1303 [DOI] [PubMed] [Google Scholar]
- 37.Lv J, Neal B, Ehteshami P, et al. Effects of intensive blood pressure lowering on cardiovascular and renal outcomes: a systematic review and meta-analysis. PLoS Med 2012;9:e1001293. [DOI] [PMC free article] [PubMed] [Google Scholar]
- 38.American Diabetes Association Standards of medical care in diabetes - 2013. Diabetes Care 2013;36(Suppl. 1):S11–S66 [DOI] [PMC free article] [PubMed] [Google Scholar]
- 39.Prince CT, Becker DJ, Costacou T, Miller RG, Orchard TJ. Changes in glycaemic control and risk of coronary artery disease in type 1 diabetes mellitus: findings from the Pittsburgh Epidemiology of Diabetes Complications Study (EDC). Diabetologia 2007;50:2280–2288 [DOI] [PubMed] [Google Scholar]