

Abstract
Although single gene loss of function analyses can identify components of particular processes, important molecules are missed due to the robustness of biological systems. Here we show that large scale RNAi screening for suppression interactions with functionally related mutants greatly expands the repertoire of genes known to act in a shared process and reveals a new layer of functional relationships. We performed RNAi screens for 17 C. elegans cell polarity mutants, generating the most comprehensive polarity network in a metazoan, connecting 184 genes. Of these, 72% were not previously linked to cell polarity and 80% have human homologs. We experimentally confirmed functional roles predicted by the network and characterised through biophysical analyses eight myosin regulators. In addition, we discovered functional redundancy between two unknown polarity genes. Similar systematic genetic interaction screens for other biological processes will help uncover the inventory of relevant genes and their patterns of interactions.
INTRODUCTION
A major challenge in the study of developmental processes is the identification of all of the relevant genes and their functional relationships. Single gene knockdown/knockout analyses have assigned gene functions on a large scale but due to functional redundancy the single gene approach cannot result in complete maps of developmental processes.
Genetic interaction screens have been extremely powerful for identifying genes whose products are functionally related in a direct or indirect manner 1-3. In yeast, a genome-scale screen for synthetic interactions led to the first functional map of a eukaryotic cell4. However, generating comprehensive genetic interaction maps for individual developmental processes in an animal remains extremely challenging. One major difficulty is that the core components of biological processes are usually essential genes, making screening for genetic interactions difficult. In C. elegans and yeast the use of hypomorphic temperature sensitive (ts) mutants can overcome this limitation4-7. We reasoned that applying RNAi genetic interaction screening to a collection of functionally related C. elegans ts mutants focused on one developmental process would be a powerful approach for generating more comprehensive functional maps. We present here a metazoan cell polarity network derived from this strategy.
Cell polarity is important for the functions of most animal cells and its deregulation is implicated in disease 8 . Polarisation is orchestrated by key conserved modules from worms to human, such as the PAR proteins, and involves regulation of both the actomyosin and microtubule (MT) cytoskeletons. The first cell division of C. elegans is asymmetric and is an important model system for cell polarity studies 9, 10. Polarity is induced by redundant mechanisms and is dependent on the sperm centrosome and microtubules 11-15. Consequently, during polarity establishment the cortical contractile actomyosin meshwork flows from posterior to anterior in a Rho dependent manner 16-18, leading to an anterior localization of PAR proteins PAR-3, PAR-6, and PKC-3/aPKC and posterior accumulation of PAR-1 and PAR-2 19-21. Subsequently, during polarity maintenance, anterior and posterior PAR proteins mutually antagonise each other, maintaining their asymmetric localisations 22. The PAR proteins control downstream events such as the differential distribution of cell fate determinants and the posterior displacement of the mitotic spindle, the latter being regulated by a receptor independent heterotrimeric G protein pathway 10.
Much of the above framework is derived from single loss of function studies including RNAi phenotypic screens that identified genes with roles during the first cell division 23-25. Despite these research efforts, the mechanisms of polarity induction and transduction are still unclear. The identification of missing genes and a wider network of interactions are required. Towards this goal, we have focused large-scale genetic suppressor screens on cell polarity, screening 2,745 genes by RNAi in 17 ts mutants of key cell polarity genes, generating a network of 184 genes. We demonstrate functional roles for novel genes and uncover functional redundancy in early cell polarity. This network should be widely applicable across animals given the conservation of both the identified suppressors and cell polarity mechanism. Our screening approach will be valuable for creating functional maps of other biological processes.
RESULTS
The cell polarity network
To generate a cell polarity genetic network, we first selected 17 temperature sensitive (ts) embryonic lethal mutants of 14 genes that function in one of three functional groups central to cell polarity: actomyosin regulation, PAR polarity, and spindle positioning/MT regulation (Table 1). Each mutant was screened for suppression interactions, defined as rescue of embryonic lethality by RNAi depletion of a second gene (Fig. 1). Genetic suppression generally occurs between genes with opposing functions in a shared process. To allow the throughput necessary for screening a large number of mutants, we used an RNAi library likely enriched for relevant genes. Most known polarity genes are essential and we observed a four-fold enrichment of interactions between essential genes in a genome-wide nmy-2(ts) suppressor screen (data not shown). Therefore, we screened an RNAi sub-library targeting genes previously shown to have roles in embryo or germline development (~15% of the genome, see Methods and Supplementary Table S1). When both genes are essential, mutual suppression likely requires partial knockdown of each gene, as full inhibition will usually lead to strong lethality. Therefore each temperature sensitive mutant was screened at a temperature where viability was around 1%, and each RNAi library clone was screened at three different strengths of RNAi knockdown (see Methods). We selected RNAi clones that have a reproducible suppressor activity and removed from our analysis genes likely to be non-specific suppressors that can rescue many ts mutants independently of their biological function (see Methods and Supplementary Fig. S1, Table S2, S3 and S4). Connecting the suppressor genes to their 14 ts mutant seeds, we generated a cell polarity network containing 184 genes (nodes) and 227 genetic interactions (Fig. 2, Supplementary Table S3).
Table 1.
17 ts polarity mutants screened in this study
| Functional groups | Gene | ts allele | Description |
|---|---|---|---|
| Actomyosin regulation |
act-2 | or621 | Actin |
| let-502 | sb118 | Rho Kinase/ROCK | |
| mel-11 | it26 | Myosin phosphatase | |
| nmy-2 |
ne3409
ne1490 |
Non muscle myosin heavy chain |
|
| PAR polarity |
par-1
par-2 |
zu310
it5 |
PAR-1/MARK kinase RING-finger protein |
| par-4 |
it57
it47 |
LKB1/STK11 serine- threonine kinase |
|
| pkc-3 |
ne4250
ne4246 |
Atypical protein kinase C | |
| Spindle positioning and MT regulation |
gpa-16
let-99 lin-5 ric-8 tbb-2 zyg-9 |
it143
or204 ev571 md303 qt1 b244 |
G protein alpha DEP domain protein NUMA related protein G alpha GEF/RIC8 Tubulin MT regulator MT regulator |
Figure 1. Suppressor genetic screen strategy.

Flow chart describing the screening strategy followed to identify suppressors of polarity mutants. See Supplementary Figure S1, Tables S1-S3.
Figure 2. Cell polarity genetic network.

Graphical network representation of 227 specific genetic interactions found between 184 genes. Coloured areas represent the three broad functional groups (Actomyosin regulation, blue; PAR polarity, green; Spindle positioning & MT regulation, red). Square nodes are the 14 ts polarity seeds screened and circular nodes are their suppressors. Lines represent the genetic interactions found and are coloured based on the mutant functional group. Thick lines represent interactions found between seeds. Suppressors linked to only one seed are positioned in the outskirts of the network. Suppressors linking more than one seed are generally positioned between them. Nodes are colour coded according to their functional class or sub-functional category. For representation purposes we only plotted genes from unique target RNAi clones. See Methods and Supplementary Table S3 and S4.
Network captures expected interactions
To validate the network, we asked whether we recovered known or expected interactions within each of the three functional groups. Myosin activity is tightly regulated by phosphorylation via the antagonistic activities of the myosin phosphatase mel-11 (negative regulator) and the Rho kinase let-502 (positive regulator) 26. We found that mel-11 and let-502 are mutual suppressors, consistent with published data 26 (Fig. 2, “PP1” box). As expected, RNAi of mel-11 also suppresses the myosin mutant nmy-2(ts) and nmy-2(RNAi) suppresses the dominant actin allele act-2(ts) 27. Strikingly genes coding for known actomyosin regulators (unc-45, mlc-5, wip-1), actin binding proteins (erm-1, pod-1), and many small GTPases (rga-3, arf-1.2, cdc-42, rab-7) also fall within the actomyosin regulation group (Fig. 2, “Actomyosin regulators” and “small GTPase & regulators” boxes)
An important aspect of polarity is the mutual antagonism between anterior and posterior PAR proteins 19, 20. Within the PAR polarity group, we found mutual suppression between all components of the anterior PAR complex and par-2 as previously observed 5, 20 (Fig. 2, “Anterior PARs”). PAR proteins also control the timing of asymmetric cell division through cell-cycle regulators polo kinase PLK-1 and CDC-25 28. We observed that RNAi of plk-1 or cdc-25 suppresses par-4(ts) (Fig. 2, “Other cell cycle regulators”). In mammals, LKB1/PAR-4 activity is regulated by binding to MO25 29. RNAi of the MO25 homolog mop-25.3 suppressed par-4(ts) (Fig. 2, “LKB1 complex”), suggesting a conserved functional link 30. Asymmetric localization of cell fate determinants MEX-5/6 depend on a phosphorylation event requiring PAR-1 and PAR-4 activity 31. Both par-1(ts) and par-4(ts) were rescued by mex-6(RNAi), supporting the view that PAR-1 and PAR-4 negatively regulate MEX-6. We also detected the recently described genetic link between the Ras-MAP kinase pathway and par-1 via mpk-1/MAPK and let-60/Ras32. Strengthening this link, we further found that knockdown of three other MAP kinase regulators suppresses par-1(ts): LST-1 33, ROG-1 34 and DAF-21 35 (Fig. 2, “MAP kinase & regulators”).
Forces positioning the spindle at the posterior involve a LIN-5, GPR-1/2, and Gα complex, together with dynein activity and the regulation of MT dynamics 10. Within the spindle positioning/MT regulation group, we observed that LIN-5 is suppressed by many RNAi knockdowns that lead to shorter MTs: zyg-9/ XMAP215, tac-1/TACC, γ-tubulin, prefoldins (involved in tubulin folding) and the CLASP cls-2 (Fig. 2, “Microtubule regulators” and “prefoldin” boxes). This suggests that LIN-5 might increase spindle pulling forces through increased MT plus-end depolymerisation. RIC-8 is a guanine nucleotide exchange factor that controls spindle pulling forces via G protein signalling 10. We found that ric-8(ts) is suppressed by RNAi of heterotrimeric G protein subunit genes gpa-16 (Gα), gpb-1 (Gβ), and gpc-2 (Gγ.) (Fig. 2, “Receptor independent G protein signalling” box). In addition, let-99(RNAi) suppressed the tbb-2(ts) gain of function mutant 36 (Fig. 2, “Microtubule regulators” box) supporting the proposal that the DEP domain protein LET-99 regulates MT dynamics 37.
The 26 genes connecting ts mutants from different functional groups are likely to integrate information between polarity processes. The small GTPase CDC-42 is a key conserved regulator of actin dynamics and functions with the anterior PAR complex 5. We find that cdc-42 connects the actomyosin and PAR polarity groups through act-2 and par-2 (Fig. 2, “Anterior PARs” box). The casein kinase I csnk-1 connects the actomyosin regulation and spindle-positioning groups (Fig. 2, “Casein Kinases” box). The excessive cortical activity and increased spindle pulling forces associated with csnk-1 loss of function are compatible with this pattern of interaction 38. Two highly connected genes are components of the multifunctional CCR4-NOT complex; ntl-2 connects all three groups and ntl-3 connects actomyosin regulation and PAR polarity groups (Fig. 2, “CCR4/NOT” box). The CCR4-NOT complex via its multi-enzymatic activities regulates gene expression at different levels, including transcriptional repression, mRNA decay, and protein ubiquitination 39. The core component of this complex (NTL-1) controls spindle positioning in C. elegans asymmetric first cell division by regulating ZYG-9 protein levels 40. The connectivity of ntl-2 and ntl-3 suggests that the CCR4-NOT complex might regulate the levels of multiple polarity regulators.
A new layer of functional interactions
To further evaluate the capacity of our network to identify relevant functional interactions, we focused on 37 well-characterised polarity genes with published data from “single gene” studies. We built a high confidence functional network containing 49 interactions between these 37 genes (Fig. 3a black lines, Supplementary Table S5) and used this network as a reference to evaluate the relevance of networks generated by our and other large-scale studies. Using published large-scale data derived from phenotypic profiling screens analysing the gonad structure and the embryonic first cell division, we obtained a network of 29 functional interactions for these 37 genes 25, 35 (Fig. 3b grey and blue lines respectively). In comparison, our suppressor screen found 21 interactions (Fig. 3b orange lines) out of which only three are in common with the phenotypic network, indicating that our suppressor screen is as informative as phenotypic screens to identify relevant functional relationships. Strikingly the global architecture of the 47 interactions obtained by combining these two large-scale data is similar to the 49 interactions of the “single gene” study polarity network. Together, the two large-scale datasets complement each other and identify many of the cell polarity interactions reported from “single gene” research. Adding the 160 suppressors reported here to the network of 37 known polarity genes greatly expands the collection of genes implicated in cell polarity (Fig. 3c). Importantly, 80% of the suppressors have a human homologue and 16% are completely uncharacterised (Supplementary Table S3).
Figure 3. Suppressor screen identifies a new layer of functional relationships.

(a) Network built from functional interactions found in “single gene” studies between 37 well-characterised polarity genes. Nodes are positioned according to their molecular function (left labels) and square seeds are the 14 ts polarity genes screened. (b) Network built for the same 37 polarity genes based on interactions inferred from large-scale studies. Suppression interactions (orange lines, this study) show a complementary pattern to phenotypic interactions found in phenotypic analysis of embryo first cell division (pink lines) 25 and gonad structure (dark grey lines) 35. (c) Network representing all the interactions found in this study. 138 suppressors are connected to a single mutant (yellow nodes) and 41 have more than one connection (black nodes). Note that 9 out of 14 polarity seeds were also found as suppressors. When required, the number of interaction found for a mutant is indicated. Genetic interactions are coloured as in Figure 2. See Supplementary Table S5
Prediction of gene function and signalling crosstalk
We observed that some polarity mutants are suppressed by a set of genes that act together in a common cellular process, strongly implicating a functional link between them. For example, in the spindle positioning/MT regulation group, RNAi of 9 APC subunits (apc-2, cdc-26, emb-27, emb-30, mat-1, mat-3, apc-11, emb-1, apc-17) suppressed lin-5(ts). To ask if other uncharacterised suppressors of lin-5(ts) could be regulators or unknown components of APC complex, we tested whether their knockdown enhanced lethality of the APC subunit mutant mat-3(ts). We found that F59E12.11 enhanced mat-3(ts) embryonic lethality and caused a meiotic arrest phenotype characteristic of APC loss of function (data not shown). Supporting our hypothesis that F59E12.11 could be an APC subunit or regulator, it has been recently reported that RNAi knockdown of F59E12.11 causes a gonad defect similar to that of a group of proteins enriched for APC components 35. F59E12.11 has an uncharacterised human homolog, LOH12CR1, which would be a promising candidate for future study.
Within the PAR polarity group, we found connections between two members of the protein kinase A (PKA) signalling pathway and pkc-3(ts): gsa-1 (Gαs), let-754 (adenylate kinase). Because the PKA signalling pathway has not been reported to regulate PKC-3 in early embryo development, we explored this connection by testing 13 predicted members of the PKA pathway not screened, including positive and negative regulators (Fig. 4a). Strengthening this connection, we found that RNAi of two positive regulators of PKA signalling, acy-3 and let-607 suppressed pkc-3(ts) whereas RNAi of two negative regulators, kin-2 and pde-1 enhanced pkc-3(ts) lethality. Knockdown of the Gα GEF ric-8, which genetically interacts with the PKA pathway during synaptic signalling 41 also enhanced pkc-3(ts) (Fig. 4). These results implicate a previously unknown negative crosstalk between the PKA signalling pathway and PKC-3 function.
Figure 4. PKA signalling antagonises PKC-3 function.
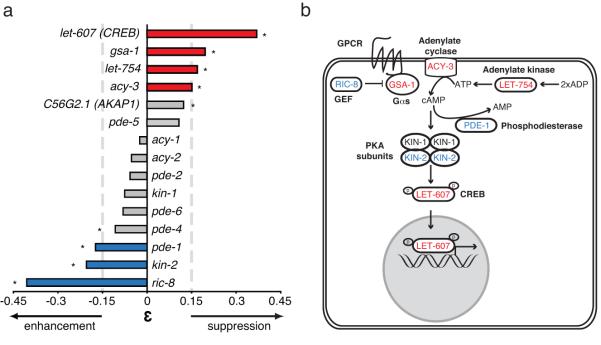
(a) Bar graph representing the strength of the genetic interactions between pkc-3(ts) and genes from the PKA signalling pathway. ε represent the deviation of the observed double-knock-down fitness from expectation. A strong interaction is considered when |ε̣|≤0.15(doted line) and Z-test p<0.001 (*). PKA signalling components (let-607, gsa-1, let-754, acy-3) suppress pkc-3(ts) mutant and PKA negative regulators (pde-1, kin-2 and ric-8) enhance pkc-3(ts) mutant. (b) Cellular schematic representation of PKA signalling pathway indicating in red the suppressors and in blue the enhancers of pkc-3(ts).
Interaction patterns identify polarity regulators
Most genes in the network do not have a clear polarity role based on data from phenotype profiling screens (Supplementary Table S3) 23-25, suggesting that their loss of function phenotype is subtle or that functional redundancy might mask their polarity role. We reasoned that genes directly relevant to particular polarity functions would show opposite patterns of suppression and enhancement in backgrounds with opposing effects on the process. For example, the anterior PAR complex and posterior PAR-2 maintain their distinct domains through negative regulatory interactions; RNAi of anterior PAR genes par-3 or cdc-42 suppresses lethality of the posterior PAR mutant par-2(ts)5 (Fig. 2, “Anterior PARs”) but enhances lethality of the anterior PAR mutant pkc-3(ts) (Fig. 5a).
Figure 5. Characterisation of new PAR protein regulators acting upstream and downstream of PARs.

(a) Bar graph representing the strength of the genetic interactions between par-2 suppressors in pkc-3(ts). A strong interaction is defined as in Figure 4. par-6 and pkc-3 RNAi induce strong embryonic lethality in wt preventing the detection of strong enhancement. (b) Table summarising polarity phenotypes observed in pkc-3(ts) after RNAi of strong enhancers. gld-1 RNAi induces sterility preventing is phenotypic characterisation. (c) Midsection of two cell stage pkc-3(ts) embryos stained for PAR-2 (left images) and fluorescent images of two-cell stage embryos stained for the cell fate determinant MEX-5 (right images). Control images of pkc-3(ts) embryos at the permissive temperature (top row). Representative defective phenotypes observed after RNAi of pkc-3(ts) enhancers (bottom row). Scale bar: 10μm. See Supplementary Fig. S2.
Using this strategy, we found that RNAi of five new par-2 suppressors enhanced lethality of pkc-3(ts) (Fig. 5a). We next tested whether the candidates showing par-2 suppression and pkc-3 enhancement have polarity roles. To sensitively identify defects, we carried out assays in the pkc-3(ts) background at permissive temperature, where defects are negligible, quantifying PAR-2 localisation, cell size asymmetry and the distribution of the cell fate determinant MEX-5. We found that RNAi of bath-44 affects cell size asymmetry and that Y65B4BR.5 and F22B3.4 affect all three aspects of polarity assayed (Fig. 5b,c and Supplementary Fig. S2). These results suggest that Y65B4BR.5 and F22B3.4 likely act upstream of PAR protein localisation whereas bath-44 functions downstream or in parallel to the PAR proteins. Homologs of these proteins are involved in protein folding (Y65B4BR.5/NACA), post-translational protein modification (F22B3.4/GFPT1) or protein degradation (BATH-44/SPOP) suggesting potentially complex regulation of PAR protein activity (Supplementary Fig. S3a).
To identify new actomyosin regulators we selected two mutants with opposite phenotypes: the nmy-2 loss of function mutant leads to a loss of contractile activity 42, whereas the dominant allele of the actin gene act-2 increases contractile activity dependent on myosin function 27. Similar to the above analysis, we screened for RNAi suppressors of nmy-2(ts) that enhanced lethality of act-2(ts) and vice versa. We found that 13 RNAi suppressors of act-2(ts) strongly enhanced the lethality of nmy-2(ts) (Fig. 6a), and 12 RNAi suppressors of nmy-2(ts) enhanced the lethality of act-2(ts) (Fig. 6b). Notably, of these 25 actomyosin “suppressor/enhancer” genes, four are known regulators of myosin function (cdc-42, unc-45, nmy-2 and mlc-5) and four others have been shown to affect cortical dynamics (rga-3, csnk-1, ntl-3 and pod-1) suggesting that the remaining 17 genes are excellent candidates for regulating actomyosin function.
Figure 6. Biophysical characterisation of new actomyosin regulators.

(a,b) Bar graph representing the strength of the genetic interactions between act-2 suppressors in nmy-2(ts) and nmy-2 suppressors in act-2(ts) respectively. A strong interaction is defined as in Figure 4. For this analysis we also included RNAi clones targeting multiple genes, which are not considered in Figure 2. (c) New polarity candidates affect actomyosin functions important for anterior flow physical properties or cortical structure during polarity establishment. From left to right: map representing the magnitude velocity of NMY2::GFP along the anterior-posterior (AP) axis at 30% retraction for each gene knockdown; graphs representing respectively the average magnitude velocity in the whole embryo, the range of flow and the coefficient of variation (Cv) of myosin intensity, measured for all RNAi conditions. In all graphs, genes marked in red represent a significant increase and genes in blue a significant decrease (Welch t-test at 95% confidence). Error bars indicate standard error of the mean. Circles represent wt and known regulators, squares nmy-2 enhancers, triangles act-2 enhancers. See Supplementary Fig. S4 and S5.
Biophysical analyses confirm new myosin regulators
Prior to polarity induction, the actomyosin cytoskeleton is organised in a dynamic meshwork of large interconnected foci all around the cortex. During polarity establishment, myosin foci move towards the anterior inducing a cortical flow that is dependent on the gradient of myosin contractility and the cortical viscosity 43. To sensitively assess the involvement of act-2 and nmy-2 suppressors in actomyosin dynamics, we performed live imaging of NMY-2::GFP (Movies S1) and measured three parameters that reflect myosin activity, cortex viscosity, and myosin cortical distribution. First, to quantify myosin activity we measured NMY-2 cortical flow velocity at 30% retraction. Second, as a proxy of cortical viscosity we determined the range of flow (derived from the myosin localization profile and cortical flow velocity) 43. Third, to evaluate myosin cortical distribution we calculated the coefficient of variation (cv) of myosin intensity at the onset of flow (high if NMY-2 is restricted to foci and low if NMY-2 is homogeneously distributed).
To determine the sensitivity of these three parameters for identifying actomyosin regulators, we measured them in wild type and after RNAi of five known actomyosin regulators (cdc-42, csnk-1, mlc-5, rga-3, unc-45). For each of these five genes, at least one of the parameters was significantly altered (Fig. 6c, Supplementary Fig. S4, S5 and Movies S2 to S5). We next tested four novel nmy-2 enhancers (cnt-2, ntl-2, plst-1, sac-1) and five novel act-2 enhancers (erm-1, gsp-1, npp-2, unc-59, Y54H5A.2). Of these nine genes, RNAi of eight significantly affected flow velocity (Y54H5A.2, plst-1, unc-59, erm-1, cnt-2, gsp-1. Movies S6-S11), the range of flow (ntl-2, npp-2, unc-59) or the distribution of cortical myosin (npp-2, unc-59, gsp-1, erm-1) (Fig. 6c, Supplementary Fig. S4 and S5).
Five of these genes (erm-1, plst-1, unc-59, cnt-2 and gsp-1) have homologs functionally linked to the actin cytoskeleton in mammals (Supplementary Fig. S3b) and we now implicate them in the regulation of actomyosin dynamics at the cell cortex during polarity establishment. Nuclear pore protein NPP-2 (NUP85), CCR-4/NOT component NTL-2 (CNOT2) and the conserved uncharacterised Y54H5A.2 (FAM203A) have not been previously shown to regulate the actin cytoskeleton. Surprisingly none of these new regulators were found when assessed by RNAi knockdown and DIC video-recording. These data demonstrate that the genetic interaction network combined with secondary “suppressor/enhancer” screening identifies relevant genes missed by other large scale screening methods.
Functional redundancy in cell polarity
In the spindle positioning/MT regulation group, the most highly connected suppressor is F25B5.2, a novel uncharacterised gene. F25B5.2(RNAi) embryos show no contractile activity and no pseudocleavage furrow (Fig. 7a F25B5.2(RNAi)). Surprisingly, despite these strong cortical defects, F25B5.2(RNAi) embryos are viable. These phenotypes are very similar to those reported for the nop-1(it142) mutant which genetically maps near F25B5.2 44 (Fig. 7a). We found that nop-1(it142) mutants have a stop codon in F25B5.2 (Trp696Stp) and that a transgene encoding F25B5.2 rescues the nop-1 mutant phenotype (Fig. 7a). Therefore nop-1(it142) is a loss of function allele of F25B5.2 (renamed nop-1). GFP::NOP-1 shows a dynamic localisation, being present at the cortex during polarity establishment but not during polarity maintenance (Fig. 7b).
Figure 7. NOP-1 (F25B5.2) regulates actomyosin localisation and dynamics, affects cell polarity establishment and acts redundantly with PLST-1 during polarity maintenance.

(a) One cell stage DIC images of wt (control), F25B5.2(RNAi), nop-1(it142) and nop-1(it142);gfp::F25B5.2 embryos. Pseudo-cleavage can be observed during polarity establishment in control embryos (white arrowheads). F25B5.2(RNAi) and nop-1(it142) embryos do not show a pseudo-cleavage. Pseudo-cleavage formation is rescued in nop-1(it142);gfp::F25B5.2 embryos. (b) Confocal (left) and DIC (right) images of one cell stage nop-1(it142);gfp::nop-1 life embryos. During polarity establishment GFP::NOP-1 is present at the cell cortex and drops during polarity maintenance. The nuclear localisation could be non-specific since unfused GFP has been reported in the nucleoplasm but never at the cortex. (c,f) Projection of cortical sections of wt and nop-1(it142) embryos (c) or plst-1(RNAi) and plst-1(RNAi)/nop-1(it-142) embryos (f) stained for NMY-2 (left images) and midsection of embryos stained for PAR-3 (right images). Embryo stages are indicated on the left. Yellow triangles indicate PAR-3 boundaries. (d) Embryo schematic illustrations representing PAR-3 front of retraction (grey line) during polarity establishment phase in 7 control vs 16 nop-1(it142) embryos. (e) Bar graph representing the strength of the genetic interactions between act-2(ts) suppressors in nop-1(it142). A strong interaction is defined as in Figure 4. (g) Table indicating the percentages of embryos in control (wt), nop-1(it142), plst-1(RNAi) or plst-1(RNAi)/nop-1(it-142) showing a symmetric first cell division. ***p<0.001 by Fisher’s exact test. Scale bars: 10μm
To characterise NOP-1 function in cell polarity, we examined the distributions of NMY-2 and PAR-3 in nop-1 mutant embryos. NMY-2 failed to form foci or to retract during polarity establishment (Fig. 7c and Movie S12), consistent with the previously reported failure to form an anterior actin cap 44. Despite the lack of NMY-2 asymmetry during polarity establishment, we observed partial anterior enrichment of PAR-3 (Fig. 7c,d), suggesting that PAR-3 becomes asymmetric by an NMY-2 independent mechanism during polarity establishment in the nop-1 mutant. Strikingly, NMY-2 and PAR-3 distribution defects are corrected at the polarity maintenance phase, and 98% of embryos are viable. We conclude that NOP-1 acts specifically during polarity establishment to regulate actomyosin function and that a functionally redundant mechanism acts during maintenance phase.
We reasoned that knocking down a functionally redundant gene in the viable nop-1(it142) mutant background would be expected to cause synthetic lethality and that suppressors of act-2(ts) would be good candidates, as they impair NMY-2 distribution or function. RNAi of eight suppressors of act-2(ts) genetically enhanced nop-1(it142) (Fig. 7e), with plst-1 and mlc-5 having the largest effects. RNAi of mlc-5 causes strong lethality due to cytokinesis 45 and polarity defects in a wt background. In contrast, RNAi of plst-1 is not lethal in a wild type background and shows a normal pattern of NMY-2 and PAR-3 localisation (Fig. 7f). The polarity defects of nop-1(it142); plst-1(RNAi) embryos are similar to those in nop-1(it142) alone during polarity establishment (Fig. 7f). Remarkably, the NMY-2 localisation and PAR-3 defects were not corrected, leading to total loss of polarity and a symmetric first cell division in 82% of embryos (Fig. 7f,g). Therefore, PLST-1 activity during polarity maintenance corrects the early polarity defects of nop-1 mutants. These results demonstrate that NOP-1 and PLST-1 act in partially redundant pathways to assure correct polarity establishment and maintenance via regulation of NMY-2 activity.
DISCUSSION
We present a novel approach for comprehensively building networks for individual biological processes by systematically focusing multiple high-throughput RNAi genetic interaction screens across different aspects of a given process. Using this approach, we generated a cell polarity network of 186 genes by screening mutants of 14 well-characterised polarity genes. This is a key step towards the task of identifying all of the genes in metazoan involved in cell polarity.
How does our screening strategy using a sub-library of genes relevant to embryo development compare to previous genome-wide suppressor screens in C. elegans? We tested a total of 47,000 potential suppression interactions with 14 polarity genes. Screening genome-wide a similar number of interactions would identify suppressors for only two mutants, which would be insufficient to build a network. Published genome-wide screens for two of the mutants used in our study, par-1(ts) and par-2(ts), identified a total of 14 suppressors using strong RNAi knockdown conditions 5, 32. Our screen could potentially have identified five of these suppressors and we detected two. In contrast, for these two mutants we identified 29 suppressors, of which 27 were not found in the genome-wide screens. Therefore, screening at three different strengths of RNAi is more sensitive for detecting genetic interactions between essential genes. For example, we found that RNAi of five components of the MAP signalling pathway suppressed par-1(ts), while the published screen only identified mpk-1 32. Furthermore, 53% of our identified genetic interactions would have been missed if the screens had been done in only one RNAi condition. In conclusion, using a sensitive method to screen a set of functionally related mutants with a relevant library, allows building of a highly connected genetic network.
Our study represents the largest set of suppressor interactions yet identified in a metazoan. Suppressor interactions primarily connect genes with opposing functions, which are unlikely to have the same loss of function phenotypes. In contrast, phenotypic profiling screens connect genes based on shared loss of function phenotypes 25, 35. This can explain why these two non-overlapping networks are complementary for recapitulating known functional interactions in cell polarity. A key output of our screening approach is the identification of relevant genes not easily found by phenotypic profiling. Secondary screens for “enhancer/suppressor” genetic profiles allowed us to select sets of candidates enriched for genes with polarity functions, observed either in sensitised backgrounds or by careful biophysical analyses. Phenotypic profiling may have missed these genes because their phenotype was masked by maternal sterility or their inhibition in a wild type background was compensated by functional redundancy. Redundant mechanisms have been shown to operate in the initiation of cell polarity asymmetry in the early C. elegans embryo 15. Through genetic interaction screening, we uncovered functional redundancy between two new cell polarity genes nop-1 and plst-1, demonstrating that genetic interaction screening can successfully identify functional redundant genes that are missed by single gene knockdown analyses.
In conclusion, focusing genetic suppressor screens across a biological process is a highly effective strategy for identifying a new landscape of functional relationships complementary to other large-scale functional datasets. The cell polarity genetic network that we generated using this approach will be an important resource for our understanding of cell polarity. Because known cell polarity mechanisms are conserved in animals, many of the functional links identified here should be widely relevant. Finally, applying our screening strategy in other contexts will be a powerful way to identify key players and uncover novel mechanisms in other essential biological processes.
METHODS
C. elegans strains
Strains were grown at 15°C unless otherwise stated. N2 (Bristol) was used as wild type. All strains used in this study are listed in Supplementary Table S6.
Embryo and gonad development RNAi sub-library
According to Wormbase WS180, 2721 genes are annotated as having an embryonic lethal phenotype (Emb) and 1056 genes are annotated as having a sterile phenotype (Ste) when knocked down by RNAi in wild type or mutant background. Together, these identify 2991 different genes. RNAi clones for 86% (2573) of these genes from the Ahringer or ORFome libraries were available and constituted the screening library (2632 clones; Table S1) 46, 47. Of these clones, 2209 have a single primary target as defined in Wormbase (at least 95% sequence identity with the RNAi clone over a minimum stretch of 100 nucleotides) and 423 have multiple primary targets, which knock down 172 additional unintended genes. In the WS220 version of Wormbase, 88% of the 2573 Emb and Ste genes selected from WS180 are Emb or Ste in a wild type background and 7% are Emb or Ste in a mutant background. The remaining 5% have changed annotation between WS180 and WS220 and are no longer referred to as Emb or Ste.
RNAi feeding conditions for suppressor screen of ts mutant in liquid
RNAi bacteria clones were inoculated from LB agar plates in 96-well format (10μg/ml carbenicillin, 10μg/ml tetracycline) to 900μl LB liquid cultures (10μg/ml carbenicillin, 10μg/ml tetracycline, 100 U/ml nystatin) and grown overnight at 37°. Bacterial cultures were induced for 3 hours with 4mM final IPTG at 37° with agitation. To generate 10% or 40% dilutions of feeding bacteria (corresponding to weak and medium RNAi knock-down), liquid cultures were diluted with control bacteria (transformed with empty L4440 vector). Bacterial cultures were pelleted and re-suspended in half the culture volume in S-Basal solution (S-Basal medium with trace metals, 3mM MgSO4, 10mM potassium citrate, 6mM CaCl2, 1mM IPTG, 0.01% Triton X-100, 10μg/ml carbenicillin, 10μg/ml tetracycline and 100 U/ml nystatin and fungizone 0.1μg/ml). 30μl of bacterial suspension was aliquoted into each well of a 96 well plate, then frozen and stored at −30°C before use for feeding RNAi experiments.
Synchronised L1 larval populations were grown until the L4 larvae stage on OP50 bacteria on plates at 15°, and then L4 larvae were washed and resuspended in S-Basal solution. 30 μl containing 10-15 worms were dispensed into each well of thawed RNAi bacterial feeding plates using a Wellmate liquid handler (Matrix). RNAi bacterial feeding plates with ts mutant worms were incubated for 72h at the restrictive temperature. For each mutant, this was the temperature at which the hatching rate was about 1% (number of live progeny per well was between 5-15 L1s, background level) for at least 95% of wells of the 96-well plate (Supplementary Table S6). The number of progeny per well was estimated by visual inspection. Suppression was scored positive when the number of progeny in a well was more than 1.5 times the highest background level.
Suppressor reproducibility assessment
In a first step we tested each ts mutant for suppression by every RNAi library clone at three strengths (weak, medium, strong knock-down) in duplicate, generated from independent RNAi inductions (n=6 tests). We selected RNAi clones if they showed suppression in at least 33% of the tests. We found an average of 146 candidate RNAi clones per mutant. In the second step, we retested all candidate clones at each RNAi strength three times in two independent experiments generated from independent RNAi induction (n=18 tests). Based on these three independent experiments of 24 individual tests, RNAi clones were considered reproducible if they suppress embryonic lethality in 33% of all tests and in at least two independent experiments. This threshold allows the detection of RNAi clones that suppress only at one RNAi strength, which might differ slightly between independent RNAi inductions. We observed an average of 31 reproducible suppressors per mutant. In total, 356 different RNAi clones (13.5% of the original library) reproducibly suppressed at least one mutant (Supplementary Table S2).
Suppressor specificity assessment
The reproducible suppressor set will contain genes with polarity functions as well as genes where RNAi knockdown non-specifically suppresses a mutant. For example, O’Rourke et al showed that temperature sensitive mutants can be non-specifically suppressed by RNAi knockdowns of genes enriched for mitochondrial and ribosomal functions6. To identify non-specific suppressors, we carried out a third step for specificity by testing the reproducible suppressors for their ability to suppress any of five different ts mutants not involved in polarity. In this step, all reproducible clones were tested in two independent experiments consisting of three RNAi conditions in triplicate (18 tests). A reproducible clone was classified as non-specific if it showed a suppression phenotype for at least 22% of the 18 tests with any non-polarity ts mutant (Supplementary Table S2). Out of these analyses we classified the 356 reproducible clones into two sets, 300 specific and 56 non-specific (Supplementary Table S2).
Mapping RNAi clones to genes
The 356 reproducible clones were sequenced and their primary target gene(s) mapped using C. elegans reference genome WS210 (Supplementary Table S1 and S2). Primary RNAi target genes have at least 95% sequence identity with the RNAi clone over a minimum stretch of 100 nucleotides. Genes knocked down by a RNAi clone with multiple targets are labelled as ‘multiple targets’ in Supplementary Table S3. These genes were omitted from the functional class statistical analysis (Table S4) and the graphical network representations (Fig. 2 and 3).
Functional class analysis
Specific and non-specific suppressors were manually assigned a functional class and a sub-functional category using information derived from Wormbase (WS210), BlastP matches, Treefam phylogenies, protein domain homology, GO terms and KOGs (Supplementary Table S4). Functional enrichments were statistically analysed using Fisher’s exact test. In agreement with O’Rourke6, the functional analysis of our suppressors showed enrichment for mitochondrial and ribosomal functions. Therefore we removed suppressors functionally labelled as cytoplasmic or mitochondrial ribosomal genes and respiratory chain genes from our network representation and further analysis.
Network representation
Graphical network representations were plotted using Cytoscape 48. Our data is compared to embryo and gonad phenotypic interactions 35 with a CSI ≥ 0.96.
Quantitative enhancer screen on agar plate
RNAi feeding bacteria were grown and induced as described for liquid suppressor screens. 50μl of induced bacteria were spotted onto each well of a 6-well LB (10μg/ml carbenicillin, 10μg/ml tetracycline, 100 U/ml nystatin) agar plate containing 1mM IPTG. Three L4 larvae were added per well. Wild type worms and ts mutants of interest were incubated in parallel for 48-72 hours at a semi-permissive temperature. Each RNAi reagent was tested at least in two independent experiments in duplicate. The hatching ratio was calculated by dividing the number of live progeny by the number of eggs laid. This ratio was used as a proxy for fitness (W) in the enhancement tests. At the semi-permissive temperatures used, mutant fitness (Wmut) grown on control bacteria was greater than 0.25 with more than 50 live progeny per well. We called Wobs the fitness observed after RNAi in the ts mutant and Wrnai the fitness observed in the same RNAi condition in the wild type. We calculated the expected fitness (Wexp) for non-interacting genes by the product of Wmut by Wrnai (Wexp = Wmut x Wrnai). We represent the strength of a genetic interactions by epsilon (ε̣, the deviation of the observed fitness from the expected one (ε = Wobs – Wexp). A negative value for ε indicates an enhancement. We focus our analysis on strong enhancers where ε ≤ −0.15 and Z-test p<0.001.
Immunofluorescence
Immunofluorescence was performed as previously described 28. All antibodies used in this study are listed in Supplementary Table S7. DNA was DAPI stained. Images were acquired using Carl Zeiss LSM510 Meta confocal equipped with LSM image software and Carl Zeiss Axioplan2 with Open Lab image software.
Polarity phenotypes quantification and analysis
Average of AB cell percentage area were calculated by determining the area of AB cell with respect to the total embryo area (AB + P1) in at least 15 two-cell stage embryos. Statistical analyses were done using Student’s t test.
The percentage of PAR-2 aberrant localisation in two-cell stage embryos was determined by assessing PAR-2 localisation blind to RNAi treatment. These data were statistically analysed using Fisher’s exact test.
MEX-5 intensity ratio was determined by measuring the mean grey scale value for a fixed area (625 pixels2) in AB and P1 cells. We counted how many embryos for each RNAi conditions showed a MEX-5 intensity ratio (AB/P1) inferior to the minimum value observed in the control. These data were statistically analysed using Fisher’s exact test. To determine nop-1(it142) and plst-1 enhancement of symmetric first cell divisions we counted how many embryos for each RNAi conditions showed an AB cell percentage area inferior to the minimum value observed in the control. These data were statistically analysed using Fisher’s exact test.
NMY-2::GFP movie acquisition
Confocal movies of cortical NMY-2::GFP were acquired at 22-24°C with a spinning disc confocal microscope using a Zeiss C-Apochromat 63X/1.2 NA objective lens, Yokogawa CSU-X1 scan head and an Andor iXon EMCCD camera (512 by 512 pixels). A stack consisting of three z-planes (0.5 μm spacing) with an exposure of 150ms 488nm laser was acquired at an interval of 5s from the onset of cortical flow until the first cell division. The maximum intensity projection of the stack at each time point was then subjected for further analysis. In addition, a single bright field image was acquired in the mid plane of the embryo at an interval of 15s. Image analysis was performed with ImageJ and MATLAB.
Quantification of flow velocity and density profiles
Cortical flow velocities of NMY-2::GFP in the acquired movies were quantified using particle image velocimetry as described in 49 . Briefly, each frame was divided into templates using a square grid (6 μm by 6 μm). A 2D flow field was generated by identifying the best match for each template square in the following frame, using the normxcorr2 cross correlation function from MATLAB, and by defining the vector to be the displacement of the template square. To project the 2D flow field on the AP axis, the embryo was divided into 12 bins along the AP axis, and the average magnitude of individual velocity vectors over 20 consecutive frames was calculated. To avoid boundary effects, the posterior and the anterior most bins were excluded, and averages were computed along a 12 μm thick stripe in the centre of the embryo. The averages of the magnitude of velocity in each bin were then averaged over all embryos of one experimental condition to generate the heat maps. The averages of the magnitude of all velocity vectors within the 12 μm thick stripe, covering the 10 central bins, were calculated to provide the average magnitude velocity. We obtained the AP myosin density profiles in the same bins by averaging the normalised fluorescence intensities in each bin across the 12 μm thick stripe, for the purpose of obtaining the range of flow (see below).
Estimation of the range of flow
To estimate the range of flow using a hydrodynamic description of the cortex43, we chose the time of 30% cortical retraction of NMY-2::GFP, and the AP velocity and myosin density profiles were quantified in this period over 20 consecutive frames for each embryo. Using a hydrodynamic description of the actomyosin cell cortex in the framework of active fluids43, we determined the theoretical flow profile that most closely matches the experimentally quantified AP velocity given the measured myosin density profile43 for each individual embryo, through variation of both the hydrodynamic length (i.e. the range of flow) and the coefficient that converts myosin intensity to active tension (we assume a linear relationship). For each experimental condition, we report the ensemble average of the ranges of flow obtained for each individual embryo, and the respective standard error.
Quantification of the myosin intensity coefficient of variation
The coefficient of variation (cv) of NMY-2::GFP fluorescence intensities is a measure of dispersion of fluorescence in the embryo and is the ratio of the standard deviation of fluorescence intensities and the mean fluorescence intensities. A homogeneous distribution of fluorescence within the embryo will result in a small cv and a higher cv will result from a patchy cortex with very bright foci like structures interspersed with less bright regions. For obtaining the cv of fluorescence intensities in each embryo, the boundary of the embryo was determined and the mean and standard deviation of fluorescence intensities in the entire embryo in 10 frames at the onset of cortical flows was utilised. We report the ensemble average and standard error for each experimental condition.
Supplementary Material
ACKNOWLEDGMENTS
This work was supported by a Wellcome Trust Senior Research Fellowship (054523, to JA), postdoctoral fellowships from the Human Frontier Science Program (to BF and JR), a Herchel Smith Post-doctoral fellowship (to JR), and an EMBO fellowship (to BF). We thank P. Mains for providing let-502(ts) and mel-11(ts) mutants, and K. Kemphues for NMY-2 expressing bacteria. We thank Frederic Antigny, Damien Lefer, Volkan Karabacak, Sonja Kroschwald, Andrea Maffioletti and Aram Sayadian for their contribution in visual scoring and Sebastian Fürthauer for help with hydrodynamic length measurements. We thank the media team of the Gurdon Institute for preparing screen reagents. We also thank Carly Dix and Richard Durbin for comments on the manuscript. Some nematode strains used in this work were provided by the Caenorhabditis Genetics Center, which is funded by the NIH National Center for Research Resources (NCRR). The P4A1 monoclonal antibody developed by J. Priess was obtained from the Developmental Studies Hybridoma Bank developed under the auspices of the NICHD and maintained by The University of Iowa, Department of Biology, Iowa City, IA 52242.
Footnotes
AUTHOR CONTRIBUTIONS BTF and JR designed and carried out the screen, analysed the network, characterised polarity candidates and drafted the manuscript CL participated in the primary screen experiments SN and SG designed and performed the biophysical analysis of myosin regulators EZ generated the GFP::NOP-1 transgenic strain TI and MS isolated the nmy-2(ts) and pkc-3(ts) mutants JA participated in the design and coordination of the study and edited the manuscript
REFERENCES
- 1.Lehner B, Crombie C, Tischler J, Fortunato A, Fraser AG. Systematic mapping of genetic interactions in Caenorhabditis elegans identifies common modifiers of diverse signaling pathways. Nature genetics. 2006;38:896–903. doi: 10.1038/ng1844. [DOI] [PubMed] [Google Scholar]
- 2.Byrne AB, et al. A global analysis of genetic interactions in Caenorhabditis elegans. J Biol. 2007;6:8. doi: 10.1186/jbiol58. [DOI] [PMC free article] [PubMed] [Google Scholar]
- 3.Sandmann T, Boutros M. Screens, maps & networks: from genome sequences to personalized medicine. Curr Opin Genet Dev. 2012 doi: 10.1016/j.gde.2012.02.001. [DOI] [PubMed] [Google Scholar]
- 4.Costanzo M, et al. The genetic landscape of a cell. Science. 2010;327:425–431. doi: 10.1126/science.1180823. [DOI] [PMC free article] [PubMed] [Google Scholar]
- 5.Labbe JC, Pacquelet A, Marty T, Gotta M. A genomewide screen for suppressors of par-2 uncovers potential regulators of PAR protein-dependent cell polarity in Caenorhabditis elegans. Genetics. 2006;174:285–295. doi: 10.1534/genetics.106.060517. [DOI] [PMC free article] [PubMed] [Google Scholar]
- 6.O’Rourke SM, Dorfman MD, Carter JC, Bowerman B. Dynein modifiers in C. elegans: light chains suppress conditional heavy chain mutants. PLoS Genet. 2007;3:e128. doi: 10.1371/journal.pgen.0030128. [DOI] [PMC free article] [PubMed] [Google Scholar]
- 7.Dorfman M, Gomes JE, O’Rourke S, Bowerman B. Using RNA interference to identify specific modifiers of a temperature-sensitive, embryonic-lethal mutation in the Caenorhabditis elegans ubiquitin-like Nedd8 protein modification pathway E1-activating gene rfl-1. Genetics. 2009;182:1035–1049. doi: 10.1534/genetics.109.104885. [DOI] [PMC free article] [PubMed] [Google Scholar]
- 8.Coradini D, Casarsa C, Oriana S. Epithelial cell polarity and tumorigenesis: new perspectives for cancer detection and treatment. Acta Pharmacol Sin. 2011;32:552–564. doi: 10.1038/aps.2011.20. [DOI] [PMC free article] [PubMed] [Google Scholar]
- 9.St Johnston D, Ahringer J. Cell polarity in eggs and epithelia: parallels and diversity. Cell. 2010;141:757–774. doi: 10.1016/j.cell.2010.05.011. [DOI] [PubMed] [Google Scholar]
- 10.Gonczy P. Mechanisms of asymmetric cell division: flies and worms pave the way. Nat Rev Mol Cell Biol. 2008;9:355–366. doi: 10.1038/nrm2388. [DOI] [PubMed] [Google Scholar]
- 11.Motegi F, et al. Microtubules induce self-organization of polarized PAR domains in Caenorhabditis elegans zygotes. Nat Cell Biol. 2011;13:1361–1367. doi: 10.1038/ncb2354. [DOI] [PMC free article] [PubMed] [Google Scholar]
- 12.Goldstein B, Hird SN. Specification of the anteroposterior axis in Caenorhabditis elegans. Development. 1996;122:1467–1474. doi: 10.1242/dev.122.5.1467. [DOI] [PubMed] [Google Scholar]
- 13.Cowan CR, Hyman AA. Centrosomes direct cell polarity independently of microtubule assembly in C. elegans embryos. Nature. 2004;431:92–96. doi: 10.1038/nature02825. [DOI] [PubMed] [Google Scholar]
- 14.Tsai MC, Ahringer J. Microtubules are involved in anterior-posterior axis formation in C. elegans embryos. J Cell Biol. 2007;179:397–402. doi: 10.1083/jcb.200708101. [DOI] [PMC free article] [PubMed] [Google Scholar]
- 15.Zonies S, Motegi F, Hao Y, Seydoux G. Symmetry breaking and polarization of the C. elegans zygote by the polarity protein PAR-2. Development. 2010;137:1669–1677. doi: 10.1242/dev.045823. [DOI] [PMC free article] [PubMed] [Google Scholar]
- 16.Munro E, Nance J, Priess JR. Cortical flows powered by asymmetrical contraction transport PAR proteins to establish and maintain anterior-posterior polarity in the early C. elegans embryo. Dev Cell. 2004;7:413–424. doi: 10.1016/j.devcel.2004.08.001. [DOI] [PubMed] [Google Scholar]
- 17.Motegi F, Sugimoto A. Sequential functioning of the ECT-2 RhoGEF, RHO-1 and CDC-42 establishes cell polarity in Caenorhabditis elegans embryos. Nat Cell Biol. 2006;8:978–985. doi: 10.1038/ncb1459. [DOI] [PubMed] [Google Scholar]
- 18.Schonegg S, Hyman AA. CDC-42 and RHO-1 coordinate acto-myosin contractility and PAR protein localization during polarity establishment in C. elegans embryos. Development. 2006;133:3507–3516. doi: 10.1242/dev.02527. [DOI] [PubMed] [Google Scholar]
- 19.Boyd L, Guo S, Levitan D, Stinchcomb DT, Kemphues KJ. PAR-2 is asymmetrically distributed and promotes association of P granules and PAR-1 with the cortex in C. elegans embryos. Development. 1996;122:3075–3084. doi: 10.1242/dev.122.10.3075. [DOI] [PubMed] [Google Scholar]
- 20.Watts JL, et al. par-6, a gene involved in the establishment of asymmetry in early C. elegans embryos, mediates the asymmetric localization of PAR-3. Development. 1996;122:3133–3140. doi: 10.1242/dev.122.10.3133. [DOI] [PubMed] [Google Scholar]
- 21.Goehring NW, et al. Polarization of PAR proteins by advective triggering of a pattern-forming system. Science. 2011;334:1137–1141. doi: 10.1126/science.1208619. [DOI] [PubMed] [Google Scholar]
- 22.Cuenca AA, Schetter A, Aceto D, Kemphues K, Seydoux G. Polarization of the C. elegans zygote proceeds via distinct establishment and maintenance phases. Development. 2003;130:1255–1265. doi: 10.1242/dev.00284. [DOI] [PMC free article] [PubMed] [Google Scholar]
- 23.Zipperlen P, Fraser AG, Kamath RS, Martinez-Campos M, Ahringer J. Roles for 147 embryonic lethal genes on C. elegans chromosome I identified by RNA interference and video microscopy. EMBO J. 2001;20:3984–3992. doi: 10.1093/emboj/20.15.3984. [DOI] [PMC free article] [PubMed] [Google Scholar]
- 24.Piano F, et al. Gene clustering based on RNAi phenotypes of ovary-enriched genes in C. elegans. Curr Biol. 2002;12:1959–1964. doi: 10.1016/s0960-9822(02)01301-5. [DOI] [PubMed] [Google Scholar]
- 25.Sonnichsen B, et al. Full-genome RNAi profiling of early embryogenesis in Caenorhabditis elegans. Nature. 2005;434:462–469. doi: 10.1038/nature03353. [DOI] [PubMed] [Google Scholar]
- 26.Piekny AJ, Mains PE. Rho-binding kinase (LET-502) and myosin phosphatase (MEL-11) regulate cytokinesis in the early Caenorhabditis elegans embryo. J Cell Sci. 2002;115:2271–2282. doi: 10.1242/jcs.115.11.2271. [DOI] [PubMed] [Google Scholar]
- 27.Willis JH, Munro E, Lyczak R, Bowerman B. Conditional dominant mutations in the Caenorhabditis elegans gene act-2 identify cytoplasmic and muscle roles for a redundant actin isoform. Mol Biol Cell. 2006;17:1051–1064. doi: 10.1091/mbc.E05-09-0886. [DOI] [PMC free article] [PubMed] [Google Scholar]
- 28.Rivers DM, Moreno S, Abraham M, Ahringer J. PAR proteins direct asymmetry of the cell cycle regulators Polo-like kinase and Cdc25. J Cell Biol. 2008;180:877–885. doi: 10.1083/jcb.200710018. [DOI] [PMC free article] [PubMed] [Google Scholar]
- 29.Baas AF, et al. Activation of the tumour suppressor kinase LKB1 by the STE20-like pseudokinase STRAD. EMBO J. 2003;22:3062–3072. doi: 10.1093/emboj/cdg292. [DOI] [PMC free article] [PubMed] [Google Scholar]
- 30.Kim JS, Hung W, Narbonne P, Roy R, Zhen M. C. elegans STRADalpha and SAD cooperatively regulate neuronal polarity and synaptic organization. Development. 2010;137:93–102. doi: 10.1242/dev.041459. [DOI] [PubMed] [Google Scholar]
- 31.Tenlen JR, Molk JN, London N, Page BD, Priess JR. MEX-5 asymmetry in one-cell C. elegans embryos requires PAR-4- and PAR-1-dependent phosphorylation. Development. 2008;135:3665–3675. doi: 10.1242/dev.027060. [DOI] [PubMed] [Google Scholar]
- 32.Spilker AC, Rabilotta A, Zbinden C, Labbe JC, Gotta M. MAP kinase signaling antagonizes PAR-1 function during polarization of the early Caenorhabditis elegans embryo. Genetics. 2009;183:965–977. doi: 10.1534/genetics.109.106716. [DOI] [PMC free article] [PubMed] [Google Scholar]
- 33.Yoo AS, Bais C, Greenwald I. Crosstalk between the EGFR and LIN-12/Notch pathways in C. elegans vulval development. Science. 2004;303:663–666. doi: 10.1126/science.1091639. [DOI] [PubMed] [Google Scholar]
- 34.Matsubara Y, et al. The adaptor-like protein ROG-1 is required for activation of the Ras-MAP kinase pathway and meiotic cell cycle progression in Caenorhabditis elegans. Genes Cells. 2007;12:407–420. doi: 10.1111/j.1365-2443.2007.01061.x. [DOI] [PubMed] [Google Scholar]
- 35.Green RA, et al. A high-resolution C. elegans essential gene network based on phenotypic profiling of a complex tissue. Cell. 2011;145:470–482. doi: 10.1016/j.cell.2011.03.037. [DOI] [PMC free article] [PubMed] [Google Scholar]
- 36.Wright AJ, Hunter CP. Mutations in a beta-tubulin disrupt spindle orientation and microtubule dynamics in the early Caenorhabditis elegans embryo. Mol Biol Cell. 2003;14:4512–4525. doi: 10.1091/mbc.E03-01-0017. [DOI] [PMC free article] [PubMed] [Google Scholar]
- 37.Krueger LE, Wu JC, Tsou MF, Rose LS. LET-99 inhibits lateral posterior pulling forces during asymmetric spindle elongation in C. elegans embryos. J Cell Biol. 2010;189:481–495. doi: 10.1083/jcb.201001115. [DOI] [PMC free article] [PubMed] [Google Scholar]
- 38.Panbianco C, et al. A casein kinase 1 and PAR proteins regulate asymmetry of a PIP(2) synthesis enzyme for asymmetric spindle positioning. Dev Cell. 2008;15:198–208. doi: 10.1016/j.devcel.2008.06.002. [DOI] [PMC free article] [PubMed] [Google Scholar]
- 39.Collart MA, Panasenko OO. The Ccr4--not complex. Gene. 2012;492:42–53. doi: 10.1016/j.gene.2011.09.033. [DOI] [PubMed] [Google Scholar]
- 40.DeBella LR, Hayashi A, Rose LS. LET-711, the Caenorhabditis elegans NOT1 ortholog, is required for spindle positioning and regulation of microtubule length in embryos. Mol Biol Cell. 2006;17:4911–4924. doi: 10.1091/mbc.E06-02-0107. [DOI] [PMC free article] [PubMed] [Google Scholar]
- 41.Schade MA, Reynolds NK, Dollins CM, Miller KG. Mutations that rescue the paralysis of Caenorhabditis elegans ric-8 (synembryn) mutants activate the G alpha(s) pathway and define a third major branch of the synaptic signaling network. Genetics. 2005;169:631–649. doi: 10.1534/genetics.104.032334. [DOI] [PMC free article] [PubMed] [Google Scholar]
- 42.Liu J, Maduzia LL, Shirayama M, Mello CC. NMY-2 maintains cellular asymmetry and cell boundaries, and promotes a SRC-dependent asymmetric cell division. Dev Biol. 2010;339:366–373. doi: 10.1016/j.ydbio.2009.12.041. [DOI] [PMC free article] [PubMed] [Google Scholar]
- 43.Mayer M, Depken M, Bois JS, Julicher F, Grill SW. Anisotropies in cortical tension reveal the physical basis of polarizing cortical flows. Nature. 2010;467:617–621. doi: 10.1038/nature09376. [DOI] [PubMed] [Google Scholar]
- 44.Rose LS, Lamb ML, Hird SN, Kemphues KJ. Pseudocleavage is dispensable for polarity and development in C. elegans embryos. Dev Biol. 1995;168:479–489. doi: 10.1006/dbio.1995.1096. [DOI] [PubMed] [Google Scholar]
- 45.Gally C, et al. Myosin II regulation during C. elegans embryonic elongation: LET-502/ROCK, MRCK-1 and PAK-1, three kinases with different roles. Development. 2009;136:3109–3119. doi: 10.1242/dev.039412. [DOI] [PubMed] [Google Scholar]
- 46.Kamath RS, et al. Systematic functional analysis of the Caenorhabditis elegans genome using RNAi. Nature. 2003;421:231–237. doi: 10.1038/nature01278. [DOI] [PubMed] [Google Scholar]
- 47.Rual JF, et al. Toward improving Caenorhabditis elegans phenome mapping with an ORFeome-based RNAi library. Genome Res. 2004;14:2162–2168. doi: 10.1101/gr.2505604. [DOI] [PMC free article] [PubMed] [Google Scholar]
- 48.Shannon P, et al. Cytoscape: a software environment for integrated models of biomolecular interaction networks. Genome Res. 2003;13:2498–2504. doi: 10.1101/gr.1239303. [DOI] [PMC free article] [PubMed] [Google Scholar]
- 49.Raffel M. Particle image velocimetry : a practical guide. Edn. 2nd Springer; Heidelberg ; New York: 2007. [Google Scholar]
Associated Data
This section collects any data citations, data availability statements, or supplementary materials included in this article.