

Abstract
Repair of interstrand crosslinks (ICLs) requires the coordinate action of the intra-S phase checkpoint and the Fanconi Anemia (FA) pathway, which promote ICL incision, translesion synthesis, and homologous recombination (reviewed in 1,2). Previous studies have implicated the 3′-5′ superfamily 2 helicase HELQ/Hel308 in ICL repair in D. melanogaster (known as Mus301 or Spn-C3) and C. elegans (known as Helq-1 or Hel-3084). While in vitro analysis suggests that HELQ preferentially unwinds synthetic replication fork substrates with 3′ ssDNA overhangs and also disrupts protein/DNA interactions while translocating along DNA5,6, little is known regarding its functions in mammalian organisms. Here we report that HELQ helicase-deficient mice exhibit subfertility, germ cell attrition, ICL sensitivity and tumour predisposition, with HelQ heterozygous mice exhibiting a similar, albeit less severe, phenotype than the null, indicative of haploinsufficiency. We establish that HELQ interacts directly with the RAD51 paralog complex, BCDX2, and functions in parallel to the FA pathway to promote efficient HR at damaged replication forks. Thus, our results reveal a critical role for HELQ in replication-coupled DNA repair, germ cell maintenance and tumour suppression in mammals.
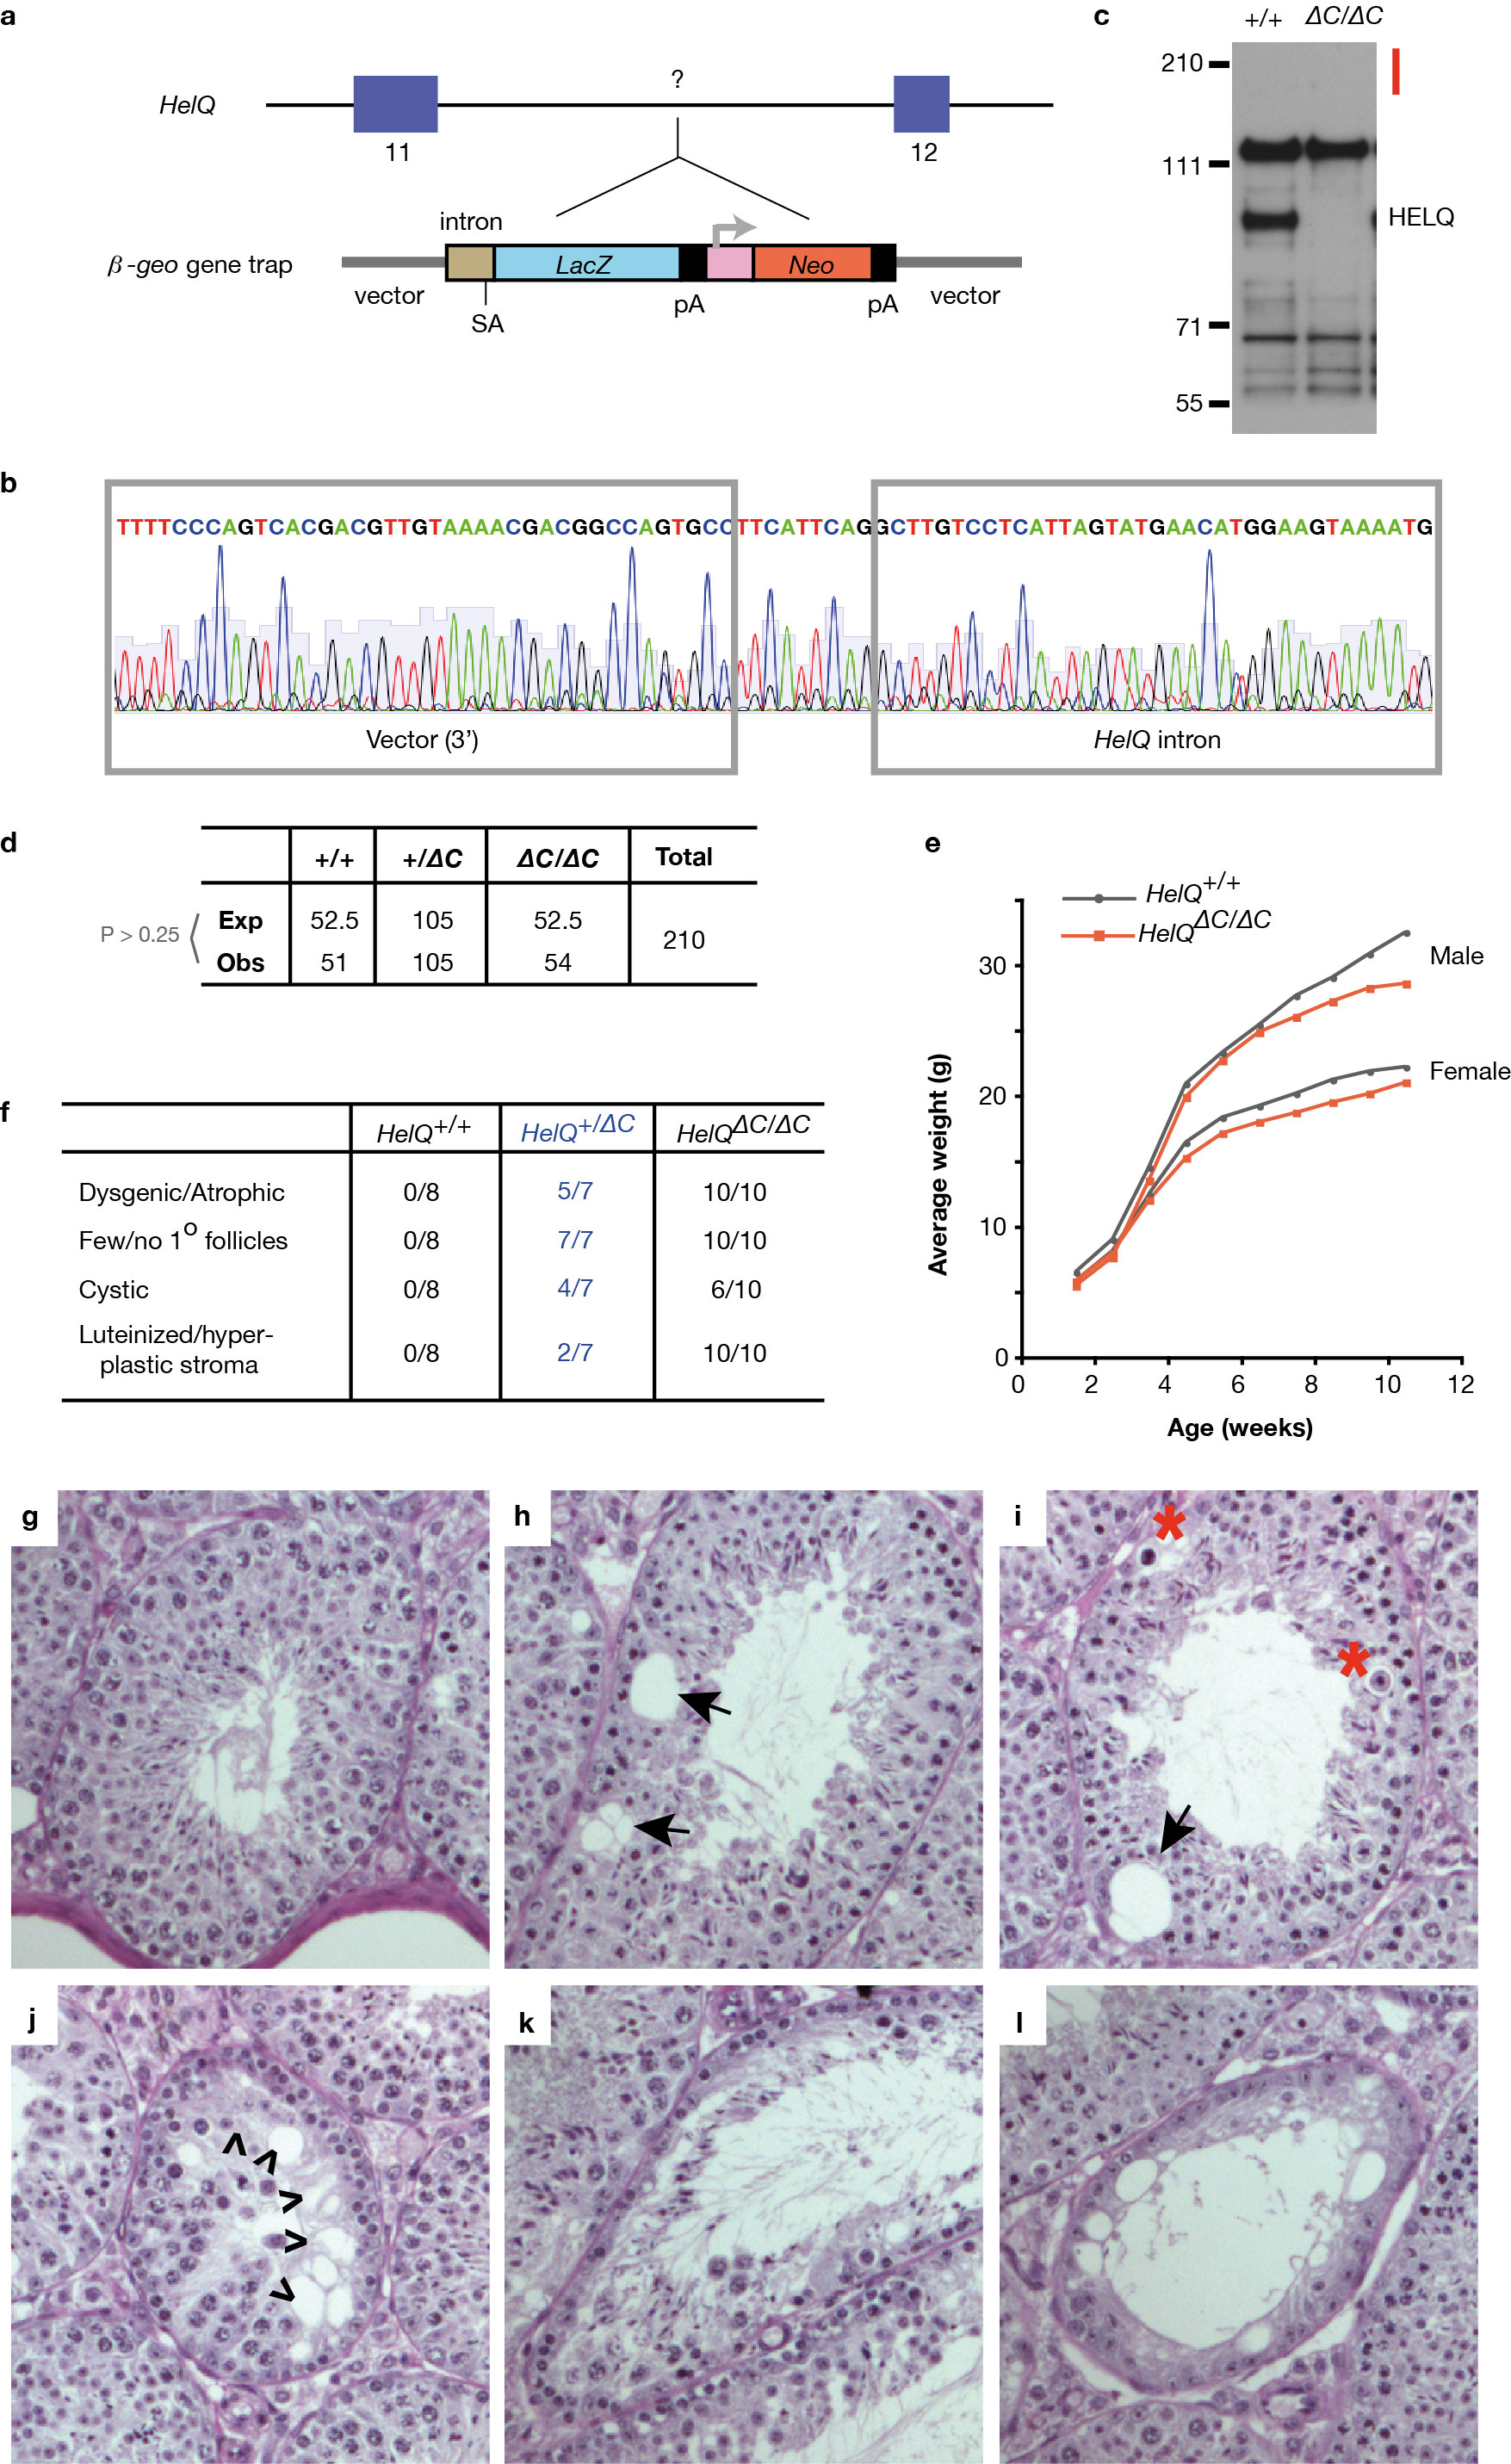
To examine the impact of HELQ deficiency in vertebrates, we generated a HelQΔC-deficient mouse strain that is truncated at the C-terminus of HELQ (Fig. 1a, b; Extended Data Fig. 1a, b) and results in loss of detectable HELQ protein (Fig. 1d; Extended Data Fig. 1c). Although HelQΔC/ΔC mice are viable (Fig. 1c), are born in normal Mendelian ratios and lack significant growth or developmental abnormalities (Extended Data Fig. 1d, e), breeding experiments with HelQΔC/ΔC mutant pairs revealed a fertility defect. Eight heterozygous and 8 mutant pairs were mated continuously for 5-6 months, resulting in 320 offspring in the case of heterozygotes (an average of 6.1 litters and 40 pups each) but only 38 pups were born to HelQΔC/ΔC pairs (1.4 litters and 4.7 pups per pair). Mating of mutants to control animals revealed that females contribute more to this phenotype than males (Fig. 1e).
Figure 1. A mouse model of HELQ deficiency.

a, HelQ genomic locus; base pairs are indicated above; introns are not to scale; exons are roughly to scale with black bar indicating 1 kb; location of the β-geo trap and genotyping primers are shown. b, HELQ domain architecture: amino acids are indicated, red bar spans epitope recognized by the HELQ antibody used for western blotting. c, HelQ genotype PCR. d, Lysates from ear fibroblasts of HelQ mice probed for HELQ. e, The number of litters (black) and pups (pink) generated per 21-day gestational interval. f, HelQ testis images and weights. g, Histological sections of HelQ gonads. Atrophic tubules (A); developing ovarian follicles (*). h, 5-day-old neonatal testes labelled with the Sertoli marker WT1 (brown) and hematoxylin (blue), to reveal spermatogonia (*); quantification of spermatogonia (SG). i, Epithelial and stromal tumour free survival of HelQ mice. j, Frequency of mice with 2 or more primary tumours, and k, female-specific pathology.
Consistent with a fertility defect, HelQΔC/ΔC testes were smaller than those of wild-type males (0.58% of body weight for wild-type, versus 0.38% for mutants, Fig. 1f). Histological analysis of testes revealed many normal tubules but also regions of atrophy in the mutants (Fig. 1g; Extended Data Fig. 1g-l). Dysgenesis/atrophy was even more pronounced in HelQΔC/ΔC ovaries (Fig. 1g; Extended Data Fig. 1f). A possible stem cell origin was investigated since no particular subset of spermatocytes appeared affected (Extended Data Fig. 1g-l). Indeed, HelQΔC/ΔC adults had significantly fewer c-Kit+ spermatogonia than controls (Extended Data Fig. 2a, b). As atrophy was not linked to aging (Extended Data Fig. 2c), a developmental origin was examined; tubules from 5-day-old wild-type mice contained 6-fold more spermatogonia than mutants (Fig. 1h), indicating that atrophic tubules in mutant adults may primarily arise from reduced spermatogonial stem cell pools during development.
The impact of HELQ deficiency during organismal aging revealed that tumour-free survival was significantly reduced in HelQ mutants (Fig. 1i; Extended Data Fig. 2d), with twice as many HelQΔC/ΔC mice developing 2 or more primary tumours in comparison to controls (Fig. 1j). Ovarian tumours (resembling granulosa and other sex cord stromal tumours; Extended Data Fig. 3b-f) and pituitary adenomas (Extended Data Fig. 3g-j) were the most prominent tumour types in female mice, with incidences of 40% in the case of ovarian tumours and 30% in the case of pituitary tumours (Fig. 1k). Unexpectedly, HelQ+ /ΔC heterozygous females also presented with ovarian pathology similar to that of younger mutant females (Extended Data Fig. 2d). Pathology included cystic (4 of 7 mice) and dysgenic/atrophic (5/7) ovaries with few or no maturing follicles (7/7) and luteinized stroma (2/7). HelQ+ /ΔC heterozygous females also frequently displayed pituitary (5/7 mice), harderian gland (3/7) and gastrointestinal (3/7) adenomas, polyps and hyperplasias. While these phenotypes are less severe than observed in the HELQ homozygous mice, the data reveal that loss of a single allele of HELQ confers haploinsufficiency in mice.
The phenotype of HelQΔC/ΔC mice is similar to that observed in mouse models of FA7. Hematopoietic stem and progenitor cell (HSPC) defects and sensitivity to ICLs are also hallmarks of FA and were therefore examined in HelQ mutants. While bone marrow HSPCs from HelQΔC/ΔC mice exhibit hypersensitivity to the ICL agent mitomycin C (MMC; Extended Data Fig. 4a), HelQΔC/ΔC HSPCs were not compromised in numbers (Extended Data Fig. 4b, c), proliferative capacity (Extended Data Fig. 4d, e), or engraftment (Extended Data Fig. 4f-i). HELQ-deficient cells exhibited hypersensitivity to replication blocking agents such as MMC and camptothecin (CPT; Fig. 2a, b), but not to ionizing radiation (IR) or ultraviolet radiation (UV; Fig. 2c, d). HelQΔC/ΔC cells also exhibited significantly more chromatid breaks and radial chromosomes than control cells upon treatment with MMC (Fig. 2e and j). Silencing of HELQ by siRNA in human cells resulted in similar phenotypes (Extended Data Fig. 4j).
Figure 2. HelQ damage sensitivity and HelQ/FancD2 double mutant phenotypes.

a-d, Clonogenic survival assays of immortalized cells exposed to the indicated damaging agents. e, Metaphase chromosomes (meta’s) from immortalized cells treated with 5 ng/ml MMC for 16 hr; frequency of metaphases with radials ± MMC are indicated. f, Testis weights of wild-type, single, and HelQ/FancD2 double mutant mice. g, Histological sections of testes. Atrophic (A); Sertoli cell only (S). h, i, Clonogenic survival assays as in (a). j, Metaphase aberrations from immortalized cells treated ± 10 ng/ml MMC for 16 hr.
To examine the phenotypic relationship between HELQ and the FA pathway we generated HelQΔC/ΔC;FancD2−/− double mutant mice (the FancD2 strain is described in 8). Double mutants were born in Mendelian ratios (Extended Data Fig. 4k), and growth and appearance were normal. Surprisingly, testes from double mutants were significantly smaller than single mutants and all tubules were atrophic, containing only Sertoli cells (Fig. 2f, g). Similarly, double mutants cells exhibited greater sensitivity to MMC and CPT than either single mutant (Fig. 2h, i), and spontaneous and MMC-induced chromosomal aberrations were significantly elevated over the HelQ single mutant (Fig. 2j). These results suggest that HELQ and FANCD2 act in parallel ICL repair pathways.
To gain insight into the function of HELQ during DNA repair, we performed proteomic analysis of proteins co-precipitated with FLAG-tagged HELQ. Mass spectrometry (MS) revealed several checkpoint and DNA repair proteins, including the replication checkpoint kinase ATR, the ssDNA binding protein RPA70, the four components of the BCDX2 complex required for HR, and the FANCD2/FANCI heterodimer that functions in the FA pathway (Fig. 3a, b; Extended Data Fig. 5a). Interaction partners identified by MS were confirmed via immunoprecipitation (IP)/western blot (Fig. 3c). Reciprocal IP of RAD51C confirmed its association with FLAG-HELQ (Fig. 3d), and endogenous HELQ was detected in RAD51C IPs from 293T cells and vice versa (Fig. 3e). Recombinant BCDX2 proteins purified from either insect cells or bacteria also bound to purified FLAG-HELQ but not to ALC1-FLAG or FLAG controls (Fig. 3f). Intriguingly, XRCC3, a component of the RAD51C/XRCC3 (CX3) RAD51 paralog complex, was not detected by either MS or western blotting of FLAG-HELQ IPs (Fig. 3c). Furthermore, HELQ was not found in reciprocal IPs with endogenous XRCC3 (Extended Data Fig. 5c). These data indicate that HELQ interacts directly with the BCDX2 complex but not with the CX3 complex.
Figure 3. HELQ interacts with DNA replication stress response factors.
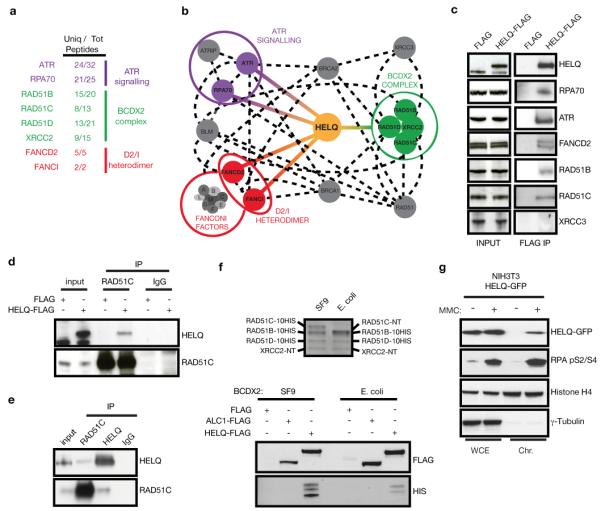
a, Unique and total peptides identified by MS analysis of HELQ-FLAG co-IPs isolated from 293 cells. b, HELQ interaction network based on the MS results (coloured lines) and reported interactions from BIOGRID, STRING and MINT databases (dashed lines). c, Western blots of input and FLAG IPs from HELQ-FLAG and FLAG control samples. d, Reciprocal IP of endogenous RAD51C with HELQ-FLAG. e, Endogenous HELQ and RAD51C IPs from 293T cells. f, Purified, HIS-tagged BCDX2 complexes (top panel) were incubated with FLAG-complexed beads (bottom panels) to test for a direct interaction. FLAG and ALC1-FLAG are shown as negative controls. g, Western blot analysis of whole cells extracts (WCE) and chromatin fractions (Chr) from NIH3T3 HELQ-GFP expressing cells treated ± 100 ng/ml MMC for 24 hr.
Since ATR, RPA70, the BCDX2 complex and FANCD2/FANCI all respond to stalled replication forks, we examined the localization of HELQ-GFP expressed in NIH3T3 cells9. Sub-cellular fractionation revealed that HELQ-GFP is enriched on chromatin in response to replication fork stalling with either MMC or aphidicolin (APH), and this is compromised by ATR inhibition (Fig. 3g; Extended Data Fig. 5e-g).
To determine the possible underlying cause of the defect in HELQ-deficient cells we examined replication dynamics, indices of checkpoint activation, FA pathway activation, DSB formation, and the integrity of HR. Replication fork extension rates in HelQΔC/ΔC cells were significantly lower than in wild-type cells (Extended Data Fig. 6d, e) and this was exacerbated by treatment with CPT (Extended Data Fig. 6d). Replication fork tract asymmetry was also evident in mutants relative to controls indicative of increased fork stalling/collapse (Extended Data Fig. 6f, g).
Checkpoint activation as measured by phosphorylation of ATM, CHK1, CHK2, and γH2AX in response to DNA damage was unaffected by loss of HELQ in either mouse or human cells (Extended Data Fig. 7a-d). Furthermore, HELQ-deficient cells exhibited constitutive FANCD2 monoubiquitination indicating that HELQ is dispensable for this modification (Fig. 4a). Assessment of RAD51 recruitment to damaged replication forks revealed that RAD51 is enriched on chromatin in response to MMC treatment in HELQ-deficient mouse and human cells (Fig. 4b; Extended Data Fig. 7e, 8a) and RAD51, RPA and γH2AX accumulate in repair foci (Fig. 4c; Extended Data Fig. 7e-g). However, RAD51 and γH2AX persisted on chromatin and remained present in repair foci at later time points in HELQ-deficient mouse and human cells (Fig. 4b, c; Extended Data Fig. 7e,f), suggesting that the defect in the absence of HELQ occurs at a step downstream of RAD51 recruitment to damaged replication forks. Pulsed field gel electrophoresis revealed that DSBs form in HelQ and FancD2 single and double mutant cells after MMC, but these lesions persist at later time points indicating that DSBs induced at ICLs are not efficiently repaired (Fig. 4d). siRNA depletion of HELQ resulted in a 2- to 3-fold decrease in HR efficiency implicating HELQ in promoting HR (Fig. 4e; Extended Data Fig. 8b). Furthermore, clonogenic survival of HELQ-deficient mouse and human cells were significantly compromised in response to PARP inhibition, which is a hallmark of HR-deficient cells10 (Fig. 4f; Extended Data Fig. 8c). It is notable that the HELQ interacting protein and BCDX2 complex factor, RAD51D, is also required for PARPi resistance11.
Figure 4. HELQ influences DNA repair and HR efficiency.

a, Lysates from immortalized mouse cells, grown under physiological O2 and treated ± 3 μM APH for 6 hr, were probed for FANCD2. Wild-type (WT); HELQ-deficient (HQ); unmodified (S) and ubiquitinated (L) forms of FANCD2. b, Chromatin fractions from immortalized mouse cells, probed for RAD51, histone H3 and α-tubulin at the indicated time points (hr) following treatment with ± 100 ng/ml MMC. c, Left panel, representative images of RAD51 focus formation in immortalized mouse cells at the indicated time points (hr) following treatment with 1 μM MMC. Right panel, quantification of RAD51 foci at the indicated time points. d, Pulsed field gel electrophoresis of genomic DNA from immortalized cells treated ± 1 μM MMC for 1 hr and recovered for the indicated number of hr. Undamaged (un). Wells: intact DNA; arrow: band containing large chromosomal fragments (10-0.45 Mb); below arrow: smaller fragments, resolved by size. e, HR frequencies in DR-GFP reporter cells treated with the indicated siRNAs. f, Clonogenic survival assays of immortalized mouse cells exposed to PARPi.
In summary, our results uncover a critical role for HELQ in germ cell maintenance and tumour suppression in mammals, which we attribute to a role in replication-coupled DNA repair. The interaction between HELQ and the RAD51 paralog BCDX2 complex may provide molecular insight into the HELQ phenotype and its role in tumourigenesis, as the BCDX2 complex functions to promote replication-coupled HR, RAD51C has been implicated in an FA-like disorder12, and mutations in RAD51B and RAD51D are associated with hereditary ovarian cancer in humans11,13-18. These findings suggest HELQ as a strong candidate for screening in human cancers and also explain why mutations in D. melanogaster HELQ, RAD51, and the two RAD51 paralogs (spn-C, spn-A, spn-B and spn-D, respectively) confer a very similar phenotype19. Finally, our findings help to explain the prevalence of non-synonymous variants in HELQ, which are significantly associated with upper aerodigestive tract cancers, particularly amongst smokers20; and variants in HELQ associated with early menopause21, which may reflect the germ cell defects and ovarian dysgenesis observed in HELQ-deficient mice.
Methods
Mouse strains, maintenance, localization of genetrap, genotyping
All mice were housed and maintained according to the Home Office guidance outlined in the Animals Scientific Procedures Act. All strains were maintained on a mixed B6/129 background.
A commercially available ES cell clone (clone ID: RRF112, Bay Genomics, UC Davis) harbouring the trapped allele of HelQ was obtained. The position of the βgeo gene trap cassette from the pGT0LxF vector was determined via splinkerette PCR27 using a modified version of the method described in 28. Briefly, 3 μg genomic DNA from HelQ gene-trapped ES cells was digested overnight at 37°C with BfaI. Splinkerette primers were annealed in SuRE Buffer M (Roche) by heating to 95°C, followed by cooling by 1°C increments for 15 sec each. 40 pmol of the annealed splinkerette adaptor were ligated to 600 ng of BfaI-digested genomic DNA, followed by passage over a PCR purification column (Qiagen). The splinkerette adapted genomic DNA was redigested with BfaI for 1 hr (eliminating potential background due to splinkerette ligation to partially digested genomic DNA fragments) and repurified. Primary and nested PCRs were performed using genetrap and splinkerette specific primers, with 0.4% of the primary PCR used in the nested round. Nested PCR products were gel purified and sequenced using standard methods.
The HelQΔC mouse strain was generated using standard transgenic technology. For more background and discussion pertaining to this and other aspects of the manuscript, see Supplementary Information online. FANCD2-deficient mice were previously described8. Mice were identified using standard ear snip methods, and snips were utilized for genomic DNA preparation using the HotSHOT method29 for use in genotype PCR. HelQ wild-type, heterozygous and mutant mice were genotyped in a single reaction using the following primers: pGT0LxF_F2-CAGGGTTTTCCCAGTCACGAC (genetrap-specific primer), mHelQint11_F8-GTCCTTGTGCCCAAAGTACAG (wildtype-specific primer), mHelQint11_R5-CCTAGTGTGGCTTATCTCCTTCTTC (common primer). FancD2 mice were genotyped according to the previously described method8.
Breedings to establish Mendelian ratios and fertility consisted of continuously mated, individually housed pairs. The HelQ/FancD2 double mutant strain was established from mating of double heterozygous HelQ+/ΔC;FancD2+/− mice. Weights of HelQ mice were measured weekly starting at 10 d post-partum. The tumour watch cohort was established using littermate controls wherever possible and mice were regularly monitored for signs of deterioration using a scoring system that will be described in a separate publication. Mice were euthanized before terminal endpoints were reached.
Statistics
For survival study, sample size was estimated using standard power calculation methods in order to measure a difference of 3-4 months in survival between mutant and control groups. HelQ and HelQ/FancD2 matings, deviation from expected Mendelian ratios were tested by Chi-squared analysis (P>0.25 for both strains). For fertility analysis, the number of litters and pups were tested using Kruskal-Wallace analysis of variance. The Gaussian approximation of P-values indicated medians varied significantly between the groups (P=0.0019 for litters, P=0.0014 for pups). Dunn’s multiple comparison post-test was used to compare specific sample pairs. Results of P-value calculations for both litters and pups were the same, and are the values indicated on the graph (P<0.001 for control versus mutant pairs, P=ns for control versus male or female mutant pairs). For wildtype versus HelQ mutant testes weights, the Mann Whitney test was used to analyse whether the weights differed between the 2 groups. Gaussian approximation was used for calculation of the indicated P-value (P<0.0001). For wildtype and HelQ mutant testes weights versus age, linear regression was used to generate slopes of best fit lines which were tested for deviation of slope from 0. R2 and P-values indicated on the graph demonstrate that while there is a correlation between reduced testes weight and age in wildtype mice (P=0.0091), there is no correlation between testes weight and age for HelQ mutants (P=0.78). For spermatogonia numbers in wildtype versus HelQ mutant neonatal testes, the Mann Whitney test was used to analyse whether spermatogonia differed between the 2 groups. Gaussian approximation was used for calculation of the indicated P-value (P<0.0001). For MMC induced metaphase aberrations in wildtype versus HelQ mutant cell lines, the Mann Whitney test was used to analyse whether radial chromosomes per metaphase differed between the 2 groups (P<0.0001). For wildtype versus HelQ and FancD2 single and double mutant testes weights, the Kruskal-Wallace analysis of variance test was utilized. Gaussian approximation of the P-value indicated medians varied significantly between the groups (P<0.0001). Dunn’s multiple comparison post-test was used to compare specific sample pairs. Results of P-value calculations are indicated on the graph (P<0.001 for both wildtype versus FancD2 single mutant and wildtype versus HelQ/FancD2 double mutant). For MMC induced metaphase aberrations in wildtype versus HelQ and FancD2 single mutants and HelQ/FancD2 double mutants, the Kruskal-Wallace analysis of variance test was utilized. Gaussian approximation of the P-value indicated medians varied significantly between the groups (P<0.0001). Dunn’s multiple comparison post-test was used to compare specific sample pairs. Results of P-value calculations for MMC damaged samples are indicated on the graph (P<0.001 for wildtype versus single and double mutants, P<0.01 for HelQ mutants versus double mutants, and P=ns for HelQ versus FancD2 single mutants and for FancD2 mutants versus double mutants). For HELQ-GFP chromatin recruitment upon ATR inhibitor treatment, student’s T-test was performed to determine whether the observed differences are statistically significant. For DNA combing of replication tracts from wildtype versus HelQ mutant cells at atmospheric O2, and tracts from wildtype, HelQ and FancD2 single, and HelQ/FancD2 double mutants at physiological O2, the Kruskal-Wallace analysis of variance test was utilized. Gaussian approximation of the P-values indicated medians varied significantly between the groups (P<0.0001 for both experiments). Dunn’s multiple comparison post-test was used to compare specific sample pairs. Results of P-value calculations are indicated on the graphs (P<0.01 for wildtype versus HelQ mutants and for undamaged versus CPT damaged HelQ mutant cells; P<0.001 for wildtype versus single and double mutants). For wildtype versus HelQ mutant tumor watch, the Kaplan Meier epithelial and stromal tumor free survival curve was analysed with Mantel-Cox log-rank test for P-value calculation (P=0.009).
Histology, immunohistochemistry sample preparation and reagents
For all histology, samples were paraffin embedded and sectioned at 4 μm. Testes for histology were fixed in Bouin’s solution, Periodic acid-Schiff stained and hematoxylin counter-stained; all other tissues, including post-mortem tissues for analysis of tumour watch cohort, were fixed in 10% neutral buffered formalin (NBF) and stained with hematoxylin and eiosin (H&E).
Immunohistochemistry was carried out using standard methods. Briefly, testes for immunohistochemistry were NBF fixed and sections from adult mice were processed for C-Kit staining by microwaving in 0.01 M citrate buffer, pH 6 to unmask antigens. After incubation with c-Kit primary antibodies (Dako A4502, 1:600), samples were incubated with biotinylated secondary antibody (Vector) followed by incubation with Avidin Biotin Complex (Vector); slides were developed in DAB substrate (Vector) and counterstained in hematoxylin. Neonatal testis sections were similarly processed and labelled with antibodies against WT1 (Santa Cruz sc-192, 1:450).
Cell line derivation
Ear fibroblasts for primary and SV40 immortalized cultures were generated as follows: mice were euthanized and ear tissue was collected using sterile scissors, ear fragments were rinsed twice in 70% ethanol followed by two rinses in PBS supplemented with 100 μg/ml kanamycin. Tissue was transferred into 0.3 ml of protease solution (4 mg/ml each of collagenase D and dispase in DMEM; filter sterilized), and incubated at 37° for 45 min. 1.5 ml DMEM containing 10% FBS, 1× glutamine, and 5× antibiotic-antimycotic solution were added to protease solution containing ear fragments, and samples were incubated at 37°C overnight. Cells were dissociated by pipetting, passed through a 40-μm mesh cell strainer, and plated in DMEM as above except using 1× antibiotic-antimycotic solution. Cells were passaged upon reaching confluence to 5 dishes, and upon reaching confluence cells were frozen at passage 1 or used immediately for immortalization or experiments.
Fibroblasts were immortalized via transfection with a vector expressing SV40 large T-Antigen. Constitutively expressed HELQ-FLAG, FLAG, and ALC1-FLAG cell lines were generated using the 293 Flp-In system according to the manufacturer’s protocol (Invitrogen). NIH3T3 cells stably expressing GFP-tagged mouse HELQ (consisting of a BAC containing the entire HelQ promoter and genomic locus) were generated according to the BAC recombineering method previously described9. These and all other cell lines utilized in this study (293T, HeLa, NIH3T3 and U2OS) were grown in DMEM supplemented with 10% FBS and L-glutamine. Cells were grown in 5% CO2 incubators at atmospheric O2 concentrations (~21%) with noted exceptions where samples were cultured at physiological O2 concentrations (~5%).
For HELQ-GFP transient transfections in HeLa cells (Extended Data Fig. 3d), human HELQ was cloned into the pcDNA6.2/C-EmGFP-DEST vector using Gateway technology (Invitrogen). The vector was transfected into HeLa cells with Lipofectamine 2000 using the manufacturer’s protocol (Invitrogen). Live or PFA fixed cells (fixed cells were counterstained with DAPI) were visualized 48-96 hours post transfection under epifluorescence using a Zeiss Axio Imager M1 microscope with an ORCA-ER camera (Hamamatsu), and images were acquired using the Volocity software (Improvision, Perkin Elmer).
Clonogenic survival, metaphase spreads, growth, and micronuclei analyses
For all experiments, fibroblast lines established from littermates or siblings were utilized wherever possible. Experiments involving primary cells were conducted in physiological O2 using cell lines of similar passage number.
For clonogenic survival assays, SV40 immortalized mouse ear fibroblasts and siRNA-treated U2OS cells were plated in triplicate on 10 cm dishes at clonal density, allowed to adhere for 8-16 hr, and damage treatments administered (CPT medium was changed after 24 hr). After 8-10 d of growth, plates were rinsed, fixed/stained in 20% ethanol/4% crystal violet (w/v), rinsed in dH2O, and colonies tabulated. All results were normalized to untreated to adjust for plating efficiency and determine % survival. Survival experiments were carried out on at least 2 independent sets of mutant and control mouse cell lines, and in most cases cell lines were tested in at least two independent experiments. Similar results were obtained across all experiments and sets of cell lines.
For analysis of metaphase aberrations, SV40 immortalized cells were damaged as indicated and treated with colcemid (2×10⁻⁷ M) for 30 min, harvested, swelled in hypotonic solution (0.075 M KCl) for 7 min at 37°C, fixed and washed in ice-cold methanol-acetic acid (3:1), dropped on humid slides, and briefly steamed over a 65°C bath. Slides were dried, stained with Giemsa (Sigma) for 10 min, rinsed with distilled water, and coverslips were mounted (Permount, Fisher). For each sample, ≥40 spreads were scored.
Growth kinetics of primary cells were determined using a modified 3T3 protocol to calculate cumulative population doublings. Briefly, primary cells were harvested, counted and 150,000 cells reseeded in triplicate 10cm dishes every third day. Cumulative population doublings were calculated using the formula: Log10(N/N0) × 3.32, where N=number of cells harvested after growth and N0=number of cells seeded. Similar growth kinetics were obtained for 3 different mutant and control MEF and EF cell line pairs.
Micronuclei were examined by seeding SV40 immortalized EFs in 6 well dishes containing glass coverslips. The following day cells were fixed in 4% PFA and stained with DAPI. For each sample, ≥100 cells were scored.
Bone marrow protocols, antibodies/reagents, analysis
Bone marrow cells were harvested from 3- to 4-month-old control and HelQΔC/ΔC mice and analyzed for hematopoietic stem and progenitor cells (HSPCs) as previously described8,22. For LSK (Lineage-Sca-1+c-Kit+) staining, cells were stained in Hank’s balanced salt solution containing 2% FBS and 10 mM HEPES buffer (Gibco) using biotinylated-anti-lineage antibody cocktail (anti-Mac1α, Gr-1, Ter119, CD3e, CD4, and CD8a), PE-Cy-7-anti-Sca-1 antibody (clone E13-161.7), and APC-anti-c-Kit antibody (clone 2B8), followed by staining with PE-Streptavidin secondary antibody (all primary and secondary antibodies from BD Biosciences). The samples were acquired using a BD FACSAria high-speed sorter.
For CFU-C (colony-forming units in culture) assays, bone marrow cells were seeded in 12-well plates at a density of 7×10⁴ cells/well in mouse Methocult medium M3434 (StemCell Technologies) and hematopoietic colonies (CFU-Cs) were counted at 7-10 d after culture. CFU-C assays were used to determine the survival of bone marrow in presence of Mitomycin C. To determine the ex vivo clonal growth of murine HSPCs, a cobblestone area-forming cell (CAFC) assay was performed by a limiting dilution analysis of bone marrow in micro-cultures using the bone marrow stromal cell line FBMD-18,23. This assay quantifies a spectrum of hematopoietic cells that is well-validated to compare with other functional assays. Specifically, day 7 and day 14 CAFC correspond to early progenitor cells and to CFU-spleen-day 12 cells while the more primitive hematopoietic stem cells (HSCs) with long-term repopulating ability correspond to day 28 CAFC23.
Bone marrow transplantation was performed as described previously8. Briefly, bone marrow cells (5 × 10⁵) from control or HelQΔC/ΔC mice (CD45.2+) were mixed with 2.5 × 10⁵ bone marrow supporting cells from CD45.1+ congenic mice and transplanted into lethally irradiated CD45.1+ congenic recipient mice. The donor cell engraftment efficiency in the recipient mice, after 17 wk post-transplant, was determined by staining peripheral blood leukocytes with FITC-labeled anti-CD45.2 (clone 104) antibody. The percentage of donor-derived T cells, B cells and myeloid cells was determined by co-staining with PE-labeled anti-CD3e (clone 145-2C11), anti-B220 (clone RA3-6B2), and anti-Mac-1/Gr-1 antibodies (clones M1/70 and RB6-8C5), respectively, and analyzed on a FACScan instrument (Becton Dickinson, Franklin Lakes, NJ). All the antibodies were from BD Biosciences.
Mass spectrometry and proteomics
HELQ-FLAG and FLAG control cells were harvested and lysed in benzonaze lysis buffer (20 mM Tris-Cl pH 7.5, 75 mM NaCl, 10% glycerol, 2 mM MgCl2, 0.5% NP40, 30 U/ml benzonase, protease inhibitors). NaCl concentration was adjusted to 150 mM, EDTA to 3 mM, and lysates were cleared by centrifugation. Supernatants were precleared with Protein G agarose beads for 30 min at 4°C. Precleared lysates were incubated with anti-FLAG affinity agarose resin (Sigma) for 4 hr at 4°C. Beads were washed five times with wash buffer (20 mM Tris-Cl pH 7.5,150 mM NaCl, 3 mM EDTA, 0.5% NP40) and once with PBS. Bound proteins were eluted by boiling in SDS-PAGE sample buffer and eluates were resolved on NuPAGE Bis-Tris gels (Invitrogen) and stained with Sypro Ruby (Invitrogen). Gel slices were excised and processed for mass spectrometry using the Janus automated liquid handling system (PerkinElmer, U.K). Peptides were analysed by nano-scale capillary LC-ESI MS/MS, data were processed using Mascot Distiller (Matrix Science, U.K) and exported to Scaffold for viewing (Proteome Software, Inc.).
The Biological General Repository for Interaction Datasets (BioGRID, http://thebiogrid.org/), the Molecular INTeraction database (MINT, http://mint.bio.uniroma2.it/mint), and Search Tool for the Retrieval of Interacting Genes/Proteins database (STRING, http://string-db.org/) were used to compile the protein interaction network.
Cell lysates, in vitro binding assay and fractionation for western blot analyses
All cell lines used in this study were STR profiled and tested for mycoplasma infection prior to use. All lysis buffers were supplemented with protease inhibitor cocktail (Roche) and phosphatase inhibitors (Sigma).
For validation of mass spec data, HELQ-FLAG and FLAG expressing cells were utilized (this was due to our inability to validate these interactions using endogenous HELQ, stemming from the fact that it is expressed at very low levels in most human cell lines, and no antibodies were found to reliably IP the human version; validation using endogenous mouse HELQ was similarly hindered by a lack of reagents available for detection of the mouse RAD51 paralogs). Cells were lysed in the presence of benzonase and 2 mg of total protein were IPd with anti-FLAG affinity resin as above. Beads were washed, bound proteins eluted with 1× NuPAGE LDS sample buffer and analysed by western blot. Similar methods were employed using lysates prepared from 293T cells to examine endogenous HELQ or RAD51C coIPs.
For in vitro binding assays, HELQ-FLAG, ALC1-FLAG and FLAG cells were lysed in the presence of benzonase and pre-cleared lysate was used for FLAG IP as described above. FLAG immunocomplexed beads were then washed 4 times with a modified wash buffer containing 1 M NaCl to remove bound co-precipitates, and once with in vitro binding buffer (20 mM Tris-Cl pH 7.5, 280 mM NaCl, 3 mM EDTA, 0.5% NP40). Washed beads were incubated with recombinant Rad51 paralog BCDX2 complex (gift of S. West lab) in binding buffer for 4 hr at 4°C and washed 4 times with the same buffer. Eluates were analysed by western blot.
GFP-tagged HELQ was stably expressed in NIH3T3 cells using a BAC recombineering method to C-terminally FLAG/GFP tag the BAC containing full-length genomic HelQ, which included the endogenous promoter. This allowed HELQ-GFP to be expressed at physiological levels.
For chromatin fractionation of EFs and siRNA-treated U2OS cells, cells were treated ± 3 μM aphidicolin for 6 hr or ± 1 mM MMC for 24 hr, harvested and fractionated using a modified version of the method described in 26: pellets were resuspended in CSK buffer (10 mM PIPES, pH 6.8, 100 mM NaCl, 300 mM sucrose, 3 mM MgCl2, 1 mM EGTA, pH 7, 0.5% Triton X-100), incubated for 10 min on ice (a small fraction of this was removed and SDS-PAGE sample buffer was added to obtain WCEs), pelleted at low speed and supernatants reserved as soluble fraction. Pellets were washed in CSK buffer, and repelleted. Pellets were resuspended in benzonase CSK buffer (10 mM PIPES, pH 7.5, 100 mM NaCl, 300 mM sucrose, 3 mM MgCl2, 0.5% Triton X-100, 0.1 U/ul benzonase), lysates were incubated for 30 min at 37°C, pelleted and supernatants reserved for chromatin fraction. Pellets were resuspended in high salt CSK (recipe as above except NaCl was added to 500 mM), lysates were incubated 10 min on ice, cleared at high speed and supernatants pooled with benzonase CSK lysates to yield chromatin extracts. 25 μg of soluble and 10 μg of chromatin proteins were analyzed by western blotting.
Western blot, IP antibodies/reagents, and siRNA oligos
Precast NuPAGE Bis-Tris or Tris-acetate gels and electrophoresis system were by Invitrogen. Western blotting transfers were carried out in BioRad transblot chambers and all blots were blocked and probed in 5% milk-PBST with the exception of P-CHK1 blots, which were processed in 3% BSA-TBST. Mouse and rabbit HRP conjugated secondary antibodies were from ThermoFisher, and signals were visualized with ECL western blotting detection reagent (Amersham) or SuperSignal West Femto reagent (Thermoscientific).
Antibodies used for western blot analysis: FLAG (Sigma F1804, 1:2000), HELQ (Santa Cruz 81095, 1:200), HIS (Clontech 631212, 1:2000), PARP1 (Trevigen 4338-ML-50, 1:1000), CHK1 (Sigma C9358, 1:500), S345-P-CHK1 (Cell Signalling 2348, 1:500), CHK2/P-CHK2 (Upstate 05-649, 1:400), ATM (Sigma A1106, 1:2000), S1981-P-ATM (Cell signalling 4526, 1:1000), Histone H3 (Abcam 10799, 1:2000), α-Tubulin (Sigma T6199, 1:2000), RAD51 (Santa Cruz 8349, 1:200), FANCD2 (Epitomics 2986-1, 1:1000), γH2AX (Cell Signalling 2577, 1:1000), RPA32 (Abcam 12F3.3, 1:1000), BRCA2 (Santa Cruz 8326, 1:200), TFIIH p89 (Santa Cruz 293, 1:200). All RAD51 paralog antibodies were a kind gift from S. West laboratory, as described in 30: RAD51B (IH3 mouse mAb, 1:500), RAD51C (2H11 mAb, 1:500), RAD51D (5B3 mouse mAb, 1:400), XRCC2 (7B7 mouse mAb, 1:400), XRCC3 (10F1 mouse mAb, 1:400).
Antibodies used for immunoprecipitation: RAD51C (R68 rabbit pAb), XRCC3 (10F1 mouse mAb), mouse IgG (Abcam 18413) and rabbit IgG (Abcam 46540) were used where appropriate as negative control IPs.
siRNA oligos: RAD5131 AAGGGAAUUAGUGAAGCCAAA, BRCA232 AACAACAAUUACGAACCAAAC. siRNA oligos used in the DR-GFP and in HELQ_1 (this study) GAAGGUCCAAUAUAAUU, HELQ_3 (this study) AAUGUGAGGUGAUUAAGAA, HELQ_M33 CAAAGGAAGATTTCCTCCAACTAAA. HelQ-01 GUUUGAAGAUUGCAACGAA, HelQ-03 AAUGUGAGGUGAUUAAGAA, HelQ-04 GGUAGAAGAGUUACUAAGA, HelQ-17 GUUUGAAGAUUGCAACGAA, Xrcc2 CAGGGTACTACGCAAGCCT, Xrcc3 CAGAATTATTGCTGCAATT, Rad51C AAGAGAATGTCTCACAAAT, Rad51D CTGGGTGGAAATAAGCTTA.
siRNA transfection, ATR inhibition
U2OS cells were subjected to two rounds of reverse transfections using siGENOME siRNA and Dharmafect1 (Thermofisher) according to the manufacturer’s protocol. 36 hr after the second transfection, cells were treated for 14 hr with 3 μM aphidicolin. For ATR inhibition, 3 μM ATR inhibitor was added to cultures 30 min prior to aphidicolin treatment.
Immunofluorescence
Cells were first washed in PBS and then fixed with 2% paraformaldehyde (PFA) at RT for 15 min, and then wash three times in PBS. The fixed cells were further permeabilized with 3% BSA in PBS + 0.1% Triton X-100 for 30 min at RT. Primary antibodies (Rad51; 1:500, RPA; 1:1000, γH2AX) were added and incubated at 37°C for 1 hr. After washing with PBS + 0.1% Triton X-100, secondary antibodies (provided by Jackson ImmunoResearch) were applied and incubated for 1 hr in the dark. The stained cover slips were mounted with prolong Gold Antifade reagent (Invitrogen). Imaging was carried out using Axio Imager (Zeiss) or Axioplan 2 Imaging (Zeiss) microscope and analyzed by Axiovision software (Zeiss).
HR reporter assays
DSB repair efficiency by HR was measured in DR-GFP U2OS cells as described previously34. In brief, 48 hr after the first round of siRNA transfection (40 nM) using Lipofectamine RNAiMAX (Invitrogen), cells were either mock-transfected (pcDNA3.1) or transfected with 0.6 μg of an I-SceI expression plasmid (pCBASce) together with siRNA (20 nM) using 3.6 μl of Lipofectamine 2000 (Invitrogen). The media was replaced 3 hr after I-SceI transfection and cells were analysed for GFP expression by flow cytometry on a Cyan ADP (Dako) 72 hr after I-SceI transfection. To confirm siRNA efficiency, western blotting was carried out on 50 μg of NP-40 lysates + sonication run on 4-15% Precast SDS-PAGE gels (Bio-Rad).
DNA combing
Replication tracts were labelled for 20 min with 20 μM IdU (in atmospheric O2 experiments, cells were treated ± 2.5 μM CPT for the final 15 min of IdU labelling to test replication fork stalling/restart), washed 3 times with PBS, and labelled for 20 min with 200 μM CldU. Cells were washed, harvested on ice, counted, and embedded in agarose. Cells were digested in 2-3 changes of proteinase K buffer for 24 hr at 50°C. Plugs were washed 5×10 min in TE followed by β-agarase digestion overnight at 42°C. Genomic DNA was combed onto silanized coverslips (Genomic Vision) using a Molecular Combing System instrument (Genomic Vision), dried and stained using previously described methods35. Experiments were conducted on 2 separate sets of mutant and control cell lines with similar results obtained for both experiments.
PFGE
Immortalized EFs were treated ± MMC for 1 hr and then allowed to recover for 16-48 hr. Cells were harvested and processed for PFGE analysis similar to previously described methods24. Briefly, cell suspensions were placed on ice, cell numbers counted and equivalent cell numbers or each genotype were embedded in agarose plugs in duplicate. Cells were digested by incubating plugs in proteinase K overnight at 50°C, plugs were washed 4×1 hr, sealed with low melting point agarose into the well of a 1% agarose/0.5× TBE pulsed field gel, and run for 24 hr on a Gene Navigator pulsed field gel electrophoresis apparatus (Amersham) using the following conditions: running temperature: 13°C; running angle: 120° (hex electrode); connection setup: interpolation (phase 1 of 2: N/S 30 sec, E/W 30 sec, phase time 23 hr; phase 2 of 2: N/S 5 sec, E/W 5 sec); power program: 180V 15 min, 170V 30 min, 160V 1 hr, 150V 2 hr, 140V 4 hr, 130V 8 hr, 120V 7 hr. Gels were post-stained with ethidium bromide and washed in 0.5× TBE. PFGE was carried out on 2 independent sets of mutant and control cell lines and results were repeated 2 or more times for each set of cell lines. Similar results were obtained across all experiments and sets of cell lines.
Supplementary Material
Extended Data Figure 1 | A mouse model of HELQ deficiency. a, Schematic of the β-geo gene trap and its approximate location within the HelQ genomic locus. b, Sequence and traces showing the exact location of the gentrap insertion as determined by sequencing of splinkerette PCR products. c, HELQ western blot from wild-type (+/+) and HelQ mutant (ΔC/ΔC) mouse cells showing loss of HELQ and absence of a HELQ-Bgal fusion protein (which, if present, would be evident in the region of the blot marked with the red bar). d, Table of observed and expected Mendelian ratios calculated from heterozygous matings. Chi-squared analysis was used to test for deviation of observed from expected. e, Average weights of HelQ mice tracked between 2 and 12 wk of age. Means of 5-13 mice for each group are shown, and for clarity, SD’s are not plotted. Differences are not significant. f, Table of ovarian pathology in 30-week-old HelQ control and mutant females (black text) and heterozygous tumour watch females (blue text, 17- to 21-months-old). g-l, Histological sections of testes from HelQΔC/ΔC males showing various degrees of atrophy including: normal tubules (g); mild atrophy (h, i), pockets of atrophy (arrows), pyknotic nuclei (*); moderate atrophy (j, k), missing spermatogenic layer (arrowheads); and severe atrophy (l), with only Sertoli cells present.
Extended Data Figure 2 | A mouse model of HELQ deficiency. a, Immunohistochemical analysis of adult testes labelled with the stem cell marker c-Kit (brown) to highlight spermatogonia, and counterstained with hematoxylin to visualize remaining cells in the tubule (blue). Two representative images from wild-type (left column) and mutant mice (right column) are shown, with red circles indicating c-Kit+ cells. The number of c-Kit+ cells for each panel is indicated in the lower right corner. Boxed regions in top panels are magnified in bottom panels to demonstrate staining. Sertoli cells (S), c-Kit+ spermatogonia (sg). b, Tabulation of average c-Kit+ cells per tubule normalized to the number of Sertoli cells. c, Testis weights plotted by mouse age in days. Linear regression used to generate slope of best fit line; tested best fit line for deviation of slope from 0: R2 and P-values are indicated revealing no correlation between age and testes weight for HelQ mutants. d, Table of tumour frequency and tumour spectrum of HelQ mutant and control mice showing data for all mice, females, and males in the tumour watch cohort. 129/B6 background phenomena are coloured in grey text, HelQ mutant-specific effects are in black, and female-specific pathology is highlighted in pink.
Extended Data Figure 3 | A mouse model of HELQ deficiency. a, The frequency of liver steatosis in all mice, and inflammation and activated mammary tissue in female mice. b-f, Ovary sections showing normal wild-type ovary (b) and common ovarian pathology in mutant animals (c-f). Low power (c) and high power (d) images of dysgenic ovary from a HelQ mutant exhibiting a sex cord stromal tumour containing tubular-like structures. Low power (e) and high power (f) images of large nodular granulosa cell tumor from a HelQ mutant; mitotic figures (arrowheads, f). g-j, Pituitary sections showing low power (g) and high power (h) images of normal wild-type pituitary. Low power (i) and high power (j) images of pituitary tumor from a HelQ mutant mouse; boundary where large, haemorrhagic pituitary adenoma compresses overlying brain (arrows, h).
Extended Data Figure 4 | Characterization of HelQΔC/ΔC bone marrow and generation of HelQ;FancD2 double mutant offspring. a, HelQΔC/ΔC and control bone marrow cells were isolated and exposed to MMC at the indicated doses and clonogenic survival of hematopoietic progenitors was plotted as % of surviving cells relative to untreated. Means +/− SEM for 3 mice per genotype are shown. b-i, Bone marrow (BM) from mutant and control mice was isolated and subjected to various hematopoietic stem and progenitor cell analyses: (b, c) tabulation of bone marrow LSK (Lineage- Sca-1+ C-Kit+) cell populations; (d) bone marrow CFU-Cs (colony-forming units in culture); (e) bone marrow day 28 CAFCs (cobblestone area-forming cells); and total donor derived leukocyte (f), myeloid (g) and lymphoid (h, i) engraftment upon bone marrow transplantation. Raw data (symbols) and means (horizontal lines) from 3 mice are plotted (b, c, e); means +/− SEM for 3 mice per genotype (d); and means +/− SEM for 6-10 recipients for each genotype (f-i). j, siRNA-treated U2OS cells were plated for clonogenic survival and treated with the indicated reagents. k, Observed and expected Mendelian ratios calculated from HelQ+/ΔC; FancD2+/− double heterozygous matings. Chi-square analysis was used to test for deviation of observed from expected.
Extended Data Figure 5 | HELQ mass spectrometry, its relationship with the RAD51 paralogs, ATR, and overexpression. a, HELQ purification scheme and SDS-PAGE gel showing proteins co-purified with HELQ-FLAG and control FLAG IPs. b, Cells treated with the indicated siRNAs were harvested and probed for HELQ and the RAD51 paralogs. c, XRCC3 IPd from HELQ-FLAG and FLAG control cell lysates and probed for FLAG, XRCC3 and RAD51C (positive XRCC3 interacting protein control). IgG was used as a negative IP control. d, HeLa cells transiently expressing recombinant HELQ-GFP (green panels) fixed and stained with DAPI (blue panels) to identify nuclei. Two examples of spontaneous nuclear aggregation patterns are shown: small focal aggregates (right) and large filamentous aggregates (left). e, Chromatin fractions of HELQ-GFP cells treated ± 2 μM APH for 24 hr. f, Cells treated as in (e), ± 3 mM ATR inhibitor (ATRi). Quantification of HELQ in chromatin fractions normalized to H3 (right graph). g, Cells treated ± 100 ng/ml MMC for 24 hr and fractionated as in (e)
Extended Data Figure 6 | Spontaneous defects, checkpoint indices, damage foci and clonogenic survival of HELQ-deficient cells. a, Primary HelQ mutant and control cell lines were grown in physiological oxygen for the indicated number of days and passaged regularly to generate a cumulative population doubling (CPD) curve. Means +/− SD of triplicate replicas are shown. b, c, HelQ mutant and control cells grown on coverslips were formaldehyde fixed and DAPI stained to determine levels of spontaneous micronuclei formation: percent of 100 cells exhibiting 1 or more micronucleus (b); representative images (c), micronuclei (arrows). d, e, DNA combing used to calculate replication fork rates of primary cells grown under atmospheric (d) or physiological (e) O2. Cells in (d) treated ± 2.5 μM CPT for 15 min during labelling. f, Examples of origin containing IdU (green) and CldU (red) labelled fibers. g, Right versus left replication tract lengths to determine fork asymmetry (defined as tracts falling outside the inter-quartile lines).
Extended Data Figure 7 | a, b, Immortalized HelQΔC/ΔC and HelQ+/+ cells treated ± 500 ng/ml MMC (h) or 50 nM CPT (i) for 20 hr and probed for the indicated checkpoint indices. c, Primary wild-type (WT), HELQ-deficient (HQ) and FANCD2-deficient (D2) cells were left untreated (−), or exposed to 5 Gy IR and harvested 30 min post, or 3 μM APH for 16 hr and harvested 10 min post, and lysates were probed for the indicated checkpoint indices. d, Phospho-Ser345 CHK1 levels in U2OS cells subjected to 1 μM MMC for 24 hr. e, Immortalized mouse cells were treated with 1 μM MMC for 24 hr, allowed to recover for the indicated times (hr), and stained for γH2AX. f, Quantitation of % positive cells from (e). g, RPA32 and RAD51 foci formation in U2OS cells ± 1 μM MMC for 24 hr subjected to control and HELQ siRNA.
Extended Data Figure 8 | a, U2OS cells treated ± 100 ng/ml MMC for 24 hr, allowed to recover for the indicated times (hr), fractionated and probed for RAD51; H4 and α-tubulin are shown as controls for chromatin fractionation. b, DR-GFP reporter cells treated with the indicated siRNAs were probed for BRCA2, HELQ, and RAD51; TFIIH is shown as a loading control. c, siRNA-treated U2OS cells were plated for clonogenic survival and treated with the indicated reagents.
Acknowledgments
We wish to thank S. West for purified BCDX2 complexes and antibody reagents; Ó. Fernández-Capetillo for ATR inhibitors; D. Cox, G. Martin and H. Chapman for assistance with mouse breeding and maintenance; E. Nye, T. Bunting, and B. Spencer-Dene for histopathology services; I. Rosewell for transgenic services; H. Flynn for mass spectrometry services; M. Petalcorin for assistance with BAC recombineering. O.M. and A.A.S. are supported by grants of the Swiss National Science Foundation (PDFMP3_127523) and the Vontobel Foundation. The lab of A.D. is supported by NIH grant R01-DK43889. The labs of S.J.B. and C.S. are funded by Cancer Research UK. The S.J.B. lab is also funded by an ERC advanced investigator grant (RecMitMei). S.J.B. is a Royal Society Wolfson Research Merit Award holder. The authors state no competing interests.
References
- 1.Kim H, D’Andrea AD. Regulation of DNA cross-link repair by the Fanconi anemia/BRCA pathway. Genes Dev. 2012;26:1393–1408. doi: 10.1101/gad.195248.112. [DOI] [PMC free article] [PubMed] [Google Scholar]
- 2.Kottemann MC, Smogorzewska A. Fanconi anaemia and the repair of Watson and Crick DNA crosslinks. Nature. 2013;493:356–363. doi: 10.1038/nature11863. [DOI] [PMC free article] [PubMed] [Google Scholar]
- 3.Boyd JB, Golino MD, Shaw KE, Osgood CJ, Green MM. Third-chromosome mutagen-sensitive mutants of Drosophila melanogaster. Genetics. 1981;97:607–623. doi: 10.1093/genetics/97.3-4.607. [DOI] [PMC free article] [PubMed] [Google Scholar]
- 4.Muzzini DM, Plevani P, Boulton SJ, Cassata G, Marini F. Caenorhabditis elegans POLQ-1 and HEL-308 function in two distinct DNA interstrand cross-link repair pathways. DNA Repair (Amst) 2008;7:941–950. doi: 10.1016/j.dnarep.2008.03.021. [DOI] [PubMed] [Google Scholar]
- 5.Richards JD, et al. Structure of the DNA repair helicase hel308 reveals DNA binding and autoinhibitory domains. J. Biol. Chem. 2008;283:5118–5126. doi: 10.1074/jbc.M707548200. [DOI] [PMC free article] [PubMed] [Google Scholar]
- 6.Ward JD, et al. Overlapping mechanisms promote postsynaptic RAD-51 filament disassembly during meiotic double-strand break repair. Mol. Cell. 2010;37 doi: 10.1016/j.molcel.2009.12.026. [DOI] [PubMed] [Google Scholar]
- 7.Parmar K, D’Andrea A, Niedernhofer LJ. Mouse models of Fanconi anemia. Mutat. Res. 2009;668:133–140. doi: 10.1016/j.mrfmmm.2009.03.015. [DOI] [PMC free article] [PubMed] [Google Scholar]
- 8.Parmar K, et al. Hematopoietic stem cell defects in mice with deficiency of Fancd2 or Usp1. Stem Cells. 2010;28:1186–1195. doi: 10.1002/stem.437. [DOI] [PMC free article] [PubMed] [Google Scholar]
- 9.Poser I, et al. BAC TransgeneOmics: a high-throughput method for exploration of protein function in mammals. Nature Meth. 2008;5:409–415. doi: 10.1038/nmeth.1199. [DOI] [PMC free article] [PubMed] [Google Scholar]
- 10.Huehls AM, Wagner JM, Huntoon CJ, Karnitz LM. Identification of DNA repair pathways that affect the survival of ovarian cancer cells treated with a poly(ADP-ribose) polymerase inhibitor in a novel drug combination. Molec. Pharmacol. 2012;82:767–776. doi: 10.1124/mol.112.080614. [DOI] [PMC free article] [PubMed] [Google Scholar]
- 11.Loveday C, et al. Germline mutations in RAD51D confer susceptibility to ovarian cancer. Nature Genet. 2011;43:879–882. doi: 10.1038/ng.893. [DOI] [PMC free article] [PubMed] [Google Scholar]
- 12.Vaz F, et al. Mutation of the RAD51C gene in a Fanconi anemia-like disorder. Nature Genet. 2010;42:406–409. doi: 10.1038/ng.570. [DOI] [PubMed] [Google Scholar]
- 13.Meindl A, et al. Germline mutations in breast and ovarian cancer pedigrees establish RAD51C as a human cancer susceptibility gene. Nature Genet. 2010;42 doi: 10.1038/ng.569. [DOI] [PubMed] [Google Scholar]
- 14.Loveday C, et al. Germline RAD51C mutations confer susceptibility to ovarian cancer. Nature Genet. 2012;44:475–476. doi: 10.1038/ng.2224. author reply 476. [DOI] [PubMed] [Google Scholar]
- 15.Vuorela M, et al. Further evidence for the contribution of the RAD51C gene in hereditary breast and ovarian cancer susceptibility. Breast Cancer Research Treatment. 2011;130:1003–1010. doi: 10.1007/s10549-011-1677-x. [DOI] [PubMed] [Google Scholar]
- 16.Pelttari LM, et al. RAD51C is a susceptibility gene for ovarian cancer. Hum Mol Genet. 2011;20:3278–3288. doi: 10.1093/hmg/ddr229. [DOI] [PubMed] [Google Scholar]
- 17.Wickramanyake A, et al. Loss of function germline mutations in RAD51D in women with ovarian carcinoma. Gynecologic Oncology. 2012;127:552–555. doi: 10.1016/j.ygyno.2012.09.009. [DOI] [PMC free article] [PubMed] [Google Scholar]
- 18.Osher DJ, et al. Mutation analysis of RAD51D in non-BRCA1/2 ovarian and breast cancer families. Br. J. Cancer. 2012;106:1460–1463. doi: 10.1038/bjc.2012.87. [DOI] [PMC free article] [PubMed] [Google Scholar]
- 19.Gonzalez-Reyes A, Elliott H, St Johnston D. Oocyte determination and the origin of polarity in Drosophila: the role of the spindle genes. Development. 1997;124:4927–4937. doi: 10.1242/dev.124.24.4927. [DOI] [PubMed] [Google Scholar]
- 20.McKay JD, et al. A genome-wide association study of upper aerodigestive tract cancers conducted within the INHANCE consortium. PLoS Genet. 2011;7:e1001333. doi: 10.1371/journal.pgen.1001333. [DOI] [PMC free article] [PubMed] [Google Scholar]
- 21.Stolk L, et al. Meta-analyses identify 13 loci associated with age at menopause and highlight DNA repair and immune pathways. Nature Genet. 2012;44:260–268. doi: 10.1038/ng.1051. [DOI] [PMC free article] [PubMed] [Google Scholar]
- 22.Ceccaldi R, et al. Bone marrow failure in Fanconi anemia is triggered by an exacerbated p53/p21 DNA damage response that impairs hematopoietic stem and progenitor cells. Cell Stem Cell. 2012;11:36–49. doi: 10.1016/j.stem.2012.05.013. [DOI] [PMC free article] [PubMed] [Google Scholar]
- 23.Ploemacher RE, van der Sluijs JP, van Beurden CA, Baert MR, Chan PL. Use of limiting-dilution type long-term marrow cultures in frequency analysis of marrow-repopulating and spleen colony-forming hematopoietic stem cells in the mouse. Blood. 1991;78:2527–2533. [PubMed] [Google Scholar]
- 24.Hanada K, et al. The structure-specific endonuclease Mus81-Eme1 promotes conversion of interstrand DNA crosslinks into double-strands breaks. EMBO J. 2006;25:4921–4932. doi: 10.1038/sj.emboj.7601344. [DOI] [PMC free article] [PubMed] [Google Scholar]
- 25.Aygun O, Svejstrup J, Liu Y. A RECQ5-RNA polymerase II association identified by targeted proteomic analysis of human chromatin. Proc. Natl Acad. Sci. USA. 2008;105:8580–8584. doi: 10.1073/pnas.0804424105. [DOI] [PMC free article] [PubMed] [Google Scholar]
- 26.Mirzoeva OK, Petrini JH. DNA replication-dependent nuclear dynamics of the Mre11 complex. Molec. Cancer Res. 2003;1:207–218. [PubMed] [Google Scholar]
Additional Methods References
- 27.Horn C, et al. Splinkerette PCR for more efficient characterization of gene trap events. Nature Genet. 2007;39:933–934. doi: 10.1038/ng0807-933. [DOI] [PubMed] [Google Scholar]
- 28.Dupuy AJ, Fritz S, Largaespada DA. Transposition and gene disruption in the male germline of the mouse. Genesis. 2001;30:82–88. doi: 10.1002/gene.1037. [DOI] [PubMed] [Google Scholar]
- 29.Truett GE, et al. Preparation of PCR-quality mouse genomic DNA with hot sodium hydroxide and tris (HotSHOT) BioTechniques. 2000;29:52, 54. doi: 10.2144/00291bm09. [DOI] [PubMed] [Google Scholar]
- 30.Masson JY, Stasiak AZ, Stasiak A, Benson FE, West SC. Complex formation by the human RAD51C and XRCC3 recombination repair proteins. Proc. Natl Acad. Sci. USA. 2001;98:8440–8446. doi: 10.1073/pnas.111005698. [DOI] [PMC free article] [PubMed] [Google Scholar]
- 31.Kratz K, et al. Deficiency of FANCD2-associated nuclease KIAA1018/FAN1 sensitizes cells to interstrand crosslinking agents. Cell. 2010;142:77–88. doi: 10.1016/j.cell.2010.06.022. [DOI] [PubMed] [Google Scholar]
- 32.Bruun D, et al. siRNA depletion of BRCA1, but not BRCA2, causes increased genome instability in Fanconi anemia cells. DNA Repair (Amst) 2003;2:1007–1013. doi: 10.1016/s1568-7864(03)00112-5. [DOI] [PubMed] [Google Scholar]
- 33.Moldovan GL, et al. DNA polymerase POLN participates in cross-link repair and homologous recombination. Mol. Cell. Biol. 2010;30:1088–1096. doi: 10.1128/MCB.01124-09. [DOI] [PMC free article] [PubMed] [Google Scholar]
- 34.Gunn A, Stark JM. I-SceI-based assays to examine distinct repair outcomes of mammalian chromosomal double strand breaks. Meth. Mol. Biol. 2012;920:379–391. doi: 10.1007/978-1-61779-998-3_27. [DOI] [PubMed] [Google Scholar]
- 35.Seiler JA, Conti C, Syed A, Aladjem MI, Pommier Y. The intra-S-phase checkpoint affects both DNA replication initiation and elongation: single-cell and -DNA fiber analyses. Mol. Cell. Biol. 2007;27:5806–5818. doi: 10.1128/MCB.02278-06. [DOI] [PMC free article] [PubMed] [Google Scholar]
Associated Data
This section collects any data citations, data availability statements, or supplementary materials included in this article.
Supplementary Materials
Extended Data Figure 1 | A mouse model of HELQ deficiency. a, Schematic of the β-geo gene trap and its approximate location within the HelQ genomic locus. b, Sequence and traces showing the exact location of the gentrap insertion as determined by sequencing of splinkerette PCR products. c, HELQ western blot from wild-type (+/+) and HelQ mutant (ΔC/ΔC) mouse cells showing loss of HELQ and absence of a HELQ-Bgal fusion protein (which, if present, would be evident in the region of the blot marked with the red bar). d, Table of observed and expected Mendelian ratios calculated from heterozygous matings. Chi-squared analysis was used to test for deviation of observed from expected. e, Average weights of HelQ mice tracked between 2 and 12 wk of age. Means of 5-13 mice for each group are shown, and for clarity, SD’s are not plotted. Differences are not significant. f, Table of ovarian pathology in 30-week-old HelQ control and mutant females (black text) and heterozygous tumour watch females (blue text, 17- to 21-months-old). g-l, Histological sections of testes from HelQΔC/ΔC males showing various degrees of atrophy including: normal tubules (g); mild atrophy (h, i), pockets of atrophy (arrows), pyknotic nuclei (*); moderate atrophy (j, k), missing spermatogenic layer (arrowheads); and severe atrophy (l), with only Sertoli cells present.
Extended Data Figure 2 | A mouse model of HELQ deficiency. a, Immunohistochemical analysis of adult testes labelled with the stem cell marker c-Kit (brown) to highlight spermatogonia, and counterstained with hematoxylin to visualize remaining cells in the tubule (blue). Two representative images from wild-type (left column) and mutant mice (right column) are shown, with red circles indicating c-Kit+ cells. The number of c-Kit+ cells for each panel is indicated in the lower right corner. Boxed regions in top panels are magnified in bottom panels to demonstrate staining. Sertoli cells (S), c-Kit+ spermatogonia (sg). b, Tabulation of average c-Kit+ cells per tubule normalized to the number of Sertoli cells. c, Testis weights plotted by mouse age in days. Linear regression used to generate slope of best fit line; tested best fit line for deviation of slope from 0: R2 and P-values are indicated revealing no correlation between age and testes weight for HelQ mutants. d, Table of tumour frequency and tumour spectrum of HelQ mutant and control mice showing data for all mice, females, and males in the tumour watch cohort. 129/B6 background phenomena are coloured in grey text, HelQ mutant-specific effects are in black, and female-specific pathology is highlighted in pink.
Extended Data Figure 3 | A mouse model of HELQ deficiency. a, The frequency of liver steatosis in all mice, and inflammation and activated mammary tissue in female mice. b-f, Ovary sections showing normal wild-type ovary (b) and common ovarian pathology in mutant animals (c-f). Low power (c) and high power (d) images of dysgenic ovary from a HelQ mutant exhibiting a sex cord stromal tumour containing tubular-like structures. Low power (e) and high power (f) images of large nodular granulosa cell tumor from a HelQ mutant; mitotic figures (arrowheads, f). g-j, Pituitary sections showing low power (g) and high power (h) images of normal wild-type pituitary. Low power (i) and high power (j) images of pituitary tumor from a HelQ mutant mouse; boundary where large, haemorrhagic pituitary adenoma compresses overlying brain (arrows, h).
Extended Data Figure 4 | Characterization of HelQΔC/ΔC bone marrow and generation of HelQ;FancD2 double mutant offspring. a, HelQΔC/ΔC and control bone marrow cells were isolated and exposed to MMC at the indicated doses and clonogenic survival of hematopoietic progenitors was plotted as % of surviving cells relative to untreated. Means +/− SEM for 3 mice per genotype are shown. b-i, Bone marrow (BM) from mutant and control mice was isolated and subjected to various hematopoietic stem and progenitor cell analyses: (b, c) tabulation of bone marrow LSK (Lineage- Sca-1+ C-Kit+) cell populations; (d) bone marrow CFU-Cs (colony-forming units in culture); (e) bone marrow day 28 CAFCs (cobblestone area-forming cells); and total donor derived leukocyte (f), myeloid (g) and lymphoid (h, i) engraftment upon bone marrow transplantation. Raw data (symbols) and means (horizontal lines) from 3 mice are plotted (b, c, e); means +/− SEM for 3 mice per genotype (d); and means +/− SEM for 6-10 recipients for each genotype (f-i). j, siRNA-treated U2OS cells were plated for clonogenic survival and treated with the indicated reagents. k, Observed and expected Mendelian ratios calculated from HelQ+/ΔC; FancD2+/− double heterozygous matings. Chi-square analysis was used to test for deviation of observed from expected.
Extended Data Figure 5 | HELQ mass spectrometry, its relationship with the RAD51 paralogs, ATR, and overexpression. a, HELQ purification scheme and SDS-PAGE gel showing proteins co-purified with HELQ-FLAG and control FLAG IPs. b, Cells treated with the indicated siRNAs were harvested and probed for HELQ and the RAD51 paralogs. c, XRCC3 IPd from HELQ-FLAG and FLAG control cell lysates and probed for FLAG, XRCC3 and RAD51C (positive XRCC3 interacting protein control). IgG was used as a negative IP control. d, HeLa cells transiently expressing recombinant HELQ-GFP (green panels) fixed and stained with DAPI (blue panels) to identify nuclei. Two examples of spontaneous nuclear aggregation patterns are shown: small focal aggregates (right) and large filamentous aggregates (left). e, Chromatin fractions of HELQ-GFP cells treated ± 2 μM APH for 24 hr. f, Cells treated as in (e), ± 3 mM ATR inhibitor (ATRi). Quantification of HELQ in chromatin fractions normalized to H3 (right graph). g, Cells treated ± 100 ng/ml MMC for 24 hr and fractionated as in (e)
Extended Data Figure 6 | Spontaneous defects, checkpoint indices, damage foci and clonogenic survival of HELQ-deficient cells. a, Primary HelQ mutant and control cell lines were grown in physiological oxygen for the indicated number of days and passaged regularly to generate a cumulative population doubling (CPD) curve. Means +/− SD of triplicate replicas are shown. b, c, HelQ mutant and control cells grown on coverslips were formaldehyde fixed and DAPI stained to determine levels of spontaneous micronuclei formation: percent of 100 cells exhibiting 1 or more micronucleus (b); representative images (c), micronuclei (arrows). d, e, DNA combing used to calculate replication fork rates of primary cells grown under atmospheric (d) or physiological (e) O2. Cells in (d) treated ± 2.5 μM CPT for 15 min during labelling. f, Examples of origin containing IdU (green) and CldU (red) labelled fibers. g, Right versus left replication tract lengths to determine fork asymmetry (defined as tracts falling outside the inter-quartile lines).
Extended Data Figure 7 | a, b, Immortalized HelQΔC/ΔC and HelQ+/+ cells treated ± 500 ng/ml MMC (h) or 50 nM CPT (i) for 20 hr and probed for the indicated checkpoint indices. c, Primary wild-type (WT), HELQ-deficient (HQ) and FANCD2-deficient (D2) cells were left untreated (−), or exposed to 5 Gy IR and harvested 30 min post, or 3 μM APH for 16 hr and harvested 10 min post, and lysates were probed for the indicated checkpoint indices. d, Phospho-Ser345 CHK1 levels in U2OS cells subjected to 1 μM MMC for 24 hr. e, Immortalized mouse cells were treated with 1 μM MMC for 24 hr, allowed to recover for the indicated times (hr), and stained for γH2AX. f, Quantitation of % positive cells from (e). g, RPA32 and RAD51 foci formation in U2OS cells ± 1 μM MMC for 24 hr subjected to control and HELQ siRNA.
Extended Data Figure 8 | a, U2OS cells treated ± 100 ng/ml MMC for 24 hr, allowed to recover for the indicated times (hr), fractionated and probed for RAD51; H4 and α-tubulin are shown as controls for chromatin fractionation. b, DR-GFP reporter cells treated with the indicated siRNAs were probed for BRCA2, HELQ, and RAD51; TFIIH is shown as a loading control. c, siRNA-treated U2OS cells were plated for clonogenic survival and treated with the indicated reagents.