Abstract
Atherosclerosis is a vascular disease caused by inflammation of the arterial wall, which results in the accumulation of low-density lipoprotein (LDL) cholesterol, monocytes, macrophages and fat-laden foam cells at the place of the inflammation. This process is commonly referred to as plaque formation. The evolution of the atherosclerosis disease, and in particular the influence of wall shear stress on the growth of atherosclerotic plaques, is still a poorly understood phenomenon. This work presents a mathematical model to reproduce atheroma plaque growth in coronary arteries. This model uses the Navier–Stokes equations and Darcy's law for fluid dynamics, convection–diffusion–reaction equations for modelling the mass balance in the lumen and intima, and the Kedem–Katchalsky equations for the interfacial coupling at membranes, i.e. endothelium. The volume flux and the solute flux across the interface between the fluid and the porous domains are governed by a three-pore model. The main species and substances which play a role in early atherosclerosis development have been considered in the model, i.e. LDL, oxidized LDL, monocytes, macrophages, foam cells, smooth muscle cells, cytokines and collagen. Furthermore, experimental data taken from the literature have been used in order to physiologically determine model parameters. The mathematical model has been implemented in a representative axisymmetric geometrical coronary artery model. The results show that the mathematical model is able to qualitatively capture the atheroma plaque development observed in the intima layer.
Keywords: atheroma plaque formation, convection–diffusion–reaction equations, low-density lipoprotein transport
1. Introduction
Cardiovascular diseases related to atherosclerosis continue to be the leading cause of death worldwide [1]. Atherosclerosis is the process in which plaques—consisting of deposits of cholesterol and other lipids, calcium and large inflammatory cells called macrophages—are built up in the walls of the arteries causing narrowing (stenosis of the lumen), hardening of the arteries and loss of elasticity. This leads to a reduction in the blood flow through the vessels. Nevertheless, the most serious damage occurs when the plaque becomes fragile and ruptures (vulnerable plaque). Plaque rupture causes the formation of blood clots that can block blood flow or break off and travel to another part of the circulatory system, thus producing heart attacks, strokes, difficulty in walking and eventually gangrene [2–4].
The mechanical factors that could initiate of atherosclerosis lesions have been widely explored by many authors [5–7]. Cyclic stretch, laminar and oscillatory shear stress, effects of vessel compliance, curvature, pulsatile blood flow or cardiac motion are considered the main triggers of atherosclerosis initiation. Atherosclerosis is directly related to nanoscale fluid dynamics and macromolecular transport at the arterial endothelium [8]. The behaviour of atherosclerosis is time-dependent, and the dominant phenomena may occur in the range of 0–100 Å from the endothelium [9]. The location of atherosclerosis is associated with flow separation and turbulence. Therefore, many studies have identified haemodynamic shear stresses as an important determinant of endothelial function and phenotype in atherosclerosis disease (see [10,11] and references therein). Wall shear stress (WSS), which is defined as the force per unit area exerted on the vessel wall by the blood flow, is related to the plaque rupture, because this phenomenon has been more frequently observed at the proximal upstream side of the minimal lumen diameter, which is supposedly exposed to higher WSS. Then, arterial-level shear stress approximately greater than 1.5 Pa induces endothelial quiescence and an atheroprotective gene expression profile [10]. On the other hand, atherosclerosis disease preferentially affects predisposed areas of the blood vessel where the haemodynamic shear stresses are low such as bifurcations or zones with flow recirculation. Shear stress lower than approximately 0.4 Pa stimulates an atherogenic phenotype and eases atherosclerotic lesion initiation [10].
The onset and progression of atherosclerosis involves many processes. However, the fundamental cause of plaque development is believed to be the abnormal enlargement of the intima by the infiltration and accumulation of macromolecules such as lipoproteins and the associated cellular and synthetic reactions. It is well accepted that early atherogenesis tends to be hallmarked by an abnormally high accumulation of macromolecules, i.e. LDL, within the arterial wall. This suggests that the macromolecular transport in the arterial wall must have some impact on the initiation and development of atherosclerosis [12]. Therefore, the general picture is that zones of elevated LDL tend to localize with areas of atherosclerotic lesion development and intimal thickening, and such zones also tend to have ‘abnormal’ WSS patterns. The endothelium, which is the internal lining of the entire cardiovascular system, is uniquely positioned to be a sensor, responding and transducing these haemodynamic signals. Taken together, these results suggest, but do not prove, a role for mass transport in atherogenesis [13]. Furthermore, fatty streaks, the earliest detectable lesions in atherosclerosis, contain macrophage-derived foam cells that differentiate from recruited blood monocytes. Monocytes are recruited to tissues via constitutive signals and in response to inflammatory mediators [14]. More advanced atherosclerotic lesions, called fibro fatty plaques, are the result of continued monocyte recruitment, together with smooth muscle cell (SMC) migration and proliferation [15]. In addition, chemokines or chemoattractant cytokines constitute a family of over 40 different cell signalling molecules important for constitutive trafficking and recruitment of leucocytes in response to inflammatory mediators. Some chemokineses that can act as potent mediators of monocyte and SMC migration and macrophage differentiation are expressed in human atherosclerotic lesions [16,17].
The Staverman–Kedem–Katchalsky membrane equations [18] are usually used to model the transport processes in the endothelium and internal elastic lamina (IEL) in the majority of the previous multi-layer models. However, these equations have at least two substantial disadvantages despite the fact that they are widely used to model the mass transport through the endothelium: (i) they are derived based on the existence of a steady-state condition, which is in conflict with the real physiological conditions existing within both the endothelium and IEL, and (ii) they ignore the boundary effects on the flow across the membrane, which is not valid when the boundaries of the porous membrane have to be accounted for [12,19]. Furthermore, there are three transport pathways through the endothelium: vesicular transcytosis, which is regulated by receptors on the endothelial cells [20], and through leaky and normal junctions, most of which are located at the sites of dying or replicating cells [21]. Apart from the LDL molecules, many studies have focused on the governing mechanics interaction of the different biological species which play a role in atheroma plaque development from both experimental (see [22–24], among others) and computational (see [25–28], among others) points of view. Furthermore, there are greatly varying degrees of complexity in these computational studies depending on the number of species considered and the development of the equations proposed. Zohdi et al. [29] modelled the adhesion of monocytes to the endothelial surface, which is controlled by the intensity of the blood flow and the adhesion molecules stimulated by the excess of LDL, the penetration of the monocytes into the intima and subsequent inflammation of the tissue, and the rupture of the plaque accompanied with some degree of thrombus formation or even subsequent occlusive thrombosis. Their modelling approach predicts a priori the time to rupture as a function of arterial geometry, diameter of the monocyte, adhesion stress, bulk modulus of the ruptured wall material, blood viscosity, flow rate and mass density of the monocytes. Cobbold et al. [30] and Gessaghi et al. [31] studied the oxidation process of LDL cholesterol within the context of an in vitro framework. In addition, Cobbold et al. [30] considered the action of different vitamins such as vitamin E or C. Di Tomaso et al. [26] considered the interaction between just two species, LDL and monocytes, but monocyte behaviour was modelled in a very simple way. Fok [32] proposed a mathematical model of intimal thickening, posed as a free boundary problem. Intimal thickening was driven by damage to the endothelium, resulting in the release of cytokines and migration of SMCs. More complex studies were presented by Siogkas et al. [33], who included in their model oxidized LDL, macrophages and cytokines, considering that all the LDL molecules and the monocytes were oxidized and differentiated, respectively, at the instant in which these agents pass through the endothelium. A similar study was presented by Calvez et al. [34] from a mathematical point of view, but their study also included the foam cell. Ougrinovskaia et al. [25] explored the uptake of cholesterol by different scavenger receptors of macrophages during early-stage atherosclerosis using an ordinary differential equation (ODE) model. It was found that macrophage proliferation rather than an increased influx of LDL particles drives lesion instability. Finally, Bulelzai & Dubbeldam [35] presented a qualitative mathematical model consisting of a number of ODEs for the concentrations of the most relevant constituents of the atherosclerotic plaque: macrophages, monocytes, foam cell and oxidized LDL. Chung & Vafai [27] obtained the atheroma plaque properties based on microstructure information using a pore theorem and fibre matrix model, and taking into account the LDL transport. Additionally, another study by Chung & Vafai [28] described the effects of fluid–structure interaction and pulsation on the LDL transport.
With all these considerations at hand, this work presents a computational modelling based on reaction–convention–diffusion equations coupled with blood–wall mass transport of the main biological species which lead to atheroma plaque development. These biological agents and substances are LDL, oxidized LDL, monocytes, macrophages, foam cells, SMCs, cytokines and collagen. There are two important challenges for mass transport modelling within the arteries: providing a proper set of governing equations and the appropriate choice of boundary conditions [36–38]. Therefore, the dependence of fluid and mass transport through the endothelium on local blood flow characteristics has been modelled using a three-pore model, because this is more accurate than the use of a single pathway approach [39–41]. This model is represented by the vesicular pathway, normal junctions and leaky junctions. The transport properties of the leaky junctions, i.e. hydraulic conductivity, diffusive permeability and the reflection coefficient, are calculated locally in the dependence of the fraction of leaky junctions. The fraction of leaky junctions is correlated with WSS, using the available experimental data as outlined earlier [41]. Furthermore, the constants which define the biological interaction between the different species have been obtained from experimental studies found in the literature.
2. Hypothesis of the model
The endothelium is a single layer of endothelial cells, which are elongated in the direction of the blood flow. Endothelial cells are interconnected through intercellular junctions. IEL is an impermeable elastic tissue with fenestral pores that lies between the intima and media layers. The processes that lead to atheroma plaque evolution take place mainly in the intima and media layers. Therefore, it should be noted that in the context of arterial mass transport and atheroma plaque formation, the arterial wall refers to the intima and the media layers, with the adventitia as the outer boundary layer (not included in the model).
This model focuses on the purely mechanical factors which promote endothelial dysfunction such as low shear stress [42]. Therefore, endothelium permeability has been linked to WSS distribution along the internal artery wall in this model. The arterial mass transport is coupled with both the bulk blood flow in the lumen and the transmural flow in the wall. Therefore, fluid dynamic models and solute dynamic models have been included. A standard assumption made in arterial flow modelling is that blood is a homogeneous, isothermal and incompressible fluid [43]. Despite the fact that blood is formed by a suspension of particles, it is also valid to treat it as a homogeneous fluid. This is because the diameter of the suspended particles, such as red blood cells, is much smaller than the internal diameter of the artery [43,44]. Moreover, the assumption that blood acts as a Newtonian fluid is also an established approach, owing to the predominantly high shear rates in medium to large arteries. Under the earlier-mentioned assumptions, the laminar flow of blood is governed by the Navier–Stokes and continuity equations.
Additionally, the arterial wall can be treated as a porous medium. As such, it is of great importance to characterize the porous media transport models used in describing biological phenomena. Most human tissues can be treated as porous media as they are composed of dispersed cells separated by connective voids where blood flows [45].
Concerning the solute dynamics part of the model, mass transfer across the arterial wall occurs via two mechanisms: convection associated with the gradient of pressures which promotes transmural flow and mass diffusion caused by concentration gradients. Molecular diffusion is driven by solute concentration gradients within the arterial walls. These gradients are caused by metabolic uptake and the production of proteins and cells within tissue. The substances transported from blood through the endothelial, intimal and media layers usually encounter some mass transfer resistance. The resistance can be quite high, depending on the size and charge of the protein or cell [21].
The main processes taken into account in the model are the migration, proliferation, differentiation and apoptosis of the cells, secretion and degradation of the substances and the inter-conversion of species.
3. Governing equations
3.1. Fluid dynamics
3.1.1. Blood flow along the artery lumen
The pulsatile nature of blood flow has not been taken into account. Thus, the blood flow was assumed to be steady, incompressible, laminar, Newtonian and, hence, governed by the Navier–Stokes equation
| 3.1 |
and the continuity equation
| 3.2 |
The subscript ‘l’ is used to represent the lumen, then, ul is the velocity vector field in the lumen, pl is the lumen pressure and μb and ρb the blood density and dynamic viscosity, respectively. The internal forces have been disregarded in this model. A given parabolic velocity profile is imposed at the inlet of the artery and a given pressure at the outlet
| 3.3 |
where u0 is the mean inlet velocity as the average of the mean diastolic and systolic velocities in the left anterior descending coronary artery, in accordance with the experimental data given by Iliceto et al. [46]. R is the internal radius of the artery and r is the radius of the artery at the axial location. Finally, a no-slip boundary condition was applied between the lumen and the endothelium interface.
3.1.2. Transmural plasma flow throughout the artery wall
The transmural velocity vector field uw in the arterial wall is calculated with Darcy's law
| 3.4 |
and the corresponding continuity equation
| 3.5 |
where the subscript ‘w’ is used to represent the artery wall, κw is the Darcian permeability of the arterial wall, ρp and μp are the density and dynamic viscosity of the blood plasma, respectively, pw is the pressure within the arterial wall which is determined by the blood flow simulation along the artery lumen, and εp is the porosity of the artery wall. In order to specify a pressure drop across the arterial wall, a constant pressure of 2333.022 Pa (17.5 mmHg) was assumed at the intima–media interface [41,47].
The coupling of the flow dynamics in the artery lumen with that in the arterial wall is achieved by a three-pore model, and a transmural volumetric flux (Jv (m s−1)) through the endothelium is calculated by means of this theory, which takes into account the vesicular pathway, normal endothelial junctions and leaky junctions [41]
 |
3.6 |
where Jv,lj, Jv,nj and Jv,v are the volume flux through leaky and normal junctions and the vesicular pathway, respectively. Volume flux occurs mainly through normal and leaky junctions [48,49], therefore, Jv,v = 0. Moreover, the volume flux through the leaky and the normal junctions can be expressed as
| 3.7 |
where Lp,nj is the hydraulic conductivity for the normal junction and Lp,lj, the hydraulic conductivity for the leaky junction defined as
| 3.8 |
where  represents the fraction of the surface area S occupied by the leaky junctions Ap with the endothelial cell radius, Rcell, wl, the half-width of a leaky junction and ϕlj is defined as the ratio of the area of leaky cells to the area of all the cells [50,51]. Lp,slj is the hydraulic conductivity of a single leaky junction. Once ϕlj is known, the transport properties of the leaky junctions can be calculated accordingly. In the presented model, ϕlj is assigned locally at the endothelium as a function of WSS. The correlation between WSS and ϕlj is obtained using published experimental data
| 3.9 |
where the unit area is considered to be 0.64 mm2 and LC is the correlation between the number of leaky cells per unit area of 0.64 mm2, and the number of mitotic cells that is directly related to the WSS. For more details, see Olgac et al. [41].
Furthermore, the transport properties of the leaky junctions, i.e. hydraulic conductivity, diffusive permeability and the reflection coefficient, are estimated using the pore theory [41,52]. Accordingly, the hydraulic conductivity of a single leaky junction is given by
 |
3.10 |
where llj is the length of the leaky junction [50,51]. Finally, given all these considerations, the volume flux Jv through a single pathway can be estimated.
3.2. Solute dynamics
Two different steps have been taken into account. The first step corresponds to a steady-state diffusion and convection process along the lumen of the LDL particles and the monocyte cells. The second step is related to the transmural time-dependent process of mass transport, where different substances and species are transferred between the lumen and the vessel wall and react between them. The main phenomena modelled using diffusion–convection–reaction equations are: monocyte transmigration and later differentiation into macrophages; LDL accumulation and further oxidation; ingestion of oxidized LDL by the macrophages and their apoptosis, leading to foam cells; differentiation of contractile into synthetic SMCs, the migration of synthetic SMCs and their secretion of collagen.
3.2.1. Step 1: steady-state diffusion and convection along the lumen
3.2.1.1. Low-density lipoprotein particles
The LDL transport in the blood fluid domain along the artery lumen is governed by the convection–diffusion equation:
| 3.11 |
where DLDL,l is the LDL diffusion coefficient in the lumen blood flow and CLDL,l is the LDL concentration. For the mass transport calculations at the lumen, a constant concentration boundary condition is used at the lumen inlet. A convective flux condition is used to ensure that LDL is convected out of the domain with flow  . Finally, an outflow and no flux boundary conditions were applied at the lumen outlet and lumen artery wall interface, respectively.
3.2.1.2. Monocytes
Analogously, the monocyte diffusion and convection processes along the lumen are regulated by
| 3.12 |
where Dm,l is the diffusion coefficient of the monocytes in the lumen, and Cm,l the monocyte concentration in the lumen. Because the normal range for the monocyte count is from 200 to 950 cells mm−3 [53], an intermediate value of 550 cells mm−3 has been chosen as the initial concentration of monocytes at the inlet of the artery. Then, as for the LDL substance, the monocyte concentration distribution at the lumen inlet was assumed to have a uniform profile. Again, an outflow and no-flux boundary conditions were applied at the lumen outlet and lumen–artery wall interface, respectively; with the flux definition  .
.
3.2.2. Step 2: time-dependent diffusion and convection along the artery wall
3.2.2.1. Low-density lipoprotein particles
The LDL diffusion and convection through the artery wall can be modelled as
 |
3.13 |
where CLDL,w and DLDL,w are the LDL concentration in the artery wall and the LDL diffusive coefficient in the plasma, respectively. Apart from the diffusive and convective terms of equation (3.13), the term relating to the reaction part, dLDLCLDL,w, corresponds to the LDL oxidation formation, indicating the concentration of LDL per second which is oxidized. dLDL is the degradation rate of LDL. Besides, insulation boundary conditions were applied at both axial ends of the artery wall, where the flux of LDL substance is defined as  .
.
Moreover, at the media–adventitia interface, a constant LDL concentration value of 0.005 times the LDL concentration retained at the lumen intima interface was assigned as Meyer et al. [54] reported. The lumen–artery wall interface coupling of solute dynamics is achieved by a three-pore model that takes into account the vesicular pathway, normal endothelial junctions and leaky junctions. Thus, the solute flux of LDL at the endothelium was defined as a boundary condition by the Kedem & Katchalsky [18] equations.
The total LDL solute flux, Js,LDL (mol m−2 s−1), through a single pathway is given by Olgac et al. [41]
| 3.14 |
with cl being the luminal LDL concentration at the endothelium. The LDL deposition coefficient, which indicates the percentage of LDL particles from the blood flow deposited at the endothelium, LDLdep, was chosen as 1 × 10⁻³
cl [41,55]. Furthermore, because the entrance of LDL into the arterial wall cannot grow indefinitely, there is a natural saturation incorporated by the  in the denominator of equation (3.14). This means that the LDL retention increases as the cholesterol level of the blood flow increases. However, it has been considered that this natural saturation occurs when the LDL levels in the blood are pathological, i.e. there are high levels of total cholesterol (270 mg m−3) [56]. Finally, Papp is the apparent permeability coefficient given as [41,57]
| 3.15 |
where Plj is the diffusive permeability of the leaky junction pathway, σf,lj the solvent drag coefficient for the leaky junctions, Plj, the diffusive permeability of the leaky junction pathway and Zlj a fractional reduction factor in the solute concentration gradient at the pore entrance. These were estimated by Olgac et al. [41]. Pv is the permeability of the vesicular pathway. Applying the proportion between the leaky junction pathway and vesicular transport reported by Cancel et al. [58], Pv is calculated to be 1.92 × 10¹¹ m s−1. Following all these considerations, the total LDL solute flux, Js,LDL (mol m−2 s−1), can be estimated.
3.2.2.2. Monocytes
The diffusion and convection governed equations for the monocyte cells are
 |
3.16 |
and  , where Cm,w and Dm,w are the concentration and diffusive coefficients of the monocytes, respectively. Owing to the size of the monocytes, the convection term has been disregarded [34,35]. Equation (3.16) has several terms. The first corresponds to the monocytes which differentiate into macrophages, dm being the constant rate that modulates this differentiation. The second term represents the monocytes natural death. The monocytes undergo random motion, are chemotactically attracted to the chemicals in the presence of oxidized LDL, and grow up to a maximal value
  . Therefore, the last term on the right-hand side of equation (3.16) corresponds to the chemotaxis of the monocytes due to the presence of oxidized LDL. The natural saturation at this maximum value has been included by means of a Gaussian function. This Gaussian function is set to 1, whereas there are no monocytes in the artery wall, and it decreases to 0. The Gaussian function tends to 0 when the monocyte concentration is bigger than
  , a threshold of monocyte concentration which is set to the same value as the monocyte blood concentration.
Moreover, regarding the boundary conditions, insulation conditions were applied at both axial ends of the wall and the media–adventitia interface, and a perpendicular monocyte inflow to the endothelium has been defined. The solute flow dependence on the WSS has been modelled based on the study by Bulelzai & Dubbeldam [35]. The monocytes solute flux per unit of surface, Js,m (cells m−2 s−1), is modelled as
| 3.17 |
which is consistent with the fact that larger shear rates imply a smaller coefficient for the monocytes [10,59]. The value of WSS0 designates the WSS at which the growth rate of the monocyte concentration owing to the signalling response by the endothelium is reduced by a factor of two compared with the zero wall shear rate response by the endothelium, and it is taken to be 1 Pa [35]. Because the monocyte captation for the artery wall is due to the presence of oxidized LDL in the intima, the second term on the right-hand side of equation (3.17) contemplates  in the numerator. The entrance of monocytes into the arterial wall will be regulated by the oxidized LDL concentration, the monocyte flux being unnecessary when the oxidized LDL is completely eliminated. Moreover, the monocyte flux depends on the lumen concentration of this species, indicating that the flux increases as the monocyte blood concentration increases. Finally, the factor mr is a constant which determines the rate at which monocytes enter the intima for small WSS and per mol m−3 of oxidized LDL. According to the experimental test performed by Steinberg et al. [22], 90% of the monocytes which were injected into a mutant rabbit disappeared from the blood flow at 72 h. Thus, each day 30% of the monocytes of the blood flow are recruited by the artery wall. Then, considering a unit surface of the model, i.e.
  where dh is the differential of the height (h), the mr constant should satisfy that
  divided per unit of surface is equal to 0.3 m3 mol−1 day−1. Thus, mr has been taken to be 5.5 × 10⁻⁴ m3 mol−1 day−1.
3.2.2.3. Oxidized low-density lipoprotein
For the oxidized LDL process, we came to the following equations
 |
3.18 |
and  , where
  and
and  are the concentration and diffusive coefficient of oxidized LDL, respectively. The
  value has been considered as similar to that used for the LDL substance by Prosi et al. [39]. dLDLCLDL,w modelled the oxidized LDL process from the LDL. Finally, the quantity of LDL uptake by the macrophages per second (mol m−3 s−1) is defined by the second term on the right-hand side of equation (3.18), where CM,w is the concentration of macrophages and LDLoxr is the rate of LDL uptake by a macrophage. Finally, insulation boundary conditions were applied at all the walls, i.e. at the lumen–intima and media–adventitia interface and at the axial ends of the wall.
3.2.2.4. Macrophages
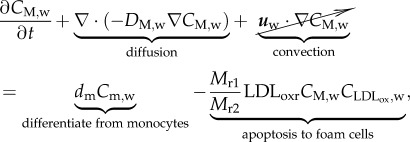
The evolution of the macrophages is modelled by
 |
3.19 |
and  where DM,w is the diffusive coefficient of macrophages in the arterial wall taken equal to the monocyte diffusion coefficient. The first term on the right-hand side of equation (3.19) corresponds to the monocytes that have differentiated into macrophages, and the second term models foam cell formation. Foam cell formation depends on the quantity of oxidized LDL ingested by the macrophages (
 ), which has been multiplied and divided by the constants Mr1 and Mr2. The former corresponds to the oxidized LDL concentration per second that a single macrophage should ingest to convert into a foam cell. The latter refers to the rate of foam cell formation per second depending on the macrophage concentration. Insulation boundary conditions were again applied at all the walls of the intima–media layers. As in the case of the monocyte behaviour, the convective term for the macrophages has been disregarded.
3.2.2.5. Cytokines
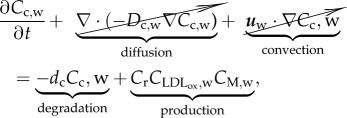
Cytokines are secreted by numerous cells and are a category of signalling molecules used extensively in intercellular communication. By means of the cytokines, macrophages express the inflammation process occurring in atheroma plaque formation. The behaviour of the cytokines can be modelled as
 |
3.20 |
where Cc,w is the cytokine concentration and Dc,w the diffusion coefficient for the cytokines in the intima. However, diffusion and convection effects have been disregarded, because it was considered that cytokines are retained in the macrophage membrane [60]. The cytokine concentration is the result of a dynamic balance between degradation and production. Thus, dc is the degradation rate of cytokines, and Cr the production ratio of cytokines owing to the presence of oxidized LDL and macrophages [33]. Moreover, because macrophages are responsible for cytokine secretion owing to the oxidized LDL, the concentrations of both species are included in the cytokine production term.
3.2.2.6. Foam cells
The production of foam cells is governed by
 |
3.21 |
and  where CF,w and DF,w are the concentration and diffusive coefficients of foam cells in the arterial wall. The convection and diffusion of the foam cells is disregarded, because their dimensions are too large [34]. Consequently, the convection transmural velocity flow cannot drag these cells. The reaction term corresponds to macrophage apoptosis, whose constant has already been defined. No-flux boundary conditions have been defined at the contours of the artery wall volume.
3.2.2.7. Contractile smooth muscle cells
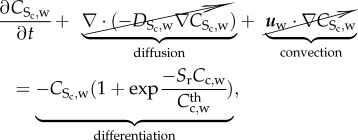
Initially, SMCs were assumed to be in a contractile phenotype. The presence of cytokines modulates their differentiation towards a synthetic phenotype by means of
 |
3.22 |
where  is the contractile SMC concentration and Sr the differentiation rate of these cells owing to the presence of cytokines [61]. The contractile smooth cell differentiation is modelled as a reverse sigmoid function where at the maximum concentration of cytokines,
  , the differentiation is maximum. Because the mitosis and death of these cells are regulated by the body of the organism and both rates tend to be in equilibrium, the proliferation and apoptosis of these cells are not included in the equations. Again, the convention of these cells has been disregarded owing to their size, as with other cells included in this model. Moreover, these cells are considered quiescent, and therefore there is no diffusion process. An initial concentration of contractile SMCs of 29.28 × 10¹² mol m−3 is defined as the initial condition [62], and insulation boundary conditions were applied.
3.2.2.8. Synthetic smooth muscle cells
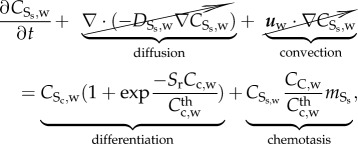
The behaviour of differentiated SMCs can be modelled as
 |
3.23 |
where  is the synthetic SMC concentration. As in the case of contractile SMCs, there is neither convection nor diffusion for this species. The convection is disregarded due to the large size of the SMCs, and the diffusion is disregarded because these cells migrate instead of being spread by diffusion. Furthermore, synthetic SMCs are induced into the intima by the chemoattractant (cytokines),
  being the migration rate of these cells [63].
3.2.2.9. Collagen
Finally, the last process corresponds to the collagen formation which is synthesized by the SMCs. The intima and media layers are formed by collagen, among many other substances. In addition, the contractile SMCs produce collagen which is degraded by the normal mechanism of the body. However, this model considers just the collagen secreted by the synthetic SMCs, because this is the only collagen that contributes to the development of the atheroma plaque. It can be described by
 |
3.24 |
where CG,w is the concentration of the collagen. The collagen is secreted at the rate Gr, and degraded at the rate dG. The natural degradation of the collagen as the age increases has not been taken into account. Moreover, insulation boundary conditions have been applied and diffusion and convection processes neglected.
3.3. Plaque formation
The mass balance for open systems can be written as
| 3.25 |
where ρo is the total density of the tissue in the reference configuration [64],  are the source/sinks and Mi the mass fluxes of the i arbitrary species.
  are related to migration, proliferation, differentiation and apoptosis of the cells and secretion and degradation of the substances. The concentrations of each species have the property
  being
being  the total material density of the tissue as the sum over all i. The densities,
  , change as a result of mass transport and inter-conversion of species, implying that the total density in the reference configuration, ρo, changes with time.
As mass transport alters the reference density,  assuming that these volume changes are isotropic, it leads to the following growth kinematics
  where
where  means the original concentration of a species in the undeformed configuration [64] and I is the second order unit tensor. For small strain hypothesis and isotropic growth, we can write
 |
3.26 |
where v is the velocity of the material points.
Finally, as the volume of the atheroma plaque is mainly due to the foam cells, SMCs and collagen, the volume contribution of the rest of the species has been neglected. It has been assumed that monocyte and macrophage sizes (before ingesting oxidized LDL) as well as cytokine, LDL and oxidized LDL sizes are small in comparison with the sizes of foam cells and SMCs [34]. Thus, the isotropic growth of the atheroma plaque can be estimated as
| 3.27 |
where ΔCS,w is the variation of both contractile and synthetic SMCs with respect to the initial concentration of these species before atheroma plaque initiation,  and
and  are the volume of one foam cell and one SMC, respectively, which can be estimated knowing the radius of a foam cell RF and a SMC RSMC, and ρG the density of the collagen, taken as 1 g ml−1 [65]. The foam cell has been considered as spherical and the SMC shape as ellipsoidal [66].
For the sake of clarity, the values and physiological meaning of the parameters in this and the previous equations are given in table 1.
Table 1.
List of parameters related to the biological model.
| parameter | description | value | reference |
|---|---|---|---|
| blood diffusion coefficients | |||
| DLDL,l | LDL | 5 × 10⁻¹² m2 s−1 | Curry [52] |
| Dm,l | monocytes | 1 × 10⁻¹² m2 s−1 | Petty et al. [67] |
| plasma diffusion coefficients | |||
| DLDL,w | LDL | 8 × 10⁻¹³ m2 s−1 | Prosi et al. [39] |
 |
oxidized LDL | 8 × 10⁻¹³ m2 s−1 | Prosi et al. [39] |
| Dm,w | monocytes | 8 × 10⁻¹⁵ m2 s−1 | Budu-Grajdeanu et al. [68] |
| DM,w | macrophages | 1 × 10⁻¹⁵ m2 s−1 | Budu-Grajdeanu et al. [68] |
| Dc,w | cytokines | neglected | — |
| DF,w | foam cells | neglected | — |
 |
contractile SMCs | neglected | — |
 |
synthetic SMCs | neglected | — |
| DG,w | collagen | neglected | — |
| rates | |||
| dLDL | degradation LDL | 3.0 × 10⁻⁴ s−1 | Esterbauer et al. [69] |
| dm | monocytes differentiation | 1.15 × 10⁻⁶ s−1 | Bulelzai & Dubbeldam [35] |
| md | monocytes natural death | 2.572 s−1 | Krstic [70] |
| LDLoxr | oxidized LDL uptaken | 0.0012 × 10⁻¹⁵ m3 cells−1 s−1 | Kruth et al. [71] |
| LDLdep | LDL deposition | 1 × 10⁻³ cl | Chang [55] |
| Mr1 | oxidized LDL leads to foam cell | 2.83 × 10⁻¹¹ m3 mol−1 s−1 | Zhao et al. [23] |
| Mr2 | foam cell formation | 9.25 × 10⁻²⁴ m3 cells−1 s−1 | Zhao et al. [23] |
| dc | cytokines degradation | 2.3148 × 10⁻⁵ s−1 | Zhao et al. [72] |
| Cr | cytokines production | 3.10 × 10⁻¹⁰ m3 s−1 cells−1 | Siogkas et al. [33] |
| Sr | contractile SMCs differentiation | 4.16 × 10⁻⁸ s−1 | Chamley-Campbell et al. [61] |
 |
synthetic SMCs migration | 1 × 10⁻⁵ s−1 | Griffin et al. [63] |
| Gr | synthesis collagen | 2.157 × 10⁻¹¹ g cells−1 s−1 | Zahedmanesh et al. [62] |
| dG | degradation collagen | 3.85 × 10⁻⁷ s−1 | Humphrey [73] |
| dimensions | |||
| Rcell | endothelial cell radius | 15 μm | Weinbaum et al. [51] |
| wl | half-width of a leaky junction | 20 nm | Weinbaum et al. [51] |
| llj | leaky junction length | 2 μm | Weinbaum et al. [51] |
| RLDL | LDL radius | 11 nm | Prosi et al. [39] |
| RF | foam cell radius | 30.24 μm | Krombach et al. [74] |
| RSMC | SMC radius | 7.5 μm | Martini [75] |
| lSMC | SMC length | 115 μm | Martini [75] |
| threshold | |||
 |
LDL threshold | 6.98 mol m−3 | Schwenke & Carew [56] |
 |
monocytes mitosis threshold | 550 × 109 cells m−3 | Khan [53] |
| others | |||
| ρb | blood density | 1050 kg m−3 | Milnor [76] |
| μb | viscosity density | 0.0035 Pa × s | Milnor [76] |
| ρp | plasma density | 1000 kg m−3 | Milnor [76] |
| μp | plasma density | 0.001 Pa × s | Milnor [76] |
| κw | Darcian artery permeability | 1.2 × 10⁻¹⁸ m2 | Vargas et al. [77] |
| εp | intima porosity | 0.96 | Ai & Vafai [57] |
| ρG | collagen density | 1 g ml−1 | Sáez et al. [65] |
| Lp,nj | normal junction conductivity | 1.19 × 10⁻¹¹ m s−1 Pa | Tedgui & Lever [78] |
| u0 | mean artery inlet velocity | 0.24 m s−1 | Iliceto et al. [46] |
| σf,lj | drag coefficient of a leaky junction | 0.5682 | Olgac et al. [41] |
| Δpr | endothelial pressure difference | 2400 Pa | Tedgui & Lever [78] |
| WSS0 | reference WSS | 1 Pa | Bulelzai & Dubbeldam [35] |
4. Numerical examples
In order to demonstrate the performance of the scheme of equations presented earlier, a computational model of a left descending coronary artery is presented. A commercial FE code, Comsol Multiphysics, v. 5.2 (COMSOL), was used to implement the model.
4.1. Geometrical model and mesh
The computational geometry corresponds to an idealized axisymmetric representation of a coronary artery. The general dimensions of the model are 1.85 and 0.1702 mm for the inner radius and arterial wall thickness, respectively, in accordance with the dimensions of a standard left descending coronary artery [79]. The length of the model is determined for the distance needed to obtain a completely developed flow, and this has been assessed as 60 mm. Furthermore, a stenosis rate of 55% is included in the geometry in order to reproduce a recirculation zone comparable with those that develop at arterial bifurcations. The artery wall is composed of the three porous media of the endothelium and one layer which corresponds to the intima and media layer together. The adventitia layer has not been modelled, because this layer does not play a role in the atherosclerosis process. Figure 1a shows the three-dimensional coronary artery model used, and the axisymmetric section which has been revolved in order to obtain the three-dimensional model. Moreover, as figure 1b shows, a fine mesh was created in the lumen and artery wall. The lumen and the arterial wall were meshed with 32 848 and 48 610 triangular elements, respectively. Furthermore, grid independence tests were performed successfully for both fluid flow and LDL transport calculations. Previous sensitivity analyses were performed to choose the definitive mesh. These mesh sensitivity analyses were mainly tested on the velocity field, by varying the number of grid cells. The computational domain is considered to be sufficient for this study when further mesh refinement can only result in less than 1% change in velocity, and an adequate convergence of the maximum WSS is obtained.
Figure 1.
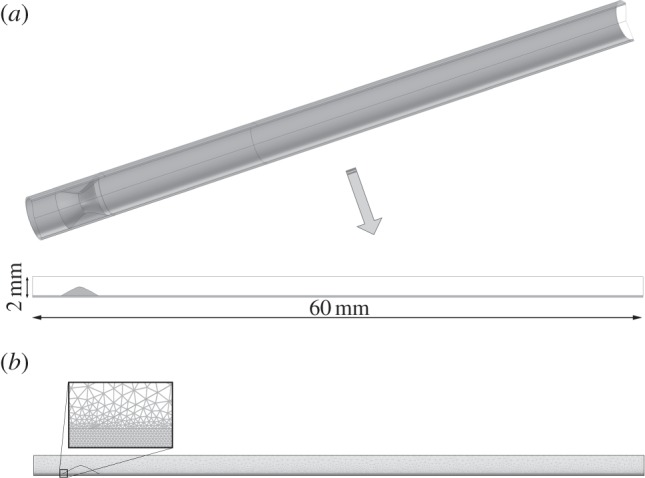
(a) Three-dimensional idealized geometry of an atherosclerotic coronary artery stenosed 55% of its area in order to obtain areas of flow recirculation and longitudinal section of this artery where the dashed centre line represents the axis of symmetry. (b) Longitudinal section of the used mesh, showing a detail of the artery wall mesh.
Finally, the main defined boundary conditions are outlined in figure 2.
Figure 2.
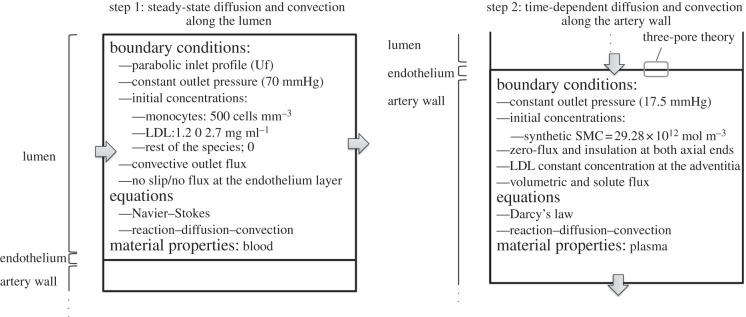
Schematic of the applied boundary conditions.
4.2. Results
The equations were computed on the presented geometrical model simulating the plaque growth for three different scenarios; (i) normal blood cholesterol level (1.2 mg ml−1) for a period of 10 years, (ii) high blood cholesterol level (2.7 mg ml−1) for 10 years, and (iii) 5 years of high cholesterol followed by 5 years of a normal cholesterol level, simulating that the patient is on a diet and therefore that the blood cholesterol concentration decreases. The results obtained for these three cases are presented in the following.
4.2.1. Step 1: steady-state diffusion and convection along the lumen
The first step consists of a steady-state flow along the lumen which transports the LDL and monocyte substances. The velocity obtained along the artery lumen showing the flow streamlines is presented in figure 3a, where it can be observed that the flow is fully developed. The maximum velocity reached is 1.18 m s−1 and, as expected this occurs in the central part of the blood vessel after the stenosis. Furthermore, the streamlines of the velocity are shown in order to identify the recirculation zones downstream of the stenosis. These zones of reverse flow indicate the place where the initiation of the atheroma plaque would probably occur, because the WSS in these zones is low. In addition, figure 3b shows the pressure along the coronary artery where a pressure drop is observed owing to the stenosis and the applied boundary conditions.
Figure 3.
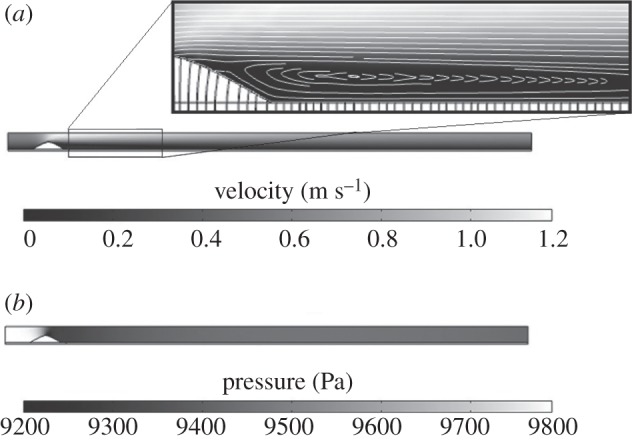
(a) Velocity and streamlines of the lumen flow. (b) Pressure distribution along the coronary artery model.
However, the most important result of the step 1 computation is the WSS distribution along the coronary artery model, because this distribution triggers the initiation of the atherosclerosis lesion. Figure 4a shows the contour map of this variable, showing a detail of the area where the WSS is lower. The WSS along the lumen wall varies from 1 to 2 Pa, except in the zone of the stenosis, where a WSS of 8 Pa is reached. For the sake of clarity, the WSS along the z-coordinate has been plotted in figure 4b, showing that the minimum WSS occurs approximately at the model length of 22 mm.
Figure 4.
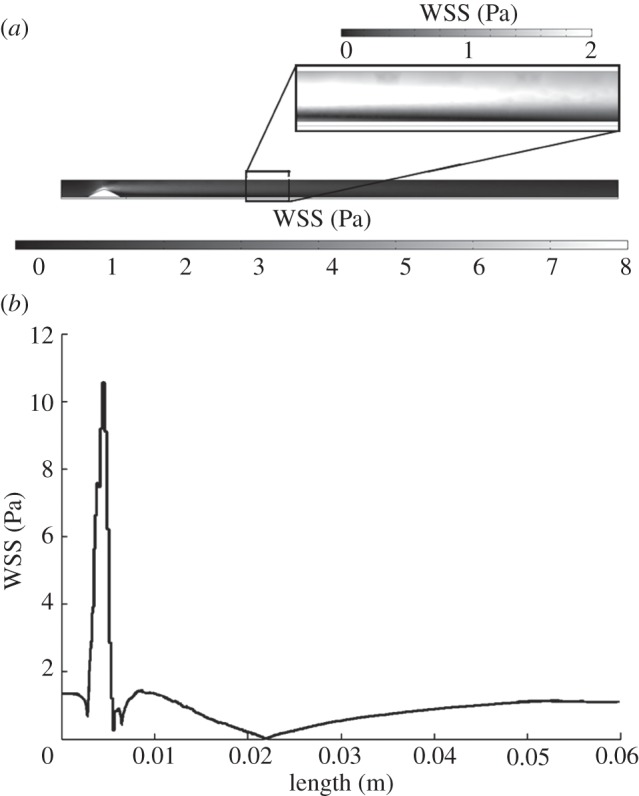
(a) WSS contour map along the model. (b) WSS versus model length measured in metres.
4.2.2. Step 2: time-dependent diffusion and convection along the artery wall low-density lipoprotein and oxidized low-density lipoprotein
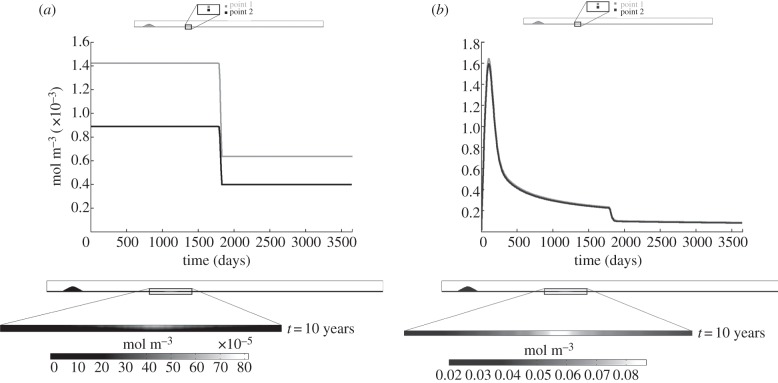
Figures 5–9 show the development of the concentration of each of the species over time for the third computed case, i.e. 5 years of a high cholesterol level followed by 5 years of a normal cholesterol level, as well as the contour map of each species at the end of the process. The curves of each of these figures are depicted for two points, at 25 and 50%, respectively, of the thickness of the wall and placed at the length where the WSS is minimum. These points have been chosen in order to show the different concentration of each species along the artery wall. Figure 5 shows the results for the LDL and oxidized LDL. Viewing figure 5a where the LDL results are shown, it can be seen that at the beginning the LDL concentration reaches 1.4 × 10⁻³ and 8.6 × 10⁻⁴ mol m−3 for points 1 and 2, respectively. These values remain constant during the 5 years of high cholesterol level. Then, when the blood LDL level decreases, the LDL concentration in the artery wall also decreases until 6 × 10⁻⁴ and 4 × 10⁻⁴ mol m−3, respectively, again remaining constant over the other 5 years. The LDL solute flux is independent of time, varying only with the WSS fluctuations and the blood LDL concentration.
Figure 5.
Concentration evolution and concentration contour map for the (a) LDL and (b) oxidized LDL as the time increases.
Figure 6.
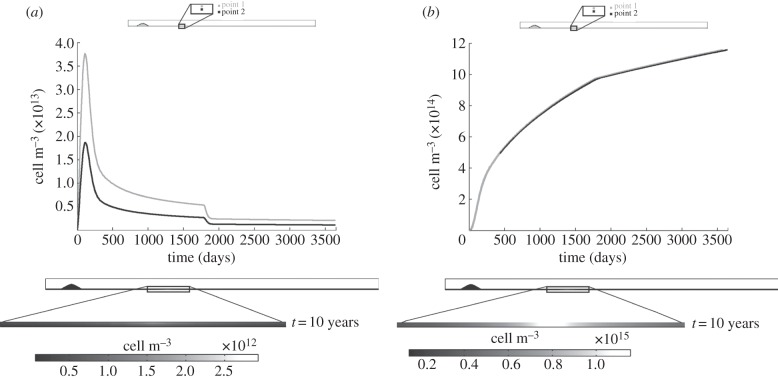
Concentration evolution and concentration contour map for the (a) monocytes and (b) macrophages as the time increases.
Figure 7.
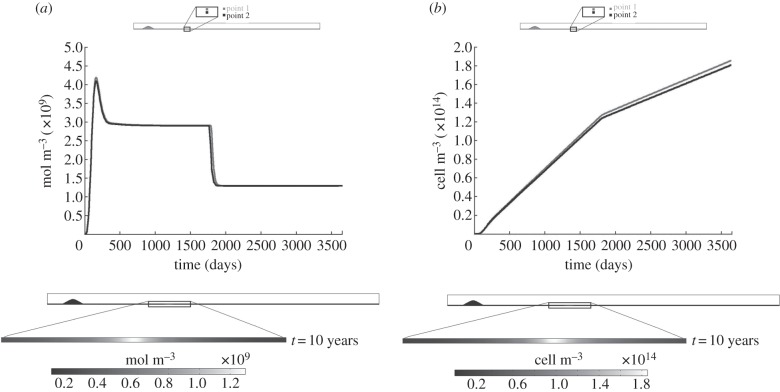
Concentration evolution and concentration contour map for the (a) cytokines and (b) foam cells as the time increases.
Figure 8.
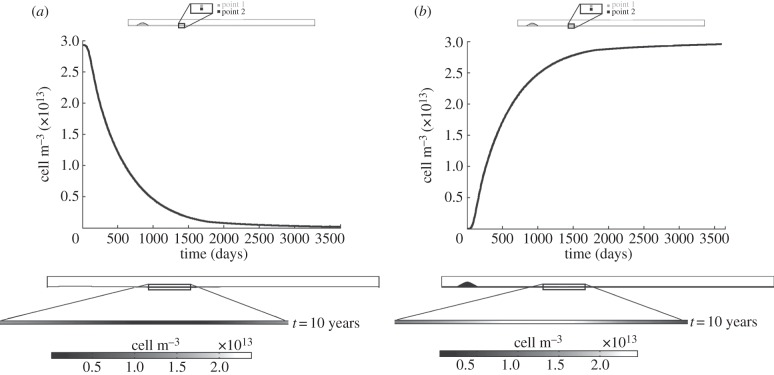
Concentration evolution and concentration contour map for the (a) contractile and (b) synthetic SMCs as the time increases.
Figure 9.
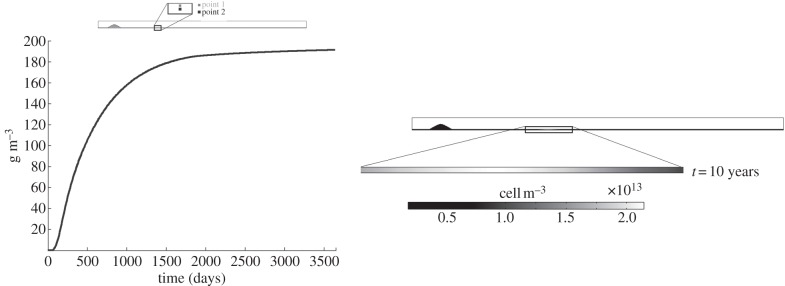
Concentration evolution and concentration contour map for the collagen as the time increases.
Moreover, the concentration contour map at the end of the process (10 years) shows that the maximum LDL concentration is located at the minimum WSS values, being higher near to the endothelium, because the LDL molecules penetrate through it. The LDL becomes oxidized as it is diffused and convected. Figure 5b shows the results for the oxidized LDL, which increases until 1.6 mol m−3 during the first half year, because there are few macrophages at the beginning of the process. However, as the macrophage concentration increases, the phagocyted oxidized LDL concentration also increases. Despite this increase in the macrophage concentration and the blood LDL concentration decreasing at the fifth year of computation, not all the LDL becomes oxidized. An equilibrium state of approximately 0.18 mol m−3 is reached. The oxidized LDL evolution over time is similar for both the studied points, showing that the concentration of this substance is constant in the artery wall cross section owing to diffusion and convection processes. This is also corroborated by the concentration contour map of this substance.
4.2.2.1. Monocytes and macrophages
Figure 6a,b shows the results for the monocytes and macrophages, respectively. The monocyte flux depends on the oxidized LDL concentration, because it is regulated by the concentration of LDL. Thus, the tendency of the monocyte evolution over time is similar to that obtained for the oxidized LDL, reaching an equilibrium of 2.5 × 10¹² and 2 × 10¹² cell m−3 for points 1 and 2, respectively, for the same computation time as that stabilized for the oxidized LDL. Furthermore, the monocyte flux and removal, either owing to natural death or macrophage differentiation, modulates the obtained concentration. The concentration contour map at 10 years of atheroma plaque growth shows that the monocyte distribution across the artery wall is not uniform, being higher close to the monocyte source, i.e. the endothelium, as occurs for the LDL substance. Macrophage evolution undergoes a rapid increase over the first days of the process and subsequently decreases slightly owing to the initiation of foam cell formation. Moreover, the slope of the curve decreases as the blood cholesterol level decreases. The macrophage concentration contour map shows that these cells are concentrated around the endothelium lesion, being uniform along the artery cross section.
4.2.2.2. Cytokines and foam cells
The results for the cytokines and foam cells are shown in figure 7a,b, respectively. The cytokines increase at the beginning of the process, because their concentration depends on the macrophage and oxidized LDL concentrations, which also increase at this time. Once the macrophage production (monocyte differentiation) and removal (foam cell formation) reach an equilibrium, the cytokines remain constant at 3 × 10⁹ mol m−3, decreasing until 1.2 × 10⁹ mol m−3 when the blood LDL decreases. The foam cell concentration, figure 7b, increases over time. There is a variation in the slope at 5 years when the LDL blood concentration decreases. Furthermore, the concentration contour maps of both substances at the end of the process are uniform along the artery wall cross section, showing higher concentrations in those areas where the WSS is at a minimum.
4.2.2.3. Contractile and synthetic smooth muscle cells
Figure 8a,b shows the results for the contractile and synthetic SMCs, respectively. Both types of SMCs are inversely related by means of the cytokine concentration. Therefore, the contractile SMCs whose initial concentration was defined as the initial condition at 29.28 × 10¹² mol m−3, decrease over time increases in order to obtain synthetic SMCs which could migrate to the endothelium, reaching an equilibrium at around the fourth year. By contrast, synthetic SMCs increase with time until approximately 3 × 10¹³ cell m−3. Moreover, the concentration contour maps of these species show the differentiation of contractile SMCs into synthetic SMCs in those areas with low WSS.
4.2.2.4. Collagen
Finally, the collagen variation over time is shown in figure 9. Because the synthetic SMCs which migrate to the endothelium are responsible for the collagen segregation, the collagen concentration follows the same tendency as that of the synthetic SMCs, increasing over time until the equilibrium value of 190 g m−3 is reached. The concentration contour map of this substance is uniform along the artery wall section, reaching its maximum values where the WSS is at a minimum.
4.2.2.5. Plaque formation
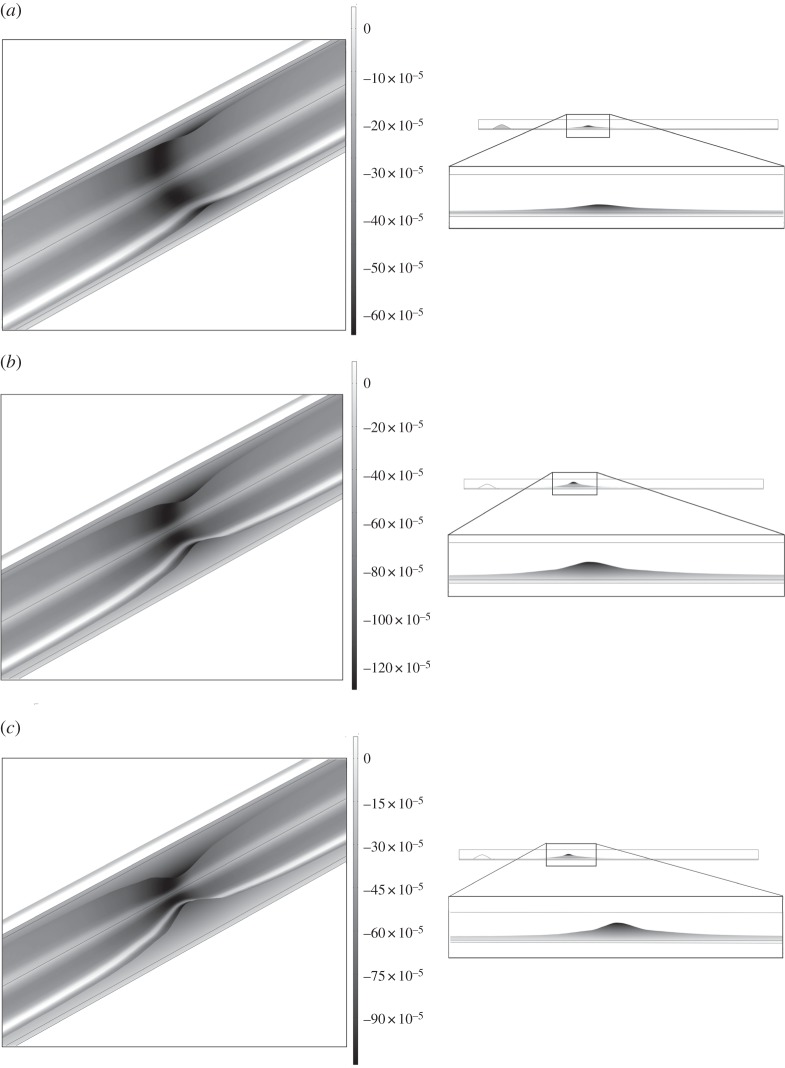
Figure 10 shows the volumetric growth for the three studied scenarios: (i) normal blood cholesterol level (1.2 mg ml−1) over a period of 10 years, (ii) high blood cholesterol level (2.7 mg ml−1) over a period of 10 years, and (iii) 5 years of a high cholesterol level followed by 5 years of a normal cholesterol level. The colour legend indicates the displacements of each point in m. Defining the degree of stenosis as the ratio between the area of atheroma plaque which has growth plus the original healthy arterial wall divided by the area of a normal artery wall, then the stenosis ratio after 10 years is approximately 45, 85 and 70%, respectively, for the three simulated cases, showing clearly the influence of the blood LDL concentration on atheroma plaque evolution. The total volume of the plaque at the final stage is 18.15, 38.42 and 25.95 mm3, respectively, and the corresponding change in flow resistance increases respect to the initial stage by 22, 271 and 48%, respectively. It should be noted that high LDL cholesterol in the blood is a risk factor for atherosclerosis disease. However, even if the blood cholesterol level is acceptable, atheroma plaque formation occurs.
Figure 10.
Total volumetric growth after (a) 10 years for the three studied cases of normal blood cholesterol level (1.2 mg ml−1), (b) after 10 years for the three studied cases of high blood cholesterol level (2.7 mg ml−1) and (c) after 10 years for the three studied cases of 5 years of high cholesterol level (2.7 mg ml−1) and after that, 5 years of normal cholesterol level (1.2 mg ml−1).
5. Discussion
A mathematical and computational model of atheromatous plaque emergence has been presented that allows the lesion to grow in particular areas in relation to the haemodynamics of the blood flow. Atheroma plaque growth is a complex process involving a high number of biological processes and species. In connection with the effects of blood flow on plaque rupture, the complex blood flow dynamics in the arterial system has been considered to play a key role in the initiation and development of plaques [80,81]. When lumen narrowing occurs, the upstream part of the plaque is exposed to a high WSS, whereas the downstream part is still exposed to low WSS and inverse flow. Thus, the change in lumen diameter owing to plaque growth will influence the pattern of blood flow, and therefore the WSS [82]. Even in an inflammatory environment, endothelial cells are capable of responding to signals induced by the WSS [83,84]. Therefore, the low shear stress region of the plaque will remain athero-prone, whereas the high shear stress region is thought to activate alternative signalling pathways leading to matrix degradation and eventually resulting in destabilization of the cap covering the plaque [82]. Weakening of the cap will eventually result in plaque rupture.
Although the model developed is relatively simple, it captures some of the main features of atherosclerosis lesion formation. The model is in good agreement with the clinical hypothesis that correlates atherosclerosis occurrence with low WSS, as the numerical example presented here illustrates. Moreover, the results obtained are reasonable in terms of the biological process of atheroma plaque growth. In particular, the LDL concentration profile throughout the arterial wall at the areas with low WSS and the experimental results of Meyer et al. [54] are in good agreement. However, any experimental studies reproduce experimentally the changes in concentration of the rest of the biological agents and species in order to validate the obtained results. In addition, the model realistically predicts the stenosis evolution owing to the appearance of low WSS, because a stenosis of approximately 45, 85 and 70% of the lumen area has been obtained after 10 years, for the three studied cases, respectively, which is clinically viable [85]. However, the results cannot be quantitatively validated, because the appropriate experiments that directly measured the concentration of each species at the human artery wall over time are not currently available.
This model can be considered as a step forward towards understanding atheroma plaque development. However, it requires further improvement and several limitations should be mentioned. Concerning the mathematical model, only the most important biological species have been taken account. Other species such as different types of cytokines (IL-4, IL-10, IL-13 or TGF beta) or T-cells have been omitted. Substances such as free radicals, which oxidize the LDL, and the processes in which they are involved have also been disregarded. There are so many cells and substances which play a role in the development of atherosclerotic lesions that including all of them is practically impossible. Only the main processes have been included in the model, whereas other important processes in the development of the atheroma plaque such as the degradation of collagen with age or the apoptosis of the SMCs have been ignored. The dynamics of macrophage and oxidized LDL infiltration from the arterial wall into the lumen during lesion progression remains poorly understood, because no correlation between oxidized LDL or macrophages and low WSS zones as well as other wash-out mechanics has been found in the literature. Therefore, these processes were not included in the model. The complexity of the model should be increased by including more biological agents and substances as well as the processes that interconnect all the species in order to provide more precise information about the atherosclerotic disease process. The WSS has been considered as the main trigger of atherosclerosis initiation. Thus, the cyclic stretch effects of vessel compliance, curvature, pulsatile blood flow or cardiac motion have been disregarded. Furthermore, other variables such as the OSI, the WSSG or the WSSAG should also be included. The model parameters were obtained from a wide variety of experiments on many different human or animal models. However, few parameters have been estimated according to the order of magnitude of these parameters and making choices that gave biologically reasonable results. A sensitivity study of the parameters used in the growth model should be carried out in order to assess their influence on the results obtained. The transport properties are set as constant, but in fact they are very likely to change during plaque formation [27]. This model assumes that the substances can move from the lumen to the arterial wall, but not in the reverse direction. Atheroma plaque growth according to the volume of species variation from the healthy to the pathological artery is measured in the paper, and it has therefore been considered that a small quantity of these species at the initial moment is not likely to dramatically modify the results. Finally, concerning the axisymmetric computational example, the model should be applied to more complex geometries such as coronary or carotid arteries with bifurcations and to real patient-specific geometries. Furthermore, an analysis should be carried out in order to assess the influence of different factors such as the geometry, the curvature or the movement of the artery wall.
Despite these limitations, given the results obtained it can be concluded that the functional regulation of the endothelium by local haemodynamic shear stress provides a model for understanding the focal propensity of atherosclerosis in the setting of systemic factors and this may help to guide future therapeutic strategies.
Funding statement
Support from the Spanish Ministry of Research and Innovation through the research project DPI2010-20746-C03-01 and financial support to M. Cilla from the Diputación General de Aragón through grant B137/09 are gratefully acknowledged.
References
- 1.Lloyd-Jones D, et al. 2009. Heart disease and stroke statistics–2009 update: a report from the American Heart Association Statistics Committee and Stroke Statistics Subcommittee. Circulation 119, 21–181. ( 10.1161/CIRCULATIONAHA.108.191261) [DOI] [PubMed] [Google Scholar]
- 2.Kyriacou SK, Humphrey JD, Schwab C. 1996. Finite element analysis of non-linear orthotropic hyperelastic membranes. Comput. Mech. 18, 269–278. ( 10.1007/BF00364142) [DOI] [Google Scholar]
- 3.Hanke H, et al. 2001. The discovery of the pathophysiological aspects of atherosclerosis—a review. Acta Chirurgica Belgica 101, 162–169. [PubMed] [Google Scholar]
- 4.Thubrikar MJ. 2007. Vascular mechanics and pathology. Berlin, Germany: Springer Science. [Google Scholar]
- 5.Wang JC, et al. 2004. Coronary artery spatial distribution of acute myocardial infarction occlusions. Circulation 110, 278–284. ( 10.1161/01.CIR.0000135468.67850.F4) [DOI] [PubMed] [Google Scholar]
- 6.Ohayon J, et al. 2011. Is arterial wall-strain stiffening an additional process responsible for atherosclerosis in coronary bifurcations?: an in vivo study based on dynamic CT and MRI. Am. J. Physiol. Heart Circ. Physiol. 301, 1097–1106. ( 10.1152/ajpheart.01120.2010) [DOI] [PMC free article] [PubMed] [Google Scholar]
- 7.Khamdaengyodtai P, Vafai K, Sakulchangsatjatai P, Terdtoon P. 2012. Effects of pressure on arterial failure. J. Biomech. 45, 2577–2588. ( 10.1016/j.jbiomech.2012.07.032) [DOI] [PubMed] [Google Scholar]
- 8.Ciofalo M, et al. 1998. Nanoscale fluid dynamics in physiological processes: a review study. Boston, MA: WIT Press. [Google Scholar]
- 9.Wang HH. 2001. Analytical models of atherosclerosis. Atherosclerosis 159, 1–7. ( 10.1016/S0021-9150(01)00655-4) [DOI] [PubMed] [Google Scholar]
- 10.Malek AM, et al. 1999. Hemodynamic shear stress and its role in atherosclerosis. J. Am. Med. Assoc. 282, 2035–2042. ( 10.1001/jama.282.21.2035) [DOI] [PubMed] [Google Scholar]
- 11.Slager CJ, Wentzel JJ, Gijsen FJH, Schuurbiers JCH, van der Wal AC, van der Steen AFW, Serruys PW. 2005a. The role of shear stress in the generation of rupture-prone vulnerable plaques. Nat. Clin. Pract. Cardiovasc. Med. 2, 401–407. ( 10.1038/ncpcardio0274) [DOI] [PubMed] [Google Scholar]
- 12.Yang N, Vafai K. 2006. Modeling of low-density lipoprotein (LDL) transport in the artery. Effects of hypertension. Int. J. Heat Mass Transf. 49, 850–867. ( 10.1016/j.ijheatmasstransfer.2005.09.019) [DOI] [Google Scholar]
- 13.Taylor C, Humphrey J. 2009. Open problems in computational vascular biomechanics: hemodynamics and arterial wall mechanics. Comp. Methods Appl. Mech. Eng. 198, 3514–3523. ( 10.1016/j.cma.2009.02.004) [DOI] [PMC free article] [PubMed] [Google Scholar]
- 14.Majno G, Joris I. 1996. Cells, tissues and disease: principles of general pathology. Cambridge, MA: Blackwell Science. [Google Scholar]
- 15.Shanahan CM, Weissberg PL. 1999. Smooth muscle cell phenotypes in atherosclerotic lesions. Curr. Opin. Lipidol. 10, 507–513. ( 10.1097/00041433-199912000-00005) [DOI] [PubMed] [Google Scholar]
- 16.Baggiolini M. 1998. Chemokines and leukocyte traffic. Nature 392, 565–568. ( 10.1038/33340) [DOI] [PubMed] [Google Scholar]
- 17.Zlotnik A, Yoshie O. 2000. Chemokines: a new classification system and their role in immunity. Immunity 12, 121–127. ( 10.1016/S1074-7613(00)80165-X) [DOI] [PubMed] [Google Scholar]
- 18.Kedem O, Katchalsky A. 1958. Thermodynamic analysis of the permeability of biological membranes to non-electrolytes. Biochim. Biophys. Acta 27, 229–246. ( 10.1016/0006-3002(58)90330-5) [DOI] [PubMed] [Google Scholar]
- 19.Yang N, Vafai K. 2008. Low-density lipoprotein (LDL) transport in an artery: a simplified analytical solution. Int. J. Heat Mass Transf. 51, 497–505. ( 10.1016/j.ijheatmasstransfer.2007.05.023) [DOI] [Google Scholar]
- 20.Snelting-Havinga I, et al. 1989. Immunoelectron microscopic visualization of the transcytosis of low density lipoproteins in perfused rat arteries. Eur. J. Cell Biol. 48, 27–36. [PubMed] [Google Scholar]
- 21.Lin SJ, Jan KM, Weinbaum S, Chien S. 1989. Transendothelial transport of low-density lipoprotein in association with cell mitosis in rat aorta. Arteriosclerosis 9, 230–236. ( 10.1161/01.ATV.9.2.230) [DOI] [PubMed] [Google Scholar]
- 22.Steinberg D, et al. 1977. A new approach to determining the rates of recruitment of circulating leukocytes into tissues: application to the measurement of leukocyte recruitment into atherosclerotic lesions. Proc. Natl Acad. Sci. USA 94, 4040–4044. ( 10.1073/pnas.94.8.4040) [DOI] [PMC free article] [PubMed] [Google Scholar]
- 23.Zhao B, et al. 2006. Constitutive receptor-independent low density lipoprotein uptake and cholesterol accumulation by macrophages differentiated from human monocytes with macrophage-colony-stimulating factor (M-CSF). J. Biol. Chem. 281, 15 757–15 762. ( 10.1074/jbc.M510714200) [DOI] [PubMed] [Google Scholar]
- 24.Howarth S, Li Z-Y, Trivedi RA, U-King-Im JM, Graves MJ, Kirkpatrick PJ, Gillard JH. 2007. Correlation of macrophage location and plaque stress distribution using USPIO-enhanced MRI in a patient with symptomatic severe carotid stenosis: a new insight into risk stratification. Br. J. Neurosurg. 21, 396–398. ( 10.1080/02688690701400775) [DOI] [PubMed] [Google Scholar]
- 25.Ougrinovskaia A, Thompson RS, Myerscough MR. 2010. An ODE model of early stages of atherosclerosis: mechanisms of the inflammatory response. Bull. Math. Biol. 72, 1534–1561. ( 10.1007/s11538-010-9509-4) [DOI] [PubMed] [Google Scholar]
- 26.Di Tomaso G, et al. 2011. A multiscale model of atherosclerotic plaque formation at its early stage. IEEE Trans. Biomed. Eng. 58, 3460–3463. ( 10.1109/TBME.2011.2165066) [DOI] [PubMed] [Google Scholar]
- 27.Chung S, Vafai K. 2013. Low-density lipoprotein transport within a multi-layered arterial wall-effect of the atherosclerotic plaque/stenosis. J. Biomech. 46, 574–585. ( 10.1016/j.jbiomech.2012.09.022) [DOI] [PubMed] [Google Scholar]
- 28.Chung S, Vafai K. 2012. Effect of the fluid–structure interactions on low density lipoprotein transport within a multi-layered arterial wall. J. Biomech. 45, 371–381. ( 10.1016/j.jbiomech.2011.10.002) [DOI] [PubMed] [Google Scholar]
- 29.Zohdi TI, Holzapfel A, Berger SA. 2004. A phenomenological model for atherosclerotic plaque growth and rupture. J. Theor. Biol. 227, 437–443. ( 10.1016/j.jtbi.2003.11.025) [DOI] [PubMed] [Google Scholar]
- 30.Cobbold CA, et al. 2002. Lipoprotein oxidation and its significance for atherosclerosis: a mathematical approach. Bull. Math. Biol. 64, 65–95. ( 10.1006/bulm.2001.0267) [DOI] [PubMed] [Google Scholar]
- 31.Gessaghi VC, Raschi MA, Tanoni DY, Perazzo CA, Larreteguy AE. 2011. Growth model for cholesterol accumulation in the wall of a simplified 3D geometry of the carotid bifurcation. Comp. Methods Appl. Mech. Eng. 200, 2117–2125. ( 10.1016/j.cma.2011.03.001) [DOI] [Google Scholar]
- 32.Fok PW. 2012. Mathematical model of intimal thickening in atherosclerosis: vessel stenosis as a free boundary problem. J. Theor. Biol. 314, 23–33. ( 10.1016/j.jtbi.2012.07.029) [DOI] [PubMed] [Google Scholar]
- 33.Siogkas P, et al. 2011. Multiscale-patient-specific artery and atherogenesis models. IEEE Trans. Biomed. Eng. 58, 3464–3468. ( 10.1109/TBME.2011.2164919) [DOI] [PubMed] [Google Scholar]
- 34.Calvez V, Ebde A, Meunier N, Raoult A. 2009. Mathematical modelling of the atherosclerotic plaque formation. ESAIM Proc. 28, 1–12. ( 10.1051/proc/2009036) [DOI] [Google Scholar]
- 35.Bulelzai MAK, Dubbeldam JLA. 2012. Long time evolution of atherosclerotic plaques. J. Theor. Biol. 297, 1–10. ( 10.1016/j.jtbi.2011.11.023) [DOI] [PubMed] [Google Scholar]
- 36.Khakpour M, Vafai K. 2008. Critical assessment of arterial transport models. Int. J. Heat Mass Transf. 51, 807–822. ( 10.1016/j.ijheatmasstransfer.2007.04.021) [DOI] [Google Scholar]
- 37.Khakpour M, Vafai K. 2008. A comprehensive analytical solution of macromolecular transport within an artery. Int. J. Heat Mass Transf. 51, 2905–2913. ( 10.1016/j.ijheatmasstransfer.2007.09.019) [DOI] [Google Scholar]
- 38.Khakpour M, Vafai K. 2008. Effects of gender-related geometrical characteristics of aorta–iliac bifurcation on hemodynamics and macromolecule concentration distribution. Int. J. Heat Mass Transf. 51, 5542–5551. ( 10.1016/j.ijheatmasstransfer.2008.04.025) [DOI] [Google Scholar]
- 39.Prosi M, Zunino P, Perktold K, Quarteroni A. 2005. Mathematical and numerical models for transfer of low-density lipoproteins through the arterial walls: a new methodology for the model set up with applications to the study of disturbed lumenal flow. J. Biomech. 38, 903–917. ( 10.1016/j.jbiomech.2004.04.024) [DOI] [PubMed] [Google Scholar]
- 40.Sun N, Wood NB, Hughes AD, Thom SAM, Xu XY. 2006. Fluid–wall modelling of mass transfer in an axisymmetric stenosis: effects of sheardependent transport properties. Ann. Biomed. Eng. 34, 1119–1128. ( 10.1007/s10439-006-9144-2) [DOI] [PubMed] [Google Scholar]
- 41.Olgac U, et al. 2008. Computational modeling of coupled blood–wall mass transport of LDL: effects of local wall shear stress. Am. J. Physiol. Heart Circ. Physiol. 294, 909–919. ( 10.1152/ajpheart.01082.2007) [DOI] [PubMed] [Google Scholar]
- 42.Davignon J, Ganz P. 2004. Role of endothelial dysfunction in atherosclerosis. Circulation 109, 27–32. ( 10.1161/01.CIR.0000115644.35804.8B) [DOI] [PubMed] [Google Scholar]
- 43.Caro CG, et al. 1978. The mechanics of the circulation. Oxford, UK: Oxford University Press. [Google Scholar]
- 44.Nichols WW, ORourke MF. 1990. McDonalds blood flow in arteries, 3rd edn Philadelphia, PA: Lea & Febiger. [Google Scholar]
- 45.Khaled ARA, Vafai K. 2003. The role of porous media on modeling flow and heat transfer in biological tissues. Int. J. Heat Mass Transf. 46, 4989–5003. ( 10.1016/S0017-9310(03)00301-6) [DOI] [Google Scholar]
- 46.Iliceto S, Marangelli V, Memmola C, Rizzon P. 1991. Transesophageal Doppler echocardiography evaluation of coronary blood flow velocity in baseline conditions and during dipyridamole-dipyridamole-induced coronary vasodilation. Circulation 83, 61–69. ( 10.1161/01.CIR.83.1.61) [DOI] [PubMed] [Google Scholar]
- 47.Gefen A. 2012. Patient-specific modeling in tomorrows medicine. Series: studies in mechanobiology, tissue engineering and biomaterials, vol. 9. Berlin, Germany: Springer. [Google Scholar]
- 48.Ogunrinade O, Kameya GT, Truskey GA. 2002. Effect of fluid shear stress on the permeability of the arterial endothelium. Ann. Biomed. Eng. 30, 430–446. ( 10.1114/1.1467924) [DOI] [PubMed] [Google Scholar]
- 49.Tarbell JM. 2003. Mass transport in arteries and the localization of atherosclerosis. Annu. Rev. Biomed. Eng. 5, 79–118. ( 10.1146/annurev.bioeng.5.040202.121529) [DOI] [PubMed] [Google Scholar]
- 50.Huang Y, et al. 1994. A fiber-matrix model for the growth of macromolecular leakage spots in the arterial intima. ASME J. Biomech. Eng. 116, 430–445. ( 10.1115/1.2895794) [DOI] [PubMed] [Google Scholar]
- 51.Weinbaum S, et al. 1985. Effect of cell turnover and leaky junctions on arterial macromolecular transport. Am. J. Physiol. Heart Circ. Physiol. 248, 945–960. [DOI] [PubMed] [Google Scholar]
- 52.Curry FE. 1984. Mechanics and thermodynamics of transcapillary exchange. Handbook of physiology. The cardiovascular system. Microcirculation. Bethesda, MD: American Physiological Society. [Google Scholar]
- 53.Khan FH. 2009. The elements of immunology. Delhi, India: Pearson Education. [Google Scholar]
- 54.Meyer G, Merval R, Tedgui A. 1996. Effects of pressure-induced stretch and convection on low-density lipoprotein and albumin uptake in the rabbit aortic wall. Circ. Res. 79, 532–540. ( 10.1161/01.RES.79.3.532) [DOI] [PubMed] [Google Scholar]
- 55.Chang CL. 2011. Lipoprotein lipase in the arterial wall: regulation by dietary fatty acids. PhD thesis, Columbia University. [Google Scholar]
- 56.Schwenke D, Carew T. 1989. Initiation of atherosclerotic lesions in cholesterol-fed rabbits, II: selective retention of LDL vs. selective increases in LDL permeability in susceptible sites of arteries. Arteriosclerosis 9, 908–918. ( 10.1161/01.ATV.9.6.908) [DOI] [PubMed] [Google Scholar]
- 57.Ai L, Vafai K. 2006. A coupling model for macromolecule transport in a stenosed arterial wall. Int. J. Heat Mass Transf. 49, 1568–1591. ( 10.1016/j.ijheatmasstransfer.2005.10.041) [DOI] [Google Scholar]
- 58.Cancel L, Fitting A, Tarbell JM. 2007. In vitro study of LDL transport under pressurized (convective) conditions. Am. J. Physiol. Heart Circ. Physiol. 293, 126–132. ( 10.1152/ajpheart.01188.2006) [DOI] [PubMed] [Google Scholar]
- 59.Gijsen FJH, et al. 2008. Strain distribution over plaques in human coronary arteries relates to shear stress. Am. J. Physiol. Heart Circ. Physiol. 295, 1608–1614. ( 10.1152/ajpheart.01081.2007) [DOI] [PubMed] [Google Scholar]
- 60.Cavaillon JM. 1994. Cytokines and macrophages. Biomed. Pharmacother. 48, 445–453. ( 10.1016/0753-3322(94)90005-1) [DOI] [PubMed] [Google Scholar]
- 61.Chamley-Campbell JH, et al. 1981. Phenotype-dependent response of cultured aortic smooth muscle to serum mitogens. J. Cell Biol. 89, 379–383. ( 10.1083/jcb.89.2.379) [DOI] [PMC free article] [PubMed] [Google Scholar]
- 62.Zahedmanesh H, Van Oosterwyck H, Lally C. 2012. A multi-scale mechanobiological model of in-stent restenosis: deciphering the role of matrix metalloproteinase and extracellular matrix changes. Comp. Methods Biomech. Biomed. Eng. ( 10.1080/10255842.2012.716830) [DOI] [PubMed] [Google Scholar]
- 63.Griffin CA, Apponi LH, Long KK, Pavlath GK. 2010. Chemokine expression and control of muscle cell migration during myogenesis. J. Sci. 123, 3052–3060. ( 10.1242/jcs.066241) [DOI] [PMC free article] [PubMed] [Google Scholar]
- 64.Garikipati K, et al. 2004. A continuum treatment of growth in biological tissue: the coupling of mass transport and mechanics. J. Mech. Phys. Solids 52, 1595–1625. ( 10.1016/j.jmps.2004.01.004) [DOI] [Google Scholar]
- 65.Sáez P, Pena E, Martinez MA, Kuhl E. 2012. Mathematical modeling of collagen turnover in biological tissue. J. Math. Biol. ( 10.1007/s00285-012-0613-y) [DOI] [PubMed] [Google Scholar]
- 66.Nakanoa A, et al. 2007. The three-dimensional structure of vascular smooth muscle cells: a confocal laser microscopic study of rabbit mesenteric arterioles. Asian Biomed. 1, 77–86. [Google Scholar]
- 67.Petty HR, et al. 1980. Lateral distribution and diffusion of the C3b receptor of complement, HLA antigens, and lipid probes in peripheral blood leukocytes. Proc. Natl Acad. Sci. USA 77, 6587–6591. ( 10.1073/pnas.77.11.6587) [DOI] [PMC free article] [PubMed] [Google Scholar]
- 68.Budu-Grajdeanu P, et al. 2008. A mathematical model of venous neointimal hyperplasia formation. Theor. Biol. Med. Model. 5, 2 ( 10.1186/1742-4682-5-2) [DOI] [PMC free article] [PubMed] [Google Scholar]
- 69.Esterbauer H, Striegl G, Puhl H, Rotheneder M. 1989. Continuous monitoring of in vitro oxidation of human low density lipoprotein. Free Radic. Res. Commun. 6, 67–75. ( 10.3109/10715768909073429) [DOI] [PubMed] [Google Scholar]
- 70.Krstic RV. 1997. Human microscopic anatomy: an atlas for students of medicine and biology. Berlin, Germany: Springer. [Google Scholar]
- 71.Kruth HS, et al. 2002. Macrophage foam cell formation with native low density lipoprotein. J. Biol. Chem. 277, 34 573–34 580. ( 10.1074/jbc.M205059200) [DOI] [PubMed] [Google Scholar]
- 72.Zhao W, et al. 2005. Cytokine production by skin-derived mast cells: endogenous proteases are responsible for degradation of cytokines. J. Immunol. 175, 2635–2642. [DOI] [PubMed] [Google Scholar]
- 73.Humphrey JD. 2002. Cardiovascular solid mechanics: cells, tissues, and organs. Berlin, Germany: Springer. [Google Scholar]
- 74.Krombach F, et al. 1997. Cell size of alveolar macrophages: an interspecies comparison. Environ. Health Perspect. 105, 1261–1263. [DOI] [PMC free article] [PubMed] [Google Scholar]
- 75.Martini FH. 2012. Ch. 10 Muscle tissue. In Fundamentals of Anatomy & Physiology. Upper Saddle River, NY: Pearson Education. [Google Scholar]
- 76.Milnor WR. 1989. Hemodynamics, 2nd edn Baltimore, MD: Williams and Wilkins. [Google Scholar]
- 77.Vargas CB, et al. 1979. Hydraulic conductivity of the endothelial and outer layers of the rabbit aorta. Am. J. Physiol. Heart Circ. Physiol. 236, 53–60. [DOI] [PubMed] [Google Scholar]
- 78.Tedgui A, Lever MJ. 1984. Filtration through damaged and undamaged rabbit thoracic aorta. Am. J. Physiol. Heart Circ. Physiol. 247, 784–791. [DOI] [PubMed] [Google Scholar]
- 79.Dodge JT, Brown BG, Bolson EL, Dodge HT. 1992. Lumen diameter of normal human coronary arteries Influence of age, sex, anatomic variation, and left ventricular hypertrophy or dilation. Circulation 86, 232–246. ( 10.1161/01.CIR.86.1.232) [DOI] [PubMed] [Google Scholar]
- 80.Steinman DA. 2004. Image-based computational fluid dynamics: a new paradigm for monitoring hemodynamics and atherosclerosis. Curr. Drug Targets Cardiovasc. Hematol. Disord. 4, 183–197. ( 10.2174/1568006043336302) [DOI] [PubMed] [Google Scholar]
- 81.Chien S. 2008. Effects of disturbed flow on endothelial cells. Ann. Biomed. Eng. 36, 554–562. ( 10.1007/s10439-007-9426-3) [DOI] [PMC free article] [PubMed] [Google Scholar]
- 82.Slager CJ, Wentzel JJ, Gijsen FJH, Thury A, van der Wal AC, Schaar JA, Serruys PW. 2005. The role of shear stress in the destabilization of vulnerable plaques and related therapeutic implications. Nat. Clin. Pract. Cardiovasc. Med. 9, 456–464. ( 10.1038/ncpcardio0298) [DOI] [PubMed] [Google Scholar]
- 83.Dimmeler S, Hermann C, Galle J, Zeiher AM. 1999. Upregulation of superoxide dismutase and nitric oxide synthase mediates the apoptosis-suppressive effects of shear stress on endothelial cells. Arterioscler. Thromb. Vasc. Biol. 19, 656–664. ( 10.1161/01.ATV.19.3.656) [DOI] [PubMed] [Google Scholar]
- 84.Tricot O, Mallat Z, Heymes C, Belmin J, Leseche G, Tedgui A. 2000. Relation between endothelial cell apoptosis and blood flow direction in human atherosclerotic plaques. Circulation 101, 2450–2453. ( 10.1161/01.CIR.101.21.2450) [DOI] [PubMed] [Google Scholar]
- 85.Achenbach S. 2008. Quantification of coronary artery stenoses by computed tomography. JACC Cardiovasc. Imaging 1, 472–474. ( 10.1016/j.jcmg.2008.05.008) [DOI] [PubMed] [Google Scholar]


