

Abstract
The experimental autoimmune encephalomyelitis (EAE) is an autoimmune disease of the central nervous system commonly used to study multiple sclerosis (MS). We combined clinical EAE phenotypes with genome-wide expression profiling in spleens from 150 backcross rats between susceptible DA and resistant PVG rat strains during the chronic EAE phase. This enabled correlation of transcripts with genotypes, other transcripts and clinical EAE phenotypes and implicated potential genetic causes and pathways in EAE. We detected 2285 expression quantitative trait loci (eQTLs). Sixty out of 599 cis-eQTLs overlapped well-known EAE QTLs and constitute positional candidate genes, including Ifit1 (Eae7), Atg7 (Eae20-22), Klrc3 (eEae22) and Mfsd4 (Eae17). A trans-eQTL that overlaps Eae23a regulated a large number of small RNAs and implicates a master regulator of transcription. We defined several disease-correlated networks enriched for pathways involved in cell-mediated immunity. They include C-type lectins, G protein coupled receptors, mitogen-activated protein kinases, transmembrane proteins, suppressors of transcription (Jundp2 and Nr1d1) and STAT transcription factors (Stat4) involved in interferon signaling. The most significant network was enriched for T cell functions, similar to genetic findings in MS, and revealed both established and novel gene interactions. Transcripts in the network have been associated with T cell proliferation and differentiation, the TCR signaling and regulation of regulatory T cells. A number of network genes and their family members have been associated with MS and/or other autoimmune diseases. Combining disease and genome-wide expression phenotypes provides a link between disease risk genes and distinct molecular pathways that are dysregulated during chronic autoimmune inflammation.
INTRODUCTION
A predisposition to develop a complex disease such as multiple sclerosis (MS) is regulated by numerous genetic variants that each contribute small effects (1). Clinically, MS is characterized by immune-mediated destruction of myelin sheaths and axons in the central nervous system, leading to progressive disability. Despite recent substantial progress in deciphering genetic variants that contribute to susceptibility (2), little is known about the functional outcomes of these risk-associated variants, in part due to limitations in access of relevant human samples. In addition, identified risk alleles together explain only a fraction of disease heritability and variance (2). Additional risk variants conferring small effects may contribute to heritability of complex diseases, and the clustering of genes (below thresholds for significant association with MS) into functional networks supports this hypothesis (3). Unraveling the functions of susceptibility genes through identification of pathways enriched with risk genes can reveal mechanisms central in disease regulation.
An animal model widely utilized to characterize the genetic basis and disease mechanisms of relevance for MS is experimental autoimmune encephalomyelitis (EAE). Myelin oligodendrocyte glycoprotein (MOG)-induced EAE in rats mimics many features of MS (4), including inflammation and demyelination, relapses and remissions and immune cell infiltration. Linkage analysis in experimental animal crosses can readily detect quantitative trait loci (QTLs) related to clinical traits of complex diseases, and over 50 QTLs have been identified in EAE (5). Several genes underlying QTL effects in rats were positionally cloned and a number of them have been subsequently confirmed to regulate human counterpart (6). However, it has been challenging to define single quantitative trait genes (7).
Given the high heritability of variation in gene expression (8), identifying determinants of gene expression may give insights into pathogenic mechanisms of complex traits. The approach of mapping quantitative variation in gene expression was introduced in 2001 (9,10). This approach yields expression QTLs (eQTLs) (11), which influence expression of transcripts either in cis or in trans, where cis-acting eQTLs are located in close proximity of the target gene itself, while trans-acting eQTLs are located in a region distant from the gene it regulates. Technical artifacts excluded (e.g. hybridization differences) (12); cis-regulatory effects can usually be mapped with high statistical significance and could be explained in most cases by a variation in DNA sequence in the regulatory regions of the target gene (13). Cis-eQTLs that overlap trait QTLs constitute plausible candidate genes underlying the trait QTL effect. During the last decade, the use of genome-wide expression profiling combined with linkage analysis in segregating populations has identified genomic variations that regulate complex traits in experimental models (6,14,15). In addition, the approach has been utilized to characterize genetically driven networks of genes giving insights into pathways and functions critical for the trait of interest (16).
In this study, we combined genome-wide expression analysis in spleen from an experimental backcross (BC) between EAE-susceptible Dark Agouti (DA) and EAE-resistant Piebald Viral Glaxo (PVG) rat strains during the chronic phase of EAE with clinical EAE phenotypes and classical EAE QTLs. These two inbred rat strains have been extensively used in our laboratory to characterize EAE QTLs (5,17–27). We characterized several potential positional candidate genes for known EAE QTLs that provide a good base for further functional studies. Genome-wide expression analysis in the chronic stage EAE enabled correlation of transcripts not only with genotypes and to each-other but also with the clinical EAE phenotypes. We defined several disease-correlated gene networks partially genetically regulated by loci that predispose for EAE. Some were enriched for pathways involved in cell-mediated immune mechanisms of relevance for EAE and MS, and also included genes or family members of genes associated with MS.
RESULTS
Overview of eQTLs in the chronic stage of EAE
We used the eQTL approach to identify candidate genes and pathways that regulate EAE. This was achieved by combining clinical EAE phenotypes in a BC with whole-genome transcript expression analysis in splenic tissue from 150 BC male rats. Spleens were collected at day 35 after induction of EAE and expression was measured using Affymetrix Rat Gene 1.0 ST Arrays. The evidence for linkage was tested between genotype and gene expression (27342 transcripts) to identify hereditary components and revealed a total of 2285 eQTLs with genome-wide significance of P ≤ 0.05 (Table 1, Supplementary Material, Tables S1 and S2). By introducing clinical traits as covariates that had been recorded during the clinical EAE experiments, we evaluated if the detection of eQTLs depends on disease incidence and severity. A majority of detected eQTLs did not depend on disease incidence or severity, as depicted in the Venn diagram (Fig. 1A). Thus, we report only EAE status as a disease covariate in Table 1. An overview of cis- and trans-acting eQTLs across the genome is presented in Figure 1B.
Table 1.
Cis- and trans-eQTLs detected in EAE spleen day 35 post-immunization
| Chr | Transcript |
EAE(a) | EAE(i) | |||
|---|---|---|---|---|---|---|
| cis | trans | cis | trans | cis | trans | |
| 1 | 123 (20) | 264 (12) | 106 (32) | 216 (69) | 80 (26) | 71 (15) |
| 2 | 69 | 196 | 51 | 142 | 35 | 46 |
| 3 | 23 | 20 | 19 | 15 | 17 | 18 |
| 4 | 64 (47) | 8 (6) | 62 (50) | 8 (6) | 59 (50) | 13 (7) |
| 5 | 7 | 17 | 6 | 13 | 9 | 20 |
| 6 | 45 | 71 | 39 (8) | 57 (4) | 37 (9) | 105 (14) |
| 7 | 14 (2) | 5 (1) | 13 (1) | 3 (1) | 8 | 6 (2) |
| 8 | 25 (9) | 12 (4) | 27 (2) | 24 | 26 (3) | 89 (3) |
| 9 | 11 | 4 | 11 | 6 | 8 | 8 |
| 10 | 21 (17) | 24 (20) | 20 (17) | 32 (29) | 14 (11) | 22 (21) |
| 11 | 14 | 35 | 13 | 45 | 24 | 509 |
| 12 | 10 | 11 (1) | 10 | 10 (1) | 10 | 9 |
| 13 | 14 (3) | 15 (5) | 13 (2) | 12 (2) | 11 (3) | 10 (1) |
| 14 | 13 (3) | 17 (2) | 10 (3) | 9 (3) | 9 (3) | 6 (2) |
| 15 | 38 | 49 | 32 | 31 | 24 | 8 |
| 16 | 31 | 172 | 25 | 74 | 25 | 258 |
| 17 | 28 (5) | 643 (141) | 24 (7) | 408 (102) | 10 (2) | 158 (31) |
| 18 | 14 | 20 | 13 | 17 | 5 | 7 |
| 19 | 15 | 56 | 13 | 44 | 11 | 34 |
| 20 | 4 | 34 | 5 | 38 | 3 | 14 |
| X | 16 | 13 | 17 | 9 | 15 | 16 |
| Total | 599 (106) | 1686 (192) | 529 (122) | 1213 (217) | 440 (107) | 1427 (96) |
Number of cis- and trans-regulated transcripts for each chromosome and total (rows) for a selection of clinical phenotypes as covariates (column pairs). eQTLs were selected to have a logarithm of odds score ≥ 2 (generated with the Haley–Knott regression model in R/qtl) and a genome-wide corrected P-value of ≤0.05 (generated with 1000 permutations). Numbers in parentheses refer to the subset of transcripts controlled by loci in EAE QTLs (see Supplementary Material, Table S5). Abbreviations: eQTL, expression quantitative trait locus; Chr, chromosome; Transcript, no covariate; EAE(a), incidence of EAE as covariate, additive model; EAE(i), incidence of EAE as covariate, interactive model.
Figure 1.
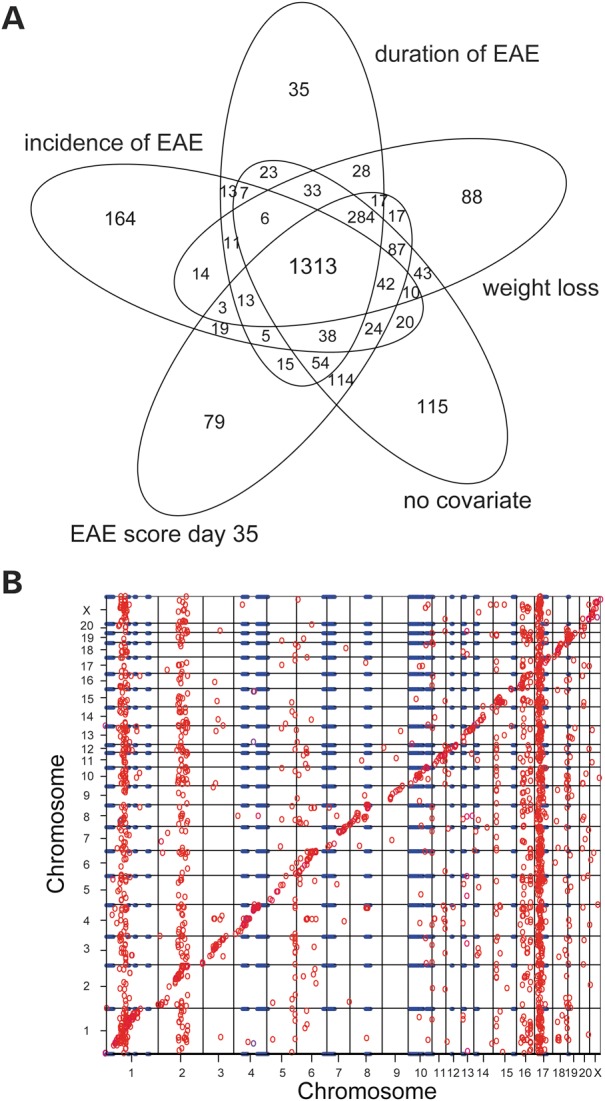
Expression QTLs in chronic stage EAE. (A) Venn diagram indicating the number of overlapping transcripts when performing a whole genome scan for eQTLs using different clinical disease variables as covariates. (B) Scatter plot with the x-axis depicts the genomic position of the eQTL and the y-axis depicts the genomic location of the target gene. Each circle represents a significant cis- or trans-eQTL (no covariates used in the model). Blue lines represent EAE QTLs identified in the DA and PVG strain combination. The diagonal band indicates cis-eQTLs and the off-diagonal circles represent trans-eQTLs. Vertical trans-eQTL bands reflect genomic regions that control many transcripts. eQTLs were generated with the Haley–Knott regression model in R/qtl; LOD ≥ 2; genome-wide corrected P-value ≤0.05.
Co-localized trans eQTLs
Trans-acting eQTLs (Fig. 1B and Supplementary Material, Table S2) do not involve DNA variation in the expressed transcript in question; instead, the transcript is regulated by other more distant genetic variations. Therefore, trans-regulation can denote a genomic location of a master regulator of transcription (16). Functional analysis using ingenuity pathways analysis (IPA) revealed a significant association of trans-regulated genes with liver × receptor/retinoid × receptor activation, nuclear receptors involved in transcriptional regulation (28) and inactivation of platelet activating factor (Supplementary Material, Tables S3 and S4). Vertical trans-bands of co-localized eQTLs reflect the genomic position of a regulator of multiple eQTL transcripts (29, 30). Such bands were observed on rat chromosomes (RNO) 1, 2 and 17, with the trans-band on RNO17 overlapping an EAE regulating QTL, Eae23a, related to several clinical traits of complex disease (26). Although the trans-band on RNO17 was not enriched for a functional pathway, we observed regulation of many small nucleolar RNA genes and spliceosomal small nuclear RNAs from this genomic region (Supplementary Material, Table S2). These have been reported to be involved in epigenetic modifications (31) and the formation of spliceosomes (32), respectively. Additionally, we observed that genes in these families negatively correlate with disease phenotypes.
Candidate genes denoted by cis eQTLs
A cis-acting eQTL directly identifies expression variations in a gene that in turn can regulate a physiological trait or molecular pathway. One of the most significant cis-eQTLs was the regulator of G-protein signaling 4 (Rgs4) (Table 2) on RNO13. We performed IPA analysis and recorded that Rgs4 and its most correlated transcripts associated with cell proliferation and migration, integrin and endocytosis signaling (Supplementary Material, Tables S3 and S4). Although Rgs4 does not reach a genome-wide significance in human GWAS, it is of interest that its family member Rgs1 is associated with MS (33) and that the Rgs14 gene region is associated with Crohn's disease, another disease with chronic inflammatory features (34).
Table 2.
Strong cis-eQTLs mapping outside of known EAE QTLs in DA/PVG.1av1 crosses
| Chr | LODa | Meanb | Rat eQTLc | Genomicd | Gene symbol | Gene name |
|---|---|---|---|---|---|---|
| cis-eQTL | Expression | Probe set | Location | |||
| 1 | 27.2 | 117.7 | 10703445 | 56730912 | Fpr3 | Formyl peptide receptor 3 |
| 1 | 12.0 | 137.6 | 10703706 | 63694428 | Lilrb3 | Leukocyte immunoglobulin-like receptor, subfamily |
| 1 | 13.2 | 217.4 | 10719648 | 79504886 | Zfp61 | Zinc finger protein 61 |
| 1 | 10.3 | 519.0 | 10706297 | 93734935 | Siglec5 | Sialic acid-binding Ig-like lectin 5 |
| 1 | 12.9 | 348.9 | 10724073 | 159055461 | Art2 | t-Cell ecto-ADP-ribosyltransferase 1 |
| 1 | 16.6 | 78.5 | 10724164 | 159590904 | Chrna10 | Cholinergic receptor, nicotinic, alpha polypeptide |
| 1 | 13.3 | 59.8 | 10711944 | 198987150 | Lrrc27 | Leucine rich repeat containing 27 |
| 1 | 13.7 | 251.6 | 10728904 | 213828858 | Ms4a7 | Membrane-spanning 4-domains, subfamily A, member 7 |
| 1 | 10.1 | 355.8 | 10728918 | 214162552 | Ms4a6a | Membrane-spanning 4-domains, subfamily A, member 6 |
| 1 | 18.5 | 97.9 | 10714106 | 215590616 | Fam111a | Family with sequence similarity 111, member A (NP_001102633.1) |
| 2 | 14.6 | 413.1 | 10823903 | 173683154 | Gucy1b3 | Guanylate cyclase 1, soluble, beta 3 |
| 2 | 28.6 | 145.2 | 10816144 | 175479320 | Sfrp2 | Secreted frizzled-related protein 2 |
| 2 | 12.0 | 263.3 | 10824357 | 180974111 | Msto1 | Misato homolog 1 |
| 2 | 12.7 | 114.7 | 10824611 | 182644098 | Slc27a3 | Long-chain fatty acid transport protein 3 |
| 2 | 10.7 | 221.3 | 10819690 | 244323411 | Mcoln2 | Mucolipin 2 |
| 3 | 10.2 | 78.6 | 10844331 | 11511403 | Lcn2 | Lipocalin 2 |
| 3 | 12.3 | 168.9 | 10847957 | 90174952 | Prrg4 | Transmembrane gamma-carboxyglutamic acid protein 4 |
| 3 | 24.9 | 121.2 | 10848652 | 106548815 | Sptbn5 | Spectrin, beta, non-erythrocytic 5 |
| 4 | 11.4 | 400.7 | 10866507 | 173884317 | Art4 | Ecto-ADP-ribosyltransferase 4 |
| 4 | 10.0 | 334.6 | 10859337 | 174009860 | Pde6h | Phosphodiesterase 6H, cGMP-specific, cone, gamma |
| 5 | 14.9 | 136.4 | 10875425 | 24893573 | RGD1309085 | Similar to F23N19.9 |
| 5 | 10.2 | 114.7 | 10867761 | 32352311 | Mmp16 | Matrix metalloproteinase-16 |
| 5 | 10.9 | 62.8 | 10877130 | 77010784 | Ptgr1 | Prostaglandin reductase 1 |
| 5 | 10.8 | 586.7 | 10869288 | 77924255 | Snx30 | Sorting nexin family member 30 |
| 6 | 10.7 | 1359.5 | 10892653 | 142735827 | Igh-6 | Immunoglobulin heavy chain 6 |
| 6 | 25.7 | 267.3 | 10892662 | 142977680 | IgG-2a | Gamma-2a immunoglobulin heavy chain |
| 7 | 11.6 | 260.5 | 10904539 | 112913724 | Ly6k | Lymphocyte antigen 6 complex, locus K |
| 7 | 16.1 | 536.7 | 10904597 | 113434499 | Ly6a | Lymphocyte antigen 6 complex, locus A (predicted) |
| 7 | 15.0 | 509.1 | 10898196 | 121816012 | Mpped1 | Metallophosphoesterase domain containing 1 |
| 9 | 16.3 | 127.8 | 10929288 | 79091425 | Serpine2 | Serine (or cysteine) proteinase inhibitor, clade E |
| 11 | 10.5 | 34.5 | 10751434 | 66357714 | Csta | Cystatin A (stefin A) |
| 11 | 12.6 | 76.6 | 10754876 | 70653993 | LOC684506 | Similar to SMP3 mannosyltransferase |
| 12 | 15.8 | 109.3 | 10762254 | 36896819 | Oas1k | 2′–5′ oligoadenylate synthetase 1K |
| 13 | 29.0 | 158.8 | 10769672 | 85533882 | Rgs4 | Regulator of G-protein signaling 4 |
| 13 | 10.2 | 301.6 | 10765469 | 86096465 | Sh2d1b1 | Similar to EWS/FLI1 activated transcript 2 |
| 14 | 24.2 | 135.0 | 10776325 | 33403956 | LOC498350 | Similar to testicular haploid expressed gene product isoform 2 |
| 14 | 10.3 | 45.5 | 10778820 | 109197351 | Ccdc85a | Coiled-coil domain containing 85A |
| 16 | 17.5 | 229.3 | 10787757 | 22852487 | Csgalnact1 | Chondroitin sulfate N-acetylgalactosaminyltransferase 1 |
| 16 | 26.5 | 409.1 | 10789670 | 84885522 | Lig4 | DNA ligase 4 |
| 18 | 15.4 | 140.2 | 10804396 | 40914028 | Cdo1 | Cysteine dioxygenase 1, cytosolic |
| X | 14.4 | 236.7 | 10936742 | 21117225 | GPR34 | G-protein-coupled receptor GPR34 (predicted) |
| X | 16.9 | 73.6 | 10937013 | 26697034 | Kcnd1 | Potassium voltage-gated channel, Shal-related subfamily, member 1 |
| X | 26.8 | 106.0 | 10932773 | 35143324 | Chrdl1 | Kohjirin |
| X | 11.8 | 68.2 | 10939319 | 122209367 | Armcx6 | Armadillo repeat containing, X-linked 6 |
| X | 12.8 | 209.6 | 10939498 | 127688736 | LOC678934 | Similar to CG30327-PA |
eQTLs were selected to have a logarithm of odds (LOD) score ≥ 10 and a genome-wide corrected P-value ≤0.05 (generated with 1000 permutations). Cis-eQTLs were considered those having no genetic marker between the peak of the linkage score and the chromosomal region coding the transcript. Genes in bold are differentially expressed between DA and PVG in day 7 post-immunization ex vivo LN cells and/or in MOG re-stimulated conditions (49).
Abbreviations: QTL, quantitative trait locus; LOD, logarithm of the odds ratio; eQTL, expression quantitative trait locus; Chr, chromosome.
aLOD score of cis-eQTL for probe sets generated with the Haley–Knott regression model, no covariates, in R/qtl.
bAverage probe set expression level.
cProbe ID annotation from Affymetrix Rat Gene 1.0 ST array.
dGenomic location of the transcript, start, in mega base pairs.
In the next stage, we combined eQTL analysis with classical EAE QTLs. Analysis of EAE QTLs that segregate between DA and PVG strains was performed in a larger set of 421 BC rats, encompassing 150 rats used for eQTL analysis, and all EAE QTLs are reported in Supplementary Material, Table S5 (Stridh et al., unpublished data). A large proportion of the QTLs also showed evidence of linkage in a subset of 150 animals used for eQTL analysis, albeit with less significance due to decreased power in a smaller sample. Therefore, we focused on all well-established EAE QTLs that have been identified in more than one well-powered study (Table 3, Supplementary Material, Table S5), while emphasizing the QTLs identified in this BC (Table 3).
Table 3.
Cis-eQTLs mapping to EAE QTLs in DA/PVG.1av1 crosses
| EAE QTL | Chr | EAEa QTL | LODb | Meanc | Ratd eQTL | Genomice | Gene symbol | Gene name |
|---|---|---|---|---|---|---|---|---|
| Position | cis-eQTL | Expression | Probe Set | Location | ||||
| Eae29 | 1 | 0–25 | 20.8 | 34.5 | 10701620 | 5473 | RGD1564110_predicted | Similar to putative pheromone receptor (predicted) |
| Eae29 | 1 | 8.5 | 33.5 | 10716526 | 245161 | LOC365029 | Similar to vomeronasal 2, receptor, 1 | |
| Eae29 | 1 | 24.8 | 80.6 | 10701668 | 1498164 | LOC678740 | Similar to vomeronasal 2, receptor, 1 | |
| Eae29 | 1 | 42.4 | 34.5 | 10701671 | 1503580 | LOC687363 | Similar to vomeronasal 2, receptor, 1 | |
| Eae29 | 1 | 24.5 | 41.4 | 10716562 | 1524789 | LOC286986 | Putative pheromone receptor Go-VN13C | |
| Eae29 | 1 | 15.8 | 64.7 | 10716568 | 1524798 | LOC286986 | Putative pheromone receptor Go-VN13C | |
| Eae29 | 1 | 38.9 | 63.6 | 10701674 | 1636457 | LOC308240 | Hypothetical LOC308240 | |
| Eae29 | 1 | 20.5 | 68.0 | 10701684 | 1694318 | RGD1565235_predicted | Similar to Retinoic acid early inducible protein 1 | |
| Eae29 | 1 | 14.0 | 60.7 | 10716603 | 2121666 | RGD1565235_predicted | Similar to Retinoic acid early inducible protein 1 | |
| Eae30 | 1 | 7.5 | 429.4 | 10711299 | 187396184 | Itgax | Integrin, alpha X | |
| Eae30 | 1 | 6.2 | 388.2 | 10711664 | 190987657 | Acadsb | Short/branched chain specific acyl-CoA dehydrogenase | |
| Eae30 | 1 | 5.7 | 67.0 | 10726371 | 193384041 | Adam12_predicted | A disintegrin and metallopeptidase domain 12 | |
| Eae7 | 1 | 238–258 | 4.8 | 623.1 | 10714907 | 238609169 | Ifit1 | Interferon-induced protein with tetratricopeptide repeats 1 |
| Eae24 | 4 | 59–75 | 11.9 | 68.2 | 10854406 | 61714290 | Akr1b8 | Aldo-keto reductase family 1, member B8 |
| Eae24 | 4 | 7.5 | 200.2 | 10861946 | 65674808 | D630045J12Rik | ‘ENSRNOT00000040391’ | |
| Eae24 | 4 | 5.6 | 221.2 | 10854637 | 66232348 | Clec2l | c-Type lectin domain family 2, member L | |
| Eae24 | 4 | 8.5 | 77.6 | 10854942 | 69011941 | RGD1560283_predicted | Similar to trypsinogen 8 (predicted) | |
| Eae24 | 4 | 13.4 | 91.4 | 10862184 | 69022614 | RGD1560283_predicted | Similar to trypsinogen 8 (predicted) | |
| Eae25 | 4 | 75–83 | 3.9 | 437.9 | 10855512 | 78343646 | Mpp6 | Membrane protein, palmitoylated 6 |
| Eae20-22 | 4 | 133–159 | 6.7 | 523.6 | 10857950 | 150814706 | Atg7 | Autophagy-related 7 (yeast) |
| Eae20-22 | 4 | 21.1 | 89.4 | 10865186 | 156705371 | RGD1310710_predicted | Similar to RIKEN cDNA 2700091N06 (predicted) | |
| Eae20-22 | 4 | 8.5 | 50.5 | 10865321 | 158901835 | RGD1560851_predicted | Similar to mKIAA1238 protein (predicted) | |
| Eae20-22 | 4 | 10.9 | 141.6 | 10858581 | 159745231 | Clec4b2 | c-Type lectin domain family 4, member B2 | |
| eEae22 | 4 | 162–172 | 6.9 | 167.4 | 10859090 | 166090800 | LOC689800 | Similar to osteoclast inhibitory lectin |
| eEae22 | 4 | 9.3 | 45.9 | 10859149 | 166857707 | Klre1 | Killer cell lectin-like receptor, family E, member | |
| eEae22 | 4 | 5.5 | 86.2 | 10859162 | 166857707 | Klre1 | Killer cell lectin-like receptor, family E, member | |
| eEae22 | 4 | 5.3 | 234.8 | 10859164 | 166857707 | Klrd1 | Killer cell lectin-like receptor, subfamily D, member 1 | |
| eEae22 | 4 | 5.6 | 10.6 | 10859160 | 166857707 | Klre1 | Killer cell lectin-like receptor, family E, member | |
| eEae22 | 4 | 4.9 | 804.2 | 10866041 | 166914788 | Klrk1 | Killer cell lectin-like receptor subfamily K, member 1 | |
| eEae22 | 4 | 13.2 | 161.6 | 10866056 | 166956618 | Klrc2 | Killer cell lectin-like receptor subfamily C | |
| eEae22 | 4 | 17.6 | 320.3 | 10866052 | 166956618 | Klrc3 | Killer cell lectin-like receptor subfamily C, member 3 | |
| eEae22 | 4 | 4.2 | 82.9 | 10866061 | 166981332 | Klrc1 | Killer cell lectin-like receptor subfamily C | |
| eEae22 | 4 | 7.4 | 97.0 | 10866076 | 167091333 | Klri2 | Killer cell lectin-like receptor family I member 2 | |
| eEae22 | 4 | 11.5 | 560.2 | 10866101 | 167325313 | RGD1563110_predicted | Similar to immunoreceptor Ly49si3 | |
| eEae22 | 4 | 4.1 | 223.9 | 10866116 | 167367359 | LOC684059 | Similar to immunoreceptor Ly49si1 | |
| eEae22 | 4 | 4.7 | 229.4 | 10866120 | 167449814 | Ly49si1 | Immunoreceptor Ly49si1 | |
| eEae22 | 4 | 10.4 | 402.8 | 10866123 | 167483018 | Klra22 | Killer cell lectin-like receptor subfamily A, member 22 | |
| eEae22 | 4 | 11.4 | 820.8 | 10866142 | 167500280 | LOC100364751 | Immunoreceptor Ly49si3-like | |
| eEae22 | 4 | 12.1 | 472.3 | 10866144 | 167504502 | LOC100364751 | Immunoreceptor Ly49si3-like | |
| eEae22 | 4 | 10.7 | 612.3 | 10866140 | 167553043 | LOC100364751 | Immunoreceptor Ly49si3-like | |
| eEae22 | 4 | 10.7 | 25.4 | 10866163 | 167975702 | Ly49s4 | Ly49 stimulatory receptor 4 | |
| eEae22 | 4 | 19.6 | 25.5 | 10866186 | 168230133 | Ly49i3 | Immunoreceptor Ly49i3 | |
| eEae22 | 4 | 4.3 | 172.4 | 10866167 | 168230133 | Ly49s4 | Ly49 stimulatory receptor 4 | |
| eEae22 | 4 | 6.5 | 94.7 | 10866215 | 168575551 | NP_001009494.1 | Ly49 stimulatory receptor 7 | |
| eEae22 | 4 | 14.8 | 32.2 | 10866236 | 168747110 | Klra5 | Killer cell lectin-like receptor, subfamily A | |
| eEae22 | 4 | 7.2 | 58.7 | 10866243 | 168794389 | Ly49i7 | Immunoreceptor Ly49i7 | |
| eEae22 | 4 | 20.6 | 59.8 | 10866359 | 170271493 | LOC689869 | Similar to Taste receptor type 2 member 140 | |
| Eae_rno4 | 4 | 175–187 | 9.1 | 55.5 | 10867020 | 186999579 | RGD1560851_predicted | Similar to mKIAA1238 protein (predicted) |
| Eae3 | 10 | 15–45 | 10.8 | 423.5 | 10742431 | 35933369 | Rufy1 | RUN and FYVE domain containing 1 |
| Eae18a | 10 | 55–67 | 4.7 | 119.1 | 10734740 | 55270065 | Pik3r6 | Phosphoinositide-3-kinase, regulatory subunit 6 |
| Eae18a | 10 | 4.3 | 75.7 | 10744254 | 56692319 | Tnk1 | Non-receptor tyrosine-protein kinase TNK1 | |
| Eae12 | 10 | 85–108 | 8.2 | 189.0 | 10738451 | 90602484 | Tmem106a | Transmembrane protein 106A |
| Eae12 | 10 | 4.9 | 5793.3 | 10774359 | 104545644 | Rpl38 | Ribosomal protein L38 | |
| Eae12 | 10 | 15.9 | 238.8 | 10748857 | 105084291 | RGD1561778 | Similar to dendritic cell-derived immunoglobulin(Ig)-like receptor 1 | |
| Eae17 | 13 | 38–55 | 6.2 | 138.9 | 10763751 | 43752437 | Fcamr | Fc receptor, IgA, IgM, high affinity |
| Eae17 | 13 | 4.3 | 270.9 | 10767565 | 44910207 | Mfsd4 | Major facilitator superfamily domain-containing protein 4 | |
| Eae10 | 14 | 0–20 | 22.7 | 236.9 | 10771171 | 5807837 | LOC683128 | Similar to guanylate binding protein family |
| Eae10 | 14 | 7.4 | 142.3 | 10771190 | 5965433 | Abcg3l3 | ATP-binding cassette, sub-family G, member 3 family member | |
| Eae23b | 17 | 57–66 | 12.7 | 69.2 | 10795634 | 63355581 | 4921524L21Rik | |
| Eae15 | 18 | 69–87 | 6.0 | 116.7 | 10805571 | 81524266 | Timm21 | Translocase of inner mitochondrial membrane 21 homolog |
The first column gives the name of the previously mapped EAE QTL (See Supplementary Material, Table S5 for related publications). The QTLs given in bold displayed linkage in 421 BC rats, encompassing 150 rats used for eQTL mapping. eQTLs were selected to have a logarithm of odds (LOD) score ≥ 3.9 and a genome-wide corrected P-value ≤0.05 (generated with 1000 permutations). Cis-eQTLs were considered those having no genetic marker between the peak of the linkage score and the chromosomal region coding the transcript. Genes in bold are differentially expressed between DA and PVG in day 7 post-immunization ex vivo LN cells and/or in MOG re-stimulated conditions (49).
Abbreviations: eQTL, expression quantitative trait locus; QTL, quantitative trait locus; Chr, chromosome; LOD, logarithm of the odds ratio.
aPosition of EAE QTL in mega base pairs.
bLOD score of cis-eQTL for probe sets generated with the Haley–Knott regression model, no covariates, in R/qtl.
cAverage probe set expression level.
dProbe ID annotation from Affymetrix Rat Gene 1.0 ST array.
eGenomic location of the transcript, start, in mega base pairs.
We then examined the eQTL data for candidate genes underlying EAE phenotypes. Of all eQTLs with a P-value ≤0.05, a total of 60 cis-eQTLs (Table 3) with LOD ≥ 3.9 resided in previously known EAE QTLs present in the same DA and PVG strain combination (Supplementary Material, Table S5), such as Ifit1 (Eae7), Atg7 (Eae20-22), Klrc3 (eEae22) and Mfsd4 (Eae17), among others. These 60 cis-eQTLs were mainly associated with functional pathways of natural killer (NK) cell signaling and molecular functions of cellular growth and proliferation (Supplementary Material, Tables S3 and S4). A cis-eQTL that maps to a disease QTL can be considered a likely causal gene underlying the disease QTL.
Gene networks of inter-dependent genes that correlate with clinical phenotypes
Complex phenotypes are often the result of a response of multiple functionally interacting genes. Combining genome-wide expression traits with clinical information enables the study of gene networks of inter-dependent genes that can be correlated with clinical phenotypes. With weighted correlation network analysis (WGCNA) (35), we identified eight gene networks that significantly correlated with EAE phenotypes (including susceptibility and severity phenotypes, weight loss and anti-MOG IgG titers). We performed IPA of transcripts for each separate gene network to identify their functional properties. Significant associations with canonical pathways were discerned for six of the eight identified gene networks (Supplementary Material, Table S6) and four of these are described below.
A gene network enriched for T cell functions shows strong correlation with EAE
The most striking gene network A (Fig. 2, Supplementary Material, Tables S6 and S7) associated with molecular functions including T cell-mediated immune mechanisms (Tables 4 and 5), which have also been implicated in MS (2). This network gave the strongest positive correlation with EAE susceptibility and severity (Pearson correlations: EAE ρ = 0.23, P = 0.004; MAX ρ = 0.23, P = 0.006; SUM ρ = 0.32, P = 0.00006; s35 ρ = 0.26, P = 0.001; ONS ρ = −0.21, P = 0.01; DUR ρ = 0.31, P = 0.0001; WL ρ = 0.32, P = 0.00007). Transcripts in gene network A (Supplementary Material, Table S7) included multiple genes associated with autoimmune diseases (Cd6, Ets1, Tcf7 and Themis) (2, 36–38). The Cd6 MS susceptibility allele is associated with alterations in T cell proliferation (39) and the transcription factor Ets1 participates in important aspects of early thymocyte development (40, 41). Several genes, including Lef1, Lck, Crtam and Itk, have previously been linked to functions of the adaptive immune system. In the network, the cis-regulated major facilitator superfamily (MFS) domain containing protein 4 (Mfsd4), overlapping an EAE-regulating QTL on RNO13 that was initially identified in a (LEW × PVG) F2 intercross (42) had a strong (−0.05) albeit peripheral membership. Lef1, co-regulated by two loci on RNO1 and RNO18, was the strongest member of this gene network (−0.21). Several members of the network are regulated from EAE QTLs, Art2 (Eae31), Crtam (Eae17 and Eae23a) and Resp18 (Eae23a), showing a genetic regulation of the network by loci that predispose for EAE.
Figure 2.

Gene network enriched for T cell functions shows strong correlation with EAE. Expression traits with neighboring locations are drawn next to each other. eQTLs are indicated by their rat chromosome location on a second line and cis-eQTLs are indicated in white. eQTLs within EAE QTLs are indicated by a grey box with the QTL name listed in parentheses. Predicted hub genes are presented in yellow and the black arrow heads indicate a directed interaction. Plus and minus indicate association to EAE phenotype. Genes with a higher disease association are placed to the right, whereas causative genes are placed toward the left.
Table 4.
Top canonical pathways associated with Network A
| Ingenuity top canonical pathway | Ratioa | Genesb | P-valuec | Corrected P-valued |
|---|---|---|---|---|
| T Cell receptor signaling | 11/109 | CD247,CD3G,CD28,LCK,CAMK4,PRKCQ,CD3E,CD8A,CD3D,CD8B,ITK | 2.1E−15 | 3.1E−13 |
| iCOS–iCOSL signaling in T helper cells | 10/122 | CD247,CD3G,CD28,LCK,CD40LG,CAMK4,PRKCQ,CD3E,CD3D,ITK | 1.3E−13 | 9.6E−12 |
| CD28 signaling in T helper cells | 9/132 | CD247,CD3G,CD28,LCK,CAMK4,PRKCQ,CD3E,CD3D,ITK | 1.6E−11 | 7.9E−10 |
| Calcium-induced T lymphocyte apoptosis | 7/70 | CD247,CD3G,LCK,CAMK4,PRKCQ,CD3E,CD3D | 1.3E−10 | 4.8E−09 |
| Role of NFAT in regulation of the immune response | 9/200 | CD247,CD3G,CD28,LCK,CAMK4,PRKCQ,CD3E,CD3D,ITK | 4.8E−10 | 1.4E−08 |
Transcripts in Network A were uploaded into the ingenuity pathways application (Ingenuity Systems, www.ingenuity.com). The software was used to identify the most significant pathways.
aRatio refers to the number of molecules in a given pathway that meet cutoff criteria, divided by the total number of genes that map to the canonical pathway.
bGenes in a given pathway that meet cutoff criteria.
cSignificance was determined from a single test P-value calculated using the right-tailed Fisher's exact test.
dAdjusted significance was determined from multiple test-corrected P-values using the Benjamini–Hochberg correction (top five categories reaching a corrected statistical significance of ≤0.05 are shown).
Table 5.
Molecular functions associated with Network A
| Cellular and molecular functions | Moleculesa | Representative subgroup | Moleculesb | P-valuec | P-value subgroupd |
|---|---|---|---|---|---|
| Cellular function and maintenance | 25 | Lymphocyte homeostasis | 23 | 1.3E−23–1.2E−02 | 1.3E−23 |
| Cellular development | 27 | T cell development | 22 | 3.0E−23–1.2E−02 | 5.9E−23 |
| Cell-to-cell signaling and interaction | 23 | Activation of T lymphocytes | 15 | 3.6E−16–1.3E−02 | 3.6E−16 |
| Cellular growth and proliferation | 26 | Proliferation of lymphocytes | 18 | 3.8E−15–1.2E−02 | 9.4E−15 |
| Cellular movement | 18 | Lymphocyte migration | 13 | 5.0E−13–1.2E−02 | 5.0E−13 |
Transcripts in Network A were uploaded into the ingenuity pathways application (Ingenuity Systems, www.ingenuity.com). The software was used to identify the most significant molecular functions.
aNumber of functional analysis molecules related to the pathway.
bNumber of functional analysis molecules related to the representative pathway subgroup.
cRange of significance for pathway subgroups. Significance was determined from a single test P-value calculated using the right-tailed Fisher's exact test.
dSignificance for representative pathway subgroup.
Gene network associated with G protein coupled receptor signaling
Gene network B (Fig. 3, Supplementary Material, Tables S6 and S8) correlated negatively with severity phenotypes (MAX ρ = −0.19, P = 0.02; SUM ρ = −0.24, P = 0.003; s35 ρ = −0.19, P = 0.02; DUR ρ = −0.16, P = 0.05; WL ρ = −0.27, P = 0.0005). Canonical pathways associated to the gene network included LPS/IL-1-mediated inhibition of RXR function and G protein coupled receptor signaling (Supplementary Material, Table S6). Several transcripts in the network are family members of genes associated with MS (Supplementary Material, Table S8). These include C-type lectins, G protein coupled receptors, mitogen-activated protein kinases, transmembrane proteins and solute carriers (SLCs) which are proteins involved in both inflammation and immunity, as well as in signal transduction that leads to cellular responses. Jundp2 and Nr1d1 are in regions associated with Crohn's disease (34) and are both involved in transcriptional regulation (43, 44). The gene network is partially genetically regulated by Eae17, Eae23a, Eae29 and Eae30.
Figure 3.

Gene network associated with GPCR signaling correlates negatively with EAE. Expression traits with neighboring locations are drawn next to each other. eQTLs are indicated by their rat chromosome location on a second line and cis-eQTLs are indicated in white. eQTLs within EAE QTLs are indicated by a grey box with the QTL name listed in parentheses. Predicted hub genes are presented in orange and the black arrow heads indicate a directed interaction. Plus and minus indicate association to EAE phenotype. Genes with a higher disease association are placed to the right, whereas causative genes are placed toward the left.
Genetic regulation of gene network associated with IFN signaling pathways
Gene network C (Fig. 4, Supplementary Material, Tables S6 and S9) correlated with duration of EAE (ρ = 0.18, P = 0.02) and indicated a genetic regulation by loci that predispose for EAE (Eae3, Eae7, Eae18a, Eae18b and Eae20-22). IPA revealed a high significance for IFN signaling pathways (Supplementary Material, Table S6) that are important in neuroinflammation. Network C also included genes and family members of genes associated with MS or other autoimmune diseases; zinc fingers, STAT transcription factors (Stat2 and Stat4) (45), genes involved in the innate immune response (Irgm) (46) and interferon regulatory factors (Irf1, Irf7 and Irf9) (45, 47). IFN-induced downstream signaling molecules, several of which associated with MS (48), are evident in the network such as proteins induced by interferons (Oas), interferon-induced guanylate-binding proteins (Gbp) and a number of interferon-induced proteins.
Figure 4.

Gene network associated with IFN pathway signaling. Expression traits with neighboring locations are drawn next to each other. eQTLs are indicated by their rat chromosome location on a second line and cis-eQTLs are indicated in white. eQTLs within EAE QTLs are indicated by a grey box with the QTL name listed in parentheses. Predicted hub genes are presented in orange and the black arrow heads indicate a directed interaction. Plus and minus indicate association to EAE phenotype. Genes with a higher disease association are placed to the right, whereas causative genes are placed toward the left.
Furthermore, network D (Supplementary Material, Table S6) correlated with serum anti-MOG total IgG levels day 35 p.i. (ρ = 0.24, P = 0.003) and was functionally enriched for the regulation of p70S6K, a serine/threonine kinase in the PI3 kinase pathway.
In conclusion, we identified several gene networks involved in specific immune-related pathways that are presumably of importance or crucial for both EAE and MS pathogenesis and which indicate partial genetic regulation by loci that predispose for EAE. Additionally, the co-expression analyses provided novel insights in the cause–effect interactions of several genes that have not previously been linked to immune related pathways. Furthermore, the approach of integrating clinical data in the analyses distinguished molecular responses important at different stages of disease. For instance, we defined networks of interacting genes that correlated with duration and IgG levels, respectively. Any genetic difference in individuals that could modulate the defined molecular pathways could potentially influence susceptibility to EAE and MS.
DISCUSSION
The eQTL approach can facilitate identification of candidate genes (6,14,15) and in the current study our whole-genome approach identified genetic differences between two inbred rat strains that contribute to the expression of individual genes. We detected a number of cis-eQTLs that overlap established EAE QTLs that warrant further biological characterization.
The co-localization of a cis-eQTL and an EAE QTL makes it an attractive novel positional candidate for the causal relationship between the disease phenotype and the regulation of the transcript. We identified several cis-regulated positional candidate genes in EAE QTLs including Ifit1 (Eae7), Atg7 (Eae20-22), Klrc3 (eEae22) and Mfsd4 (Eae17). We have previously described these genes as being differentially expressed between DA and PVG in ex vivo LN cells and/or in MOG re-stimulated lymphocytes at day 7 p.i. of EAE (49). Ifit1 is induced in response to stimuli such as LPS, IL-1 and TNF (50,51) and has been described among genes that could best predict the response to IFN-β treatment in MS patients (52). Atg7 is involved in macroautophagy, an intracellular pathway that regulates quantity and quality of organelles and proteins. Autophagy has recently been linked to both innate and adaptive immunity (53). Klrc3, encodes an activating NK cell receptor, and NK cells are suggested to confer a disease-protective role in MS and EAE (54–56). Mfsd4 is a transmembrane transporter of the MFS. MFS proteins are the largest group of secondary carriers in the cell and transport small solutes by using chemiosmotic ion gradients (57,58). The availability of whole-genome expression profiles provides the opportunity to explore the role of genes with as yet unknown molecular function. This can be achieved by investigating interacting molecules or pathways the gene of interest correlates with. Our analysis identified several candidate genes that can serve to generate novel hypotheses and study of the function of these proteins in EAE and MS pathogenesis.
We additionally identified highly significant cis-regulated eQTLs that do not overlap with known EAE QTLs but could still denote functions important for autoimmunity. Particularly interesting are family members of genes that associate with MS including Rgs4, Cyp2r1, Tmem184a, Zfp61 and Slc27a3. Rgs4 is a member of the protein family of negative regulators of G-protein signaling (RGS) which deactivates G protein coupled receptor signaling (59,60). This signaling was associated with gene network B that correlated negatively to EAE severity phenotypes. The RGS protein family is highly regulated at the transcriptional level and up-regulation of certain RGS proteins decreases immune cell migration and reduced chemokine-dependent calcium flux. Interestingly, these are emerging as potentially important drug targets. Our functional analysis associated Rgs4 with cell proliferation, cell migration, integrin and endocytosis signaling. Another family member of RGS, Rgs1, is associated with MS and is suggested to have a role in immune cell regulation. Cyp2r1 associated with B cell functions and signaling and Tmem184a with migration of cells (Supplementary Material, Table S3 and S4). Zfp61 is associated with the organization of the ER and autophagy of cells. The SLC superfamily of transporters is responsible for the uptake of amino acids, peptides, ions, hormones and drugs (61) and SLC mRNA levels are dysregulated in inflammatory bowel disease patients (62). Further studies on the functions and pathways affected by MS family member genes identified in this study could add to the understanding of the genetic contribution of susceptibility and/or pathogenesis of autoimmune diseases.
Several cis-eQTLs are genes with a recognized role in the immune system. Ccr6 has previously been demonstrated to play an important role in the mechanism of autoreactive lymphocyte priming and migration to the efferent lymphatics (63), implicated in the migration of lymphocytes to the CNS (64) and has been associated with Crohn's disease and rheumatoid arthritis (47,65). Tgfb2 is a potent immunosuppressive cytokine that ameliorates EAE and has been associated with remissions in MS. However, cases of nephrotoxicity in clinical trials (66) ruled it out as a treatment alternative for MS patients. Ifitm6 is part of a family of genes that are induced by IFNs (67) and encode cell surface proteins that modulate cell–cell adhesion and cell differentiation.
Genes can exert a control over the expression of another gene or a set of genes, which are referred to as trans-eQTLs. In our study, the sensitivity to detect trans-eQTLs has greatly been increased by the use of a BC population originating from two inbred strains and Affymetrix Gene arrays that provide comprehensive genome coverage with multiple probes per each transcript. More than 70% of eQTLs displayed regulation in trans at a genome-wide corrected P-value of ≤0.05, which conforms to previous studies in inbred rodent strains (14, 68). The trans-band on RNO17 overlaps Eae23a, which we previously demonstrated to control EAE severity in a congenic strain (26). Although this trans-band was not significantly enriched for functional pathways, we observed regulation of many small RNA genes such as nucleolar and spliceosomal RNAs, previously implicated in epigenetic regulation (31) and alternative splicing (32), respectively. Trans-regulation can denote a genomic location of a master regulator of transcription (16). A transcription factor, Zeb1 (69), known to regulate the IL-2 pathway (70, 71) that is crucial in MS and EAE, is encoded in Eae23a. In addition, we have previously demonstrated that the balance between splice variants of Zeb1 driven by Eae23a could influence the regulation of EAE (26).
With the recorded clinical and molecular parameters during the full EAE experiment (susceptibility, severity and molecular phenotypes), we defined clusters of gene networks that had a direct relation to clinical characteristics of disease. Thus, although our study in chronic stage of EAE does not necessarily address early molecular events that control susceptibility, a possibility to correlate gene expression with clinical phenotypes provides a major benefit in defining genes and pathways that are related to the disease (and not just a consequence of genetically driven expression differences between the strains). Moreover, defining pathways that regulate chronic stage of disease might have better translational prospects considering that all interventions in MS occur long after the onset of disease. The identified genetically driven pathways that regulate susceptibility to autoimmune disease primarily involved T cell activation pathways, G protein coupled receptor and IFN signaling. The most positively correlated network to EAE susceptibility and severity, gene network A (Fig. 2), associated with molecular functions including T cell-mediated immune mechanisms. EAE and MS are described as being T cell-mediated since adoptive transfer of T cells can induce disease, T cell infiltrates are evident in EAE and MS lesions (72–75) and that the major genetic determinant of both MS and EAE is the HLA/MHC. Thus our unbiased way of defining functions central in EAE conform to previous knowledge about central mechanisms in autoimmune inflammation, indicating that these mechanisms are partially genetically regulated, as implicated in the MS GWAS.
Themis, Lef1, Lck, Satb1, Crtam and Itk were identified in network A, which strongly correlated with EAE susceptibility and severity and associated with molecular functions including T cell-mediated immune mechanisms. Cis-regulated Themis act through TCR signaling and has recently been reported to control Treg functions and susceptibility to intestinal inflammation (76). In network A, Themis was determined to directionally interact with the lymphoid enhancer-binding factor 1 (Lef1) that binds to a functionally important site in the TCR-α enhancer. In turn, Lef1 was in our co-expression analysis predicted to interact with Lck, known to play a key role in the TCR signal transduction pathway. Lef1 also interacted with Satb1, a genome organizer that regulates chromatin structure and gene expression, known to be crucial for the phenotype and function of Tregs (77).
The T-cell-specific HMG box transcription factor family member Tcf7, also part of network A, is a transcriptional activator for genes involved in immune regulation (78). The encoded protein can bind an enhancer element and activate the CD3E gene that is part of the T cell receptor–CD3 complex. We also found a directed interaction between cytotoxic and a regulatory T cell molecule (Crtam), found to influence the adaptive immune response (79), and the IL-2-inducible T cell kinase (Itk), which is thought to play a role in T cell proliferation and differentiation (80). Lef1 and the hub gene phosphodiesterase 3B (Pde3b) interacted with Cd40l expressed on activated T cells. Cd40l is a costimulatory molecule and induces activation in APC by binding to Cd40.
Utilizing information about clinical EAE development (disease status, severity and onset) enabled predictions regarding the direction of interactions demonstrating a causal relationship associated with the development of a clinical phenotype. Additionally, our analyses can serve to reveal novel players that influence specific molecular pathways. For instance, in the gene network associated with T cell functions, the co-expression analysis predicted that Mfsd4 would interact, in a directed causal–effect relationship Pde3b. Pde3b is an enzyme that hydrolyzes cAMP for cell metabolism and has been shown to be regulated downstream of Foxp3, by direct binding, to support Treg homeostasis and lineage stability (81,82).
We identified a gene network highly associated with IFN signaling pathways which included STAT transcription factors, interferon regulatory factors and IFN-induced downstream signaling molecules. A first-line therapy for MS is IFN-β, a type I IFN, although the exact molecular mechanism of action of the drug is still poorly understood. Mx1 and Mx2, part of the network, can be used as biomarkers for monitoring response to interferon therapy in patients (83). Mx2 expression is regulated in cis on RNO11, and in IPA we found Mx2 to associate with IFN signaling and activation of IRF by cytosolic pattern recognition receptors, attraction of NK cells, homing of T lymphocytes and cell death of phagocytes (Supplementary Material, Tables S3 and S4). In gene network C, we also recorded the nuclear body proteins (Pml and Sp110) that regulate genes involved in the immune response (84). Pml acts as a transcriptional co-activator with p53 (85). p53 has previously been reported to interact with Wwox (86), a cis-eQTL on RNO19. WW domain-containing proteins are involved in protein degradation, transcription and RNA splicing. The network associated with IFN signaling included several T cell chemoattractants (Xcl1, Cxcl9 and Cxcl10). Xcl1 is a cytokine that attracts T cells and is expressed in activated thymic and peripheral blood CD8+ T cells (87, 88). Cxcl9 and Cxcl10 are induced by IFN-γ and execute their chemotactic functions by interacting with the chemokine receptor Cxcr3.
In conclusion, our well powered and unique study of the non-MHC influences on gene expression generates hypothesis of molecular pathways that are genetically regulated and predispose for EAE. We detected cis-regulated transcripts, both in EAE QTLs and outside, which may play important roles in regulating key mechanisms in both EAE and human disease owing to a large overlap of genes and functions. These can serve to generate novel hypotheses useful in further dissecting pathogenic molecular mechanisms that are dysregulated during chronic autoimmune inflammation. In addition, the gene network analyses denoted genes linked to functional pathways and described their importance in regulating clinical traits of disease. We demonstrate how MS risk genes translate well to EAE and efforts should now be put into combining clinical and experimental research to evaluate candidate genes and to functionally study their mechanisms of action. Ultimately, these integrated findings can provide insight to possible diagnostic and prognostic biomarkers or potential therapeutic interventions for autoimmunity.
MATERIALS AND METHODS
Experimental subjects
DA rats were originally obtained from the Zentralinstitut für Versuchstierzucht (Hannover, Germany) and MHC-identical PVG.1av1 from Harlan UK Limited (Blackthorn, UK). Colonies have thereafter been established at Karolinska Institutet (DA/Kini and PVG.1av1/Kini). A (DA × PVG.1av1) × DA BC population was established. In short, to create the F1 generation, four breeding pairs with DA female founders were established. The N2 generation was bred from eight breeding pairs, with DA females or males crossed to F1 males and females, respectively. Four N2 litters, 421 BC rats (213 females and 208 males), were subjected to MOG-EAE in four separate experiments, referred to as experimental sets. Out of 421 immunized BC rats, splenic RNA was extracted from 347 rats (182 females and 165 males) that survived until day 35 p.i. All 421 BC rats were used to map EAE pQTLs, which are indicated in Supplementary Material, Table S5 and the details of mapping will be reported in a separate study (Stridh et al., unpublished data). To minimize variability introduced by experimental sets and increase mapping power, we decided to perform genome-wide expression analysis in one sex; male rats were selected due to less variability between experimental sets. Out of 165 males, 150 selected rats represent similar susceptibility and severity, and all breeding pairs and experimental sets as the full set of 165 rats. All animals were bred and housed at the Karolinska University Hospital (Stockholm, Sweden) in 12 h light/dark- and temperature-regulated rooms in polystyrene cages containing aspen wood shavings where they had free access to standard rodent chow and water. Rats were tested according to a health-monitoring program at the National Veterinary Institute (Statens Veterinärmedicinska Anstalt, SVA) in Uppsala, Sweden.
Induction and clinical evaluation of EAE
Recombinant MOG, amino acids 1–125 from the N-terminus, was expressed in Escherichia coli and purified to homogeneity by chelate chromatography as previously described (89). 421 BC rats, between 10–14 weeks of age, were anesthetized with isofluorane (Forene, Abbott Laboratories, Abbot Park, IL, USA) and immunized with a single subcutaneous injection at the dorsal tail base with 200 µl of inoculum containing rMOG (12.5–15 µg/rat in females and 25–30 µg/rat in males titrated in order to achieve similar disease severity/induction) in saline emulsified in a 1:1 ratio with incomplete Freund's adjuvant (Sigma Aldrich, St Louis, MO, USA). Rats were monitored daily for weight and clinical signs from day 8 until 35 p.i. The clinical score was graded as follows: 0, no clinical signs of EAE; 1, tail weakness or tail paralysis; 2, hind leg paraparesis or hemiparesis; 3, hind leg paralysis or hemiparalysis; 4, tetraplegia or moribund; 5, death. Clinical parameters were assessed and used in the analysis: EAE, incidence of EAE; ONS, onset of EAE (day p.i. of first clinical sign); DUR, duration of EAE (number of days subjects showed clinical signs of EAE); MAX, maximum EAE score during the experiment; SUM, sum of all scores during the experiment; s35, EAE score on day 35 post immunization (p.i.) (last day of experiment when spleen tissue was collected for expression analysis); WL, weight loss (calculating the percentage of weight loss between lowest weight throughout the experiment and day 8 p.i.). At day 35 p.i., 347 rats were sacrificed and spleens were collected, snap-frozen and stored in −70°C until use. Spleens from the remaining 74 animals were not collected due to decease prior to the end of experiment. In the BC experiment, 60.4% of all rats were affected with EAE (average maximum clinical score = 2.46). Of individuals still included in the experiment at day 35 p.i., 61.8% were still affected at the end of experiment (average clinical score at day 35 p.i. score = 2.05). Anti-MOG antibodies were measured at the onset (day 12 p.i.) and chronic phase of EAE (day 35 p.i.) as previously described (90).
DNA isolation and genotyping
Genomic DNA was prepared from tail tips of the BC population as described previously. Information about polymorphic microsatellite markers for the BC (118 markers evenly spaced throughout the genome with an average inter-marker distance of 20 cM) was retrieved from Ensembl Genome Database (http://www.ensembl.org v.50-62) (91). DNA amplification was performed with PCR using forward primers end-labeled with a fluorescent dye (VIC, NED, FAM or PET) with products run on ABI 3730 capillary sequencer and analyzed with GeneMapper v3.7 (Applied Biosystems, Foster City, CA, USA). Primers were obtained from Eurofins MWG Operon (Ebersberg, Germany), Applied Biosystems or Proligo (Paris, France). All genotypes were evaluated manually and quality assessed by two independent observers.
Expression analysis
One hundred milligrams of splenic tissue from each of 150 BC rats was disrupted using Lysing Matrix D tubes (MP Biomedicals, Irvine, CA, USA) in a FastPrep homogenizer (MP Biomedicals). mRNA was extracted using an RNeasy mini kit according to the manufacturers protocol (Qiagen, Hilden, Germany), including on-column DNA digestion. RNA concentration and purity was determined through measurement of A260/A280 ratios with a NanoDrop ND-1000 Spectrophotometer (NanoDrop Technologies, Wilmington, DE, USA). For 150 BC male rats selected to represent all breeding pairs and sets, whole-genome expression profiles were determined with Affymetrix Rat Gene 1.0 ST Array (Affymetrix, Santa Clara, CA, USA). Confirmation of RNA quality was assessed using the Agilent 2100 Bioanalyzer (Agilent Technologies, Santa Clara, CA, USA). Target labeling, array hybridization and washing and staining were performed as described in the GeneChip Whole Transcript (WT) Sense Target Labeling manual (http://www.affymetrix.com). Arrays were scanned in the GeneChip Scanner 3000 7G (Affymetrix). Affymetrix cell intensity (CEL) files from scanning were analyzed with Affymetrix Expression Console (EC, version 1.1). The following settings were used: Summarization: probe logarithmic intensity error (PLIER) described in the Guide to probe logarithmic intensity error (PLIER) estimation (http://www.affymetrix.com); Background correction: PM-GCBG and Normalization: Global Median. The microarray data are available in MIAME-compliant (minimal information about a microarray experiments) format at the ArrayExpress Database (http://www.ebi.ac.uk/arrayexpress) (92) under accession code E-MTAB-784.
Linkage and statistical analysis
For the BC, genome-wide linkage analysis was performed for 27342 expression traits with a set of 118 genetic markers using the Haley–Knott regression model in R/qtl version 1.14 (93), to generate maximum base 10 logarithm of the likelihood ratio of odds (LOD) scores. Logarithmic values of all molecular quantitative traits (transcript expression) were used as an input for R/qtl and analyses were performed independently for several clinical phenotypes to act as covariates as well as single QTL scans for all covariates and pairs of covariates. Genome-wide significance (P-value ≤0.05) was generated with 1000 permutation tests (94). Physical locations of probe sets were obtained from Ensembl version 55 or from Affymetrix (http://www.affymetrix.com) and the transformation of cM to Mb was determined with R/qtl. The physical positions (Mb) were retrieved from Ensembl, either directly or by sequence similarity searches with the oligo sequences. For arbitrary cM, the density of the markers was considered sufficient (95) to allow a linear interpolation between the physical positions of flanking markers. Computations and their interpretation were orchestrated with the interactive QTL system (TIQS. http://tiqs.it), where data are available. eQTLs were defined as cis when there was no genetic marker between the peak of the linkage score and the chromosomal region coding the transcript. Other eQTLs were considered being regulated in trans. Genomic locations were obtained from genomic assembly Rnor3.4. For pathway analysis in IPA, significance was determined with the right-tailed Fisher's exact test and adjusted significance using the Benjamini–Hochberg correction. Venn diagrams are based on the gplots R package version 2.11.0.1 (http://CRAN.R-project.org/package=gplots).
Due to the polygenic nature of EAE, we used a multiple-QTL model, i.e. forward selection followed by backward elimination in R/qtl version 1.14 (93), to identify EAE QTLs in 421 BC rats, encompassing 150 rats used for eQTL analysis (Supplementary Material, Table S5). Similar results were obtained using Hailey–Knott regression (data not shown). EAE QTL analysis was also performed in 150 rats used for eQTL analysis using the Haley–Knott regression method in R/qtl version 2.12 (93). Nominal P-values were used to report EAE QTLs in 150 rats due to prior evidence from 421 BC rats and additional independent studies (Supplementary Material, Table S5).
Functional association analysis and network analysis
Molecular functions and canonical pathways were evaluated with the ingenuity pathways application (Ingenuity Systems, www.ingenuity.com). The functional and canonical pathways (disease-specific pathways were not included) analysis identified the molecular functions and pathways, respectively, from the Ingenuity Knowledge Base that was most significant to the uploaded data set. For analysis of transcripts correlated to cis-eQTLs (Pearson's correlation coefficient r > 0.40 or r < −0.40), the experimental set 1 was excluded due to significant deviation from other sets (the induction dose of 30 µg/rat was used for set 1 males, whereas other sets were induced with 25 µg/rat).
Gene networks were provided by TIQS, created on the basis of WGCNA (35). The Pearson correlation coefficient was used to determine the association of a gene network with clinical EAE phenotypes. Gene network analysis in combination with the clinical parameters measured for each individual in the EAE experiment was used to predict a causal relationship between genes. Directions indicate the gene that is observable to differ in its expression level from healthy individuals after longer disease duration. Directed associations were determined with the use of clinical parameters for all predicted gene interactions and hub genes in the eQTL data as inferred from an association of the gene expression levels with the onset of the disease phenotypes (Gupta et al., unpublished data). The arrows point to the gene that changes its expression at a later stage of the disease. To determine the direction, the expression levels were compared with the onset and the severity. From the onset, the duration of the disease is derived. Every gene is assigned an average score across all individuals to reflect if the expression levels are changing with the duration of the disease, with the strength of the phenotype contributing to the scoring. The directions follow the gradient of that score.
Ethics statement
All experiments were approved and performed in accordance with the guidelines from the Swedish National Board for Laboratory Animals and the European Community Council Directive (86/609/EEC) under the ethical permits N284/07 (N332/06) that were approved by the North Stockholm Animal Ethics Committee (Stockholms Norra djurförsöksetiska nämnd).
SUPPLEMENTARY MATERIAL
Supplementary Material is available at HMG online.
Conflict of Interest statement. None declared.
FUNDING
This work was supported by grants from the Bibbi and Niels Jensens Foundation, the Montel Williams Foundation, the Swedish Brain Foundation, the Torsten and Ragnar Söderbergs Foundation, the Swedish Research Council, EURATools (LSHG-CT-2005-019015), EURATRANS (FP7/2007-2013, HEALTH-F4-2010-241504), Neuropromise (LSHM-CT-2005-018637), KnowARC (FP6/032691) and the Swedish Association for Persons with Neurological Disabilities. Funding to pay the Open Access publication charges for this article was provided by The Swedish Research Council.
Supplementary Material
ACKNOWLEDGEMENTS
The authors would like to thank the bioinformatics and expression analysis (BEA) core facility at Karolinska Institutet (Stockholm, Sweden) for conducting the microarray procedure, Ann-Kristin Grimm for computational analysis and Olli Tourunen of the Nordic Data Grid Facility's Bio Initiative for providing computational resources.
REFERENCES
- 1.Pritchard J.K., Cox N.J. The allelic architecture of human disease genes: common disease-common variant...or not? Hum. Mol. Genet. 2002;11:2417–2423. doi: 10.1093/hmg/11.20.2417. [DOI] [PubMed] [Google Scholar]
- 2.Sawcer S., Hellenthal G., Pirinen M., Spencer C.C., Patsopoulos N.A., Moutsianas L., Dilthey A., Su Z., et al. International Multiple Sclerosis Genetics, C., Wellcome Trust Case Control, C. Genetic risk and a primary role for cell-mediated immune mechanisms in multiple sclerosis. Nature. 2011;476:214–219. doi: 10.1038/nature10251. [DOI] [PMC free article] [PubMed] [Google Scholar]
- 3.Baranzini S.E., Galwey N.W., Wang J., Khankhanian P., Lindberg R., Pelletier D., Wu W., Uitdehaag B.M., Kappos L., Gene M.S.A.C., et al. Pathway and network-based analysis of genome-wide association studies in multiple sclerosis. Hum. Mol. Genet. 2009;18:2078–2090. doi: 10.1093/hmg/ddp120. [DOI] [PMC free article] [PubMed] [Google Scholar]
- 4.Storch M.K., Stefferl A., Brehm U., Weissert R., Wallstrom E., Kerschensteiner M., Olsson T., Linington C., Lassmann H. Autoimmunity to myelin oligodendrocyte glycoprotein in rats mimics the spectrum of multiple sclerosis pathology. Brain Pathol. 1998;8:681–694. doi: 10.1111/j.1750-3639.1998.tb00194.x. [DOI] [PMC free article] [PubMed] [Google Scholar]
- 5.Harnesk K., Swanberg M., Ockinger J., Diez M., Lidman O., Wallstrom E., Lobell A., Olsson T., Piehl F. Vra4 congenic rats with allelic differences in the class II transactivator gene display altered susceptibility to experimental autoimmune encephalomyelitis. J. Immunol. 2008;180:3289–3296. doi: 10.4049/jimmunol.180.5.3289. [DOI] [PubMed] [Google Scholar]
- 6.Aitman T.J., Critser J.K., Cuppen E., Dominiczak A., Fernandez-Suarez X.M., Flint J., Gauguier D., Geurts A.M., Gould M., Harris P.C., et al. Progress and prospects in rat genetics: a community view. Nat. Genet. 2008;40:516–522. doi: 10.1038/ng.147. [DOI] [PubMed] [Google Scholar]
- 7.Flint J., Valdar W., Shifman S., Mott R. Strategies for mapping and cloning quantitative trait genes in rodents. Nat. Rev. Genet. 2005;6:271–286. doi: 10.1038/nrg1576. [DOI] [PubMed] [Google Scholar]
- 8.Cheung V.G., Conlin L.K., Weber T.M., Arcaro M., Jen K.Y., Morley M., Spielman R.S. Natural variation in human gene expression assessed in lymphoblastoid cells. Nat. Genet. 2003;33:422–425. doi: 10.1038/ng1094. [DOI] [PubMed] [Google Scholar]
- 9.Jansen R.C., Nap J.P. Genetical genomics: the added value from segregation. Trends Genet. 2001;17:388–391. doi: 10.1016/s0168-9525(01)02310-1. [DOI] [PubMed] [Google Scholar]
- 10.Brem R.B., Yvert G., Clinton R., Kruglyak L. Genetic dissection of transcriptional regulation in budding yeast. Science. 2002;296:752–755. doi: 10.1126/science.1069516. [DOI] [PubMed] [Google Scholar]
- 11.Schadt E.E., Monks S.A., Drake T.A., Lusis A.J., Che N., Colinayo V., Ruff T.G., Milligan S.B., Lamb J.R., Cavet G., et al. Genetics of gene expression surveyed in maize, mouse and man. Nature. 2003;422:297–302. doi: 10.1038/nature01434. [DOI] [PubMed] [Google Scholar]
- 12.Alberts R., Terpstra P., Li Y., Breitling R., Nap J.P., Jansen R.C. Sequence polymorphisms cause many false cis eQTLs. PLoS ONE. 2007;2:e622. doi: 10.1371/journal.pone.0000622. [DOI] [PMC free article] [PubMed] [Google Scholar]
- 13.Doss S., Schadt E.E., Drake T.A., Lusis A.J. Cis-acting expression quantitative trait loci in mice. Genome Res. 2005;15:681–691. doi: 10.1101/gr.3216905. [DOI] [PMC free article] [PubMed] [Google Scholar]
- 14.Hubner N., Wallace C.A., Zimdahl H., Petretto E., Schulz H., Maciver F., Mueller M., Hummel O., Monti J., Zidek V., et al. Integrated transcriptional profiling and linkage analysis for identification of genes underlying disease. Nat. Genet. 2005;37:243–253. doi: 10.1038/ng1522. [DOI] [PubMed] [Google Scholar]
- 15.Behmoaras J., Bhangal G., Smith J., McDonald K., Mutch B., Lai P.C., Domin J., Game L., Salama A., Foxwell B.M., et al. Jund is a determinant of macrophage activation and is associated with glomerulonephritis susceptibility. Nat. Genet. 2008;40:553–559. doi: 10.1038/ng.137. [DOI] [PMC free article] [PubMed] [Google Scholar]
- 16.Heinig M., Petretto E., Wallace C., Bottolo L., Rotival M., Lu H., Li Y., Sarwar R., Langley S.R., Bauerfeind A., et al. A trans-acting locus regulates an anti-viral expression network and type 1 diabetes risk. Nature. 2010;467:460–464. doi: 10.1038/nature09386. [DOI] [PMC free article] [PubMed] [Google Scholar]
- 17.Dahlman I., Lorentzen J.C., de Graaf K.L., Stefferl A., Linington C., Luthman H., Olsson T. Quantitative trait loci disposing for both experimental arthritis and encephalomyelitis in the DA rat; impact on severity of myelin oligodendrocyte glycoprotein-induced experimental autoimmune encephalomyelitis and antibody isotype pattern. Eur. J. Immunol. 1998;28:2188–2196. doi: 10.1002/(SICI)1521-4141(199807)28:07<2188::AID-IMMU2188>3.0.CO;2-B. [DOI] [PubMed] [Google Scholar]
- 18.Jagodic M., Becanovic K., Sheng J.R., Wu X., Backdahl L., Lorentzen J.C., Wallstrom E., Olsson T. An advanced intercross line resolves Eae18 into two narrow quantitative trait loci syntenic to multiple sclerosis candidate loci. J. Immunol. 2004;173:1366–1373. doi: 10.4049/jimmunol.173.2.1366. [DOI] [PubMed] [Google Scholar]
- 19.Jagodic M., Marta M., Becanovic K., Sheng J.R., Nohra R., Olsson T., Lorentzen J.C. Resolution of a 16.8-Mb autoimmunity-regulating rat chromosome 4 region into multiple encephalomyelitis quantitative trait loci and evidence for epistasis. J. Immunol. 2005;174:918–924. doi: 10.4049/jimmunol.174.2.918. [DOI] [PubMed] [Google Scholar]
- 20.Sheng J.R., Jagodic M., Dahlman I., Becanovic K., Nohra R., Marta M., Iacobaeus E., Olsson T., Wallstrom E. Eae19, a new locus on rat chromosome 15 regulating experimental autoimmune encephalomyelitis. Genetics. 2005;170:283–289. doi: 10.1534/genetics.104.035261. [DOI] [PMC free article] [PubMed] [Google Scholar]
- 21.Becanovic K., Jagodic M., Sheng J.R., Dahlman I., Aboul-Enein F., Wallstrom E., Olofsson P., Holmdahl R., Lassmann H., Olsson T. Advanced intercross line mapping of Eae5 reveals Ncf-1 and CLDN4 as candidate genes for experimental autoimmune encephalomyelitis. J. Immunol. 2006;176:6055–6064. doi: 10.4049/jimmunol.176.10.6055. [DOI] [PubMed] [Google Scholar]
- 22.Ockinger J., Serrano-Fernandez P., Moller S., Ibrahim S.M., Olsson T., Jagodic M. Definition of a 1.06-Mb region linked to neuroinflammation in humans, rats and mice. Genetics. 2006;173:1539–1545. doi: 10.1534/genetics.106.057406. [DOI] [PMC free article] [PubMed] [Google Scholar]
- 23.Beyeen A.D., Adzemovic M.Z., Ockinger J., Stridh P., Becanovic K., Laaksonen H., Lassmann H., Harris R.A., Hillert J., Alfredsson L., et al. IL-22RA2 associates with multiple sclerosis and macrophage effector mechanisms in experimental neuroinflammation. J. Immunol. 2010;185:6883–6890. doi: 10.4049/jimmunol.1001392. [DOI] [PubMed] [Google Scholar]
- 24.Marta M., Stridh P., Becanovic K., Gillett A., Ockinger J., Lorentzen J.C., Jagodic M., Olsson T. Multiple loci comprising immune-related genes regulate experimental neuroinflammation. Genes Immun. 2010;11:21–36. doi: 10.1038/gene.2009.62. [DOI] [PubMed] [Google Scholar]
- 25.Nohra R., Beyeen A.D., Guo J.P., Khademi M., Sundqvist E., Hedreul M.T., Sellebjerg F., Smestad C., Oturai A.B., Harbo H.F., et al. RGMA and IL21R show association with experimental inflammation and multiple sclerosis. Genes Immun. 2010;11:279–293. doi: 10.1038/gene.2009.111. [DOI] [PubMed] [Google Scholar]
- 26.Stridh P., Thessen Hedreul M., Beyeen A.D., Adzemovic M.Z., Laaksonen H., Gillett A., Ockinger J., Marta M., Lassmann H., Becanovic K., et al. Fine-mapping resolves Eae23 into two QTLs and implicates ZEB1 as a candidate gene regulating experimental neuroinflammation in rat. PLoS ONE. 2010;5 doi: 10.1371/journal.pone.0012716. e12716. [DOI] [PMC free article] [PubMed] [Google Scholar]
- 27.Adzemovic M.Z., Ockinger J., Zeitelhofer M., Hochmeister S., Beyeen A.D., Paulson A., Gillett A., Thessen Hedreul M., Covacu R., Lassmann H., et al. Expression of Ccl11 associates with immune response modulation and protection against neuroinflammation in rats. PLoS ONE. 2012;7 doi: 10.1371/journal.pone.0039794. e39794. [DOI] [PMC free article] [PubMed] [Google Scholar]
- 28.Willy P.J., Mangelsdorf D.J. Unique requirements for retinoid-dependent transcriptional activation by the orphan receptor LXR. Genes Dev. 1997;11:289–298. doi: 10.1101/gad.11.3.289. [DOI] [PubMed] [Google Scholar]
- 29.Darvasi A. Genomics: gene expression meets genetics. Nature. 2003;422:269–270. doi: 10.1038/422269a. [DOI] [PubMed] [Google Scholar]
- 30.Yvert G., Brem R.B., Whittle J., Akey J.M., Foss E., Smith E.N., Mackelprang R., Kruglyak L. Trans-acting regulatory variation in Saccharomyces cerevisiae and the role of transcription factors. Nat. Genet. 2003;35:57–64. doi: 10.1038/ng1222. [DOI] [PubMed] [Google Scholar]
- 31.Royo H., Cavaille J. Non-coding RNAs in imprinted gene clusters. Biol. Cell. 2008;100:149–166. doi: 10.1042/BC20070126. [DOI] [PubMed] [Google Scholar]
- 32.Jurica M.S., Moore M.J. Pre-mRNA splicing: awash in a sea of proteins. Mol. Cell. 2003;12:5–14. doi: 10.1016/s1097-2765(03)00270-3. [DOI] [PubMed] [Google Scholar]
- 33.International Multiple Sclerosis Genetics Conssortium (IMSGC)., Esposito, F., Patsopoulos, N.A., Cepok, S., Kockum, I., Leppä, V., Booth, D.R., Heard, R.N., Stewart, G.J., Cox, M. et al. IL12A, MPHOSPH9/CDK2AP1 and RGS1 are novel multiple sclerosis susceptibility loci. Genes Immun. 2010;11:397–405. doi: 10.1038/gene.2010.28. [DOI] [PMC free article] [PubMed] [Google Scholar]
- 34.Jostins L., Ripke S., Weersma R.K., Duerr R.H., McGovern D.P., Hui K.Y., Lee J.C., Schumm L.P., Sharma Y., Anderson C.A., et al. Host-microbe interactions have shaped the genetic architecture of inflammatory bowel disease. Nature. 2012;491:119–124. doi: 10.1038/nature11582. [DOI] [PMC free article] [PubMed] [Google Scholar]
- 35.Langfelder P., Horvath S. WGCNA: an R package for weighted correlation network analysis. BMC Bioinformatics. 2008;9:559. doi: 10.1186/1471-2105-9-559. [DOI] [PMC free article] [PubMed] [Google Scholar]
- 36.De Jager P.L., Jia X., Wang J., de Bakker P.I., Ottoboni L., Aggarwal N.T., Piccio L., Raychaudhuri S., Tran D., Aubin C., et al. Meta-analysis of genome scans and replication identify CD6, IRF8 and TNFRSF1A as new multiple sclerosis susceptibility loci. Nat. Genet. 2009;41:776–782. doi: 10.1038/ng.401. [DOI] [PMC free article] [PubMed] [Google Scholar]
- 37.Trynka G., Hunt K.A., Bockett N.A., Romanos J., Mistry V., Szperl A., Bakker S.F., Bardella M.T., Bhaw-Rosun L., Castillejo G., et al. Dense genotyping identifies and localizes multiple common and rare variant association signals in celiac disease. Nat. Genet. 2011;43:1193–1201. doi: 10.1038/ng.998. [DOI] [PMC free article] [PubMed] [Google Scholar]
- 38.Erlich H.A., Valdes A.M., Julier C., Mirel D., Noble J.A., Type I.D.G.C. Evidence for association of the TCF7 locus with type I diabetes. Genes Immun. 2009;10(Suppl. 1):S54–S59. doi: 10.1038/gene.2009.92. [DOI] [PMC free article] [PubMed] [Google Scholar]
- 39.Kofler D.M., Severson C.A., Mousissian N., De Jager P.L., Hafler D.A. The CD6 multiple sclerosis susceptibility allele is associated with alterations in CD4+ T cell proliferation. J. Immunol. 2011;187:3286–3291. doi: 10.4049/jimmunol.1100626. [DOI] [PubMed] [Google Scholar]
- 40.Verger A., Duterque-Coquillaud M. When Ets transcription factors meet their partners. Bioessays. 2002;24:362–370. doi: 10.1002/bies.10068. [DOI] [PubMed] [Google Scholar]
- 41.Eyquem S., Chemin K., Fasseu M., Bories J.C. The Ets-1 transcription factor is required for complete pre-T cell receptor function and allelic exclusion at the T cell receptor beta locus. Proc. Natl Acad. Sci. USA. 2004;101:15712–15717. doi: 10.1073/pnas.0405546101. [DOI] [PMC free article] [PubMed] [Google Scholar]
- 42.Becanovic K., Wallstrom E., Kornek B., Glaser A., Broman K.W., Dahlman I., Olofsson P., Holmdahl R., Luthman H., Lassmann H., et al. New loci regulating rat myelin oligodendrocyte glycoprotein-induced experimental autoimmune encephalomyelitis. J. Immunol. 2003;170:1062–1069. doi: 10.4049/jimmunol.170.2.1062. [DOI] [PubMed] [Google Scholar]
- 43.Jin C., Kato K., Chimura T., Yamasaki T., Nakade K., Murata T., Li H., Pan J., Zhao M., Sun K., et al. Regulation of histone acetylation and nucleosome assembly by transcription factor JDP2. Nat. Struct. Mol. Biol. 2006;13:331–338. doi: 10.1038/nsmb1063. [DOI] [PubMed] [Google Scholar]
- 44.Vieira E., Marroqui L., Batista T.M., Caballero-Garrido E., Carneiro E.M., Boschero A.C., Nadal A., Quesada I. The clock gene Rev-erbalpha regulates pancreatic beta-cell function: modulation by leptin and high-fat diet. Endocrinology. 2012;153:592–601. doi: 10.1210/en.2011-1595. [DOI] [PubMed] [Google Scholar]
- 45.Tsoi L.C., Spain S.L., Knight J., Ellinghaus E., Stuart P.E., Capon F., Ding J., Li Y., Tejasvi T., Gudjonsson J.E., et al. Identification of 15 new psoriasis susceptibility loci highlights the role of innate immunity. Nat. Genet. 2012;44:1341–1348. doi: 10.1038/ng.2467. [DOI] [PMC free article] [PubMed] [Google Scholar]
- 46.Prescott N.J., Dominy K.M., Kubo M., Lewis C.M., Fisher S.A., Redon R., Huang N., Stranger B.E., Blaszczyk K., Hudspith B., et al. Independent and population-specific association of risk variants at the IRGM locus with Crohn's disease. Hum. Mol. Genet. 2010;19:1828–1839. doi: 10.1093/hmg/ddq041. [DOI] [PMC free article] [PubMed] [Google Scholar]
- 47.Franke A., McGovern D.P., Barrett J.C., Wang K., Radford-Smith G.L., Ahmad T., Lees C.W., Balschun T., Lee J., Roberts R., et al. Genome-wide meta-analysis increases to 71 the number of confirmed Crohn's disease susceptibility loci. Nat. Genet. 2010;42:1118–1125. doi: 10.1038/ng.717. [DOI] [PMC free article] [PubMed] [Google Scholar]
- 48.Serrano-Fernandez P., Moller S., Goertsches R., Fiedler H., Koczan D., Thiesen H.J., Zettl U.K. Time course transcriptomics of IFNB1b drug therapy in multiple sclerosis. Autoimmunity. 2010;43:172–178. doi: 10.3109/08916930903219040. [DOI] [PubMed] [Google Scholar]
- 49.Gillett A., Maratou K., Fewings C., Harris R.A., Jagodic M., Aitman T., Olsson T. Alternative splicing and transcriptome profiling of experimental autoimmune encephalomyelitis using genome-wide exon arrays. PLoS ONE. 2009;4 doi: 10.1371/journal.pone.0007773. e7773. [DOI] [PMC free article] [PubMed] [Google Scholar]
- 50.Wathelet M.G., Clauss I.M., Nols C.B., Content J., Huez G.A. New inducers revealed by the promoter sequence analysis of two interferon-activated human genes. Eur. J. Biochem. 1987;169:313–321. doi: 10.1111/j.1432-1033.1987.tb13614.x. [DOI] [PubMed] [Google Scholar]
- 51.Smith J.B., Herschman H.R. The glucocorticoid attenuated response genes GARG-16, GARG-39, and GARG-49/IRG2 encode inducible proteins containing multiple tetratricopeptide repeat domains. Arch. Biochem. Biophys. 1996;330:290–300. doi: 10.1006/abbi.1996.0256. [DOI] [PubMed] [Google Scholar]
- 52.Comabella M., Lunemann J.D., Rio J., Sanchez A., Lopez C., Julia E., Fernandez M., Nonell L., Camina-Tato M., Deisenhammer F., et al. A type I interferon signature in monocytes is associated with poor response to interferon-beta in multiple sclerosis. Brain. 2009;132:3353–3365. doi: 10.1093/brain/awp228. [DOI] [PubMed] [Google Scholar]
- 53.Levine B., Mizushima N., Virgin H.W. Autophagy in immunity and inflammation. Nature. 2011;469:323–335. doi: 10.1038/nature09782. [DOI] [PMC free article] [PubMed] [Google Scholar]
- 54.Bielekova B., Catalfamo M., Reichert-Scrivner S., Packer A., Cerna M., Waldmann T.A., McFarland H., Henkart P.A., Martin R. Regulatory CD56(bright) natural killer cells mediate immunomodulatory effects of IL-2Ralpha-targeted therapy (daclizumab) in multiple sclerosis. Proc. Natl Acad. Sci. USA. 2006;103:5941–5946. doi: 10.1073/pnas.0601335103. [DOI] [PMC free article] [PubMed] [Google Scholar]
- 55.Zhang B., Yamamura T., Kondo T., Fujiwara M., Tabira T. Regulation of experimental autoimmune encephalomyelitis by natural killer (NK) cells. J. Exp. Med. 1997;186:1677–1687. doi: 10.1084/jem.186.10.1677. [DOI] [PMC free article] [PubMed] [Google Scholar]
- 56.Xu W., Fazekas G., Hara H., Tabira T. Mechanism of natural killer (NK) cell regulatory role in experimental autoimmune encephalomyelitis. J. Neuroimmunol. 2005;163:24–30. doi: 10.1016/j.jneuroim.2005.02.011. [DOI] [PubMed] [Google Scholar]
- 57.Pao S.S., Paulsen I.T., Saier M.H., Jr Major facilitator superfamily. Microbiol. Mol. Biol. Rev. 1998;62:1–34. doi: 10.1128/mmbr.62.1.1-34.1998. [DOI] [PMC free article] [PubMed] [Google Scholar]
- 58.Walmsley A.R., Barrett M.P., Bringaud F., Gould G.W. Sugar transporters from bacteria, parasites and mammals: structure-activity relationships. Trends Biochem. Sci. 1998;23:476–481. doi: 10.1016/s0968-0004(98)01326-7. [DOI] [PubMed] [Google Scholar]
- 59.Cho H., Harrison K., Kehrl J.H. Regulators of G protein signaling: potential drug targets for controlling cardiovascular and immune function. Curr. Drug Targets Immune Endocr. Metab. Disord. 2004;4:107–118. doi: 10.2174/1568008043339938. [DOI] [PubMed] [Google Scholar]
- 60.Strange P.G. Signaling mechanisms of GPCR ligands. Curr. Opin. Drug. Discov. Devel. 2008;11:196–202. [PubMed] [Google Scholar]
- 61.Koepsell H., Lips K., Volk C. Polyspecific organic cation transporters: structure, function, physiological roles, and biopharmaceutical implications. Pharm. Res. 2007;24:1227–1251. doi: 10.1007/s11095-007-9254-z. [DOI] [PubMed] [Google Scholar]
- 62.Wojtal K.A., Eloranta J.J., Hruz P., Gutmann H., Drewe J., Staumann A., Beglinger C., Fried M., Kullak-Ublick G.A., Vavricka S.R. Changes in mRNA expression levels of solute carrier transporters in inflammatory bowel disease patients. Drug Metab. Dispos. 2009;37:1871–1877. doi: 10.1124/dmd.109.027367. [DOI] [PubMed] [Google Scholar]
- 63.Liston A., Kohler R.E., Townley S., Haylock-Jacobs S., Comerford I., Caon A.C., Webster J., Harrison J.M., Swann J., Clark-Lewis I., et al. Inhibition of CCR6 function reduces the severity of experimental autoimmune encephalomyelitis via effects on the priming phase of the immune response. J. Immunol. 2009;182:3121–3130. doi: 10.4049/jimmunol.0713169. [DOI] [PubMed] [Google Scholar]
- 64.Reboldi A., Coisne C., Baumjohann D., Benvenuto F., Bottinelli D., Lira S., Uccelli A., Lanzavecchia A., Engelhardt B., Sallusto F. C-C chemokine receptor 6-regulated entry of TH-17 cells into the CNS through the choroid plexus is required for the initiation of EAE. Nat. Immunol. 2009;10:514–523. doi: 10.1038/ni.1716. [DOI] [PubMed] [Google Scholar]
- 65.Eyre S., Bowes J., Diogo D., Lee A., Barton A., Martin P., Zhernakova A., Stahl E., Viatte S., McAllister K., et al. High-density genetic mapping identifies new susceptibility loci for rheumatoid arthritis. Nat. Genet. 2012;44:1336–1340. doi: 10.1038/ng.2462. [DOI] [PMC free article] [PubMed] [Google Scholar]
- 66.Calabresi P.A., Fields N.S., Maloni H.W., Hanham A., Carlino J., Moore J., Levin M.C., Dhib-Jalbut S., Tranquill L.R., Austin H., et al. Phase 1 trial of transforming growth factor beta 2 in chronic progressive MS. Neurology. 1998;51:289–292. doi: 10.1212/wnl.51.1.289. [DOI] [PubMed] [Google Scholar]
- 67.Dunn G.P., Koebel C.M., Schreiber R.D. Interferons, immunity and cancer immunoediting. Nat. Rev. Immunol. 2006;6:836–848. doi: 10.1038/nri1961. [DOI] [PubMed] [Google Scholar]
- 68.Noyes H.A., Agaba M., Anderson S., Archibald A.L., Brass A., Gibson J., Hall L., Hulme H., Oh S.J., Kemp S. Genotype and expression analysis of two inbred mouse strains and two derived congenic strains suggest that most gene expression is trans regulated and sensitive to genetic background. BMC Genomics. 2010;11:361. doi: 10.1186/1471-2164-11-361. [DOI] [PMC free article] [PubMed] [Google Scholar]
- 69.Postigo A.A., Dean D.C. Differential expression and function of members of the zfh-1 family of zinc finger/homeodomain repressors. Proc. Natl Acad. Sci. USA. 2000;97:6391–6396. doi: 10.1073/pnas.97.12.6391. [DOI] [PMC free article] [PubMed] [Google Scholar]
- 70.Williams T.M., Moolten D., Burlein J., Romano J., Bhaerman R., Godillot A., Mellon M., Rauscher F.J., 3rd, Kant J.A. Identification of a zinc finger protein that inhibits IL-2 gene expression. Science. 1991;254:1791–1794. doi: 10.1126/science.1840704. [DOI] [PubMed] [Google Scholar]
- 71.Yasui D.H., Genetta T., Kadesch T., Williams T.M., Swain S.L., Tsui L.V., Huber B.T. Transcriptional repression of the IL-2 gene in Th cells by ZEB. J. Immunol. 1998;160:4433–4440. [PubMed] [Google Scholar]
- 72.Sriram S., Solomon D., Rouse R.V., Steinman L. Identification of T cell subsets and B lymphocytes in mouse brain experimental allergic encephalitis lesions. J. Immunol. 1982;129:1649–1651. [PubMed] [Google Scholar]
- 73.Nyland H., Mork S., Matre R. In-situ characterization of mononuclear cell infiltrates in lesions of multiple sclerosis. Neuropathol. Appl. Neurobiol. 1982;8:403–411. doi: 10.1111/j.1365-2990.1982.tb00308.x. [DOI] [PubMed] [Google Scholar]
- 74.Sun D., Whitaker J.N., Huang Z., Liu D., Coleclough C., Wekerle H., Raine C.S. Myelin antigen-specific CD8+ T cells are encephalitogenic and produce severe disease in C57BL/6 mice. J. Immunol. 2001;166:7579–7587. doi: 10.4049/jimmunol.166.12.7579. [DOI] [PubMed] [Google Scholar]
- 75.Huseby E.S., Liggitt D., Brabb T., Schnabel B., Ohlen C., Goverman J. A pathogenic role for myelin-specific CD8(+) T cells in a model for multiple sclerosis. J. Exp. Med. 2001;194:669–676. doi: 10.1084/jem.194.5.669. [DOI] [PMC free article] [PubMed] [Google Scholar]
- 76.Chabod M., Pedros C., Lamouroux L., Colacios C., Bernard I., Lagrange D., Balz-Hara D., Mosnier J.F., Laboisse C., Vergnolle N., et al. A spontaneous mutation of the rat Themis gene leads to impaired function of regulatory T cells linked to inflammatory bowel disease. PLoS Genet. 2012;8:e1002461. doi: 10.1371/journal.pgen.1002461. [DOI] [PMC free article] [PubMed] [Google Scholar]
- 77.Beyer M., Thabet Y., Muller R.U., Sadlon T., Classen S., Lahl K., Basu S., Zhou X., Bailey-Bucktrout S.L., Krebs W., et al. Repression of the genome organizer SATB1 in regulatory T cells is required for suppressive function and inhibition of effector differentiation. Nat. Immunol. 2011;12:898–907. doi: 10.1038/ni.2084. [DOI] [PMC free article] [PubMed] [Google Scholar]
- 78.Guler M.L., Gorham J.D., Dietrich W.F., Murphy T.L., Steen R.G., Parvin C.A., Fenoglio D., Grupe A., Peltz G., Murphy K.M. Tpm1, a locus controlling IL-12 responsiveness, acts by a cell-autonomous mechanism. J. Immunol. 1999;162:1339–1347. [PubMed] [Google Scholar]
- 79.Yeh J.H., Sidhu S.S., Chan A.C. Regulation of a late phase of T cell polarity and effector functions by Crtam. Cell. 2008;132:846–859. doi: 10.1016/j.cell.2008.01.013. [DOI] [PubMed] [Google Scholar]
- 80.Kosaka Y., Felices M., Berg L.J. Itk and Th2 responses: action but no reaction. Trends. Immunol. 2006;27:453–460. doi: 10.1016/j.it.2006.08.006. [DOI] [PubMed] [Google Scholar]
- 81.Gavin M.A., Rasmussen J.P., Fontenot J.D., Vasta V., Manganiello V.C., Beavo J.A., Rudensky A.Y. Foxp3-dependent programme of regulatory T-cell differentiation. Nature. 2007;445:771–775. doi: 10.1038/nature05543. [DOI] [PubMed] [Google Scholar]
- 82.Sakaguchi S., Yamaguchi T., Nomura T., Ono M. Regulatory T cells and immune tolerance. Cell. 2008;133:775–787. doi: 10.1016/j.cell.2008.05.009. [DOI] [PubMed] [Google Scholar]
- 83.Malucchi S., Gilli F., Caldano M., Marnetto F., Valentino P., Granieri L., Sala A., Capobianco M., Bertolotto A. Predictive markers for response to interferon therapy in patients with multiple sclerosis. Neurology. 2008;70:1119–1127. doi: 10.1212/01.wnl.0000304040.29080.7b. [DOI] [PubMed] [Google Scholar]
- 84.Watashi K., Hijikata M., Tagawa A., Doi T., Marusawa H., Shimotohno K. Modulation of retinoid signaling by a cytoplasmic viral protein via sequestration of Sp110b, a potent transcriptional corepressor of retinoic acid receptor, from the nucleus. Mol. Cell Biol. 2003;23:7498–7509. doi: 10.1128/MCB.23.21.7498-7509.2003. [DOI] [PMC free article] [PubMed] [Google Scholar]
- 85.Guo A., Salomoni P., Luo J., Shih A., Zhong S., Gu W., Pandolfi P.P. The function of PML in p53-dependent apoptosis. Nat. Cell Biol. 2000;2:730–736. doi: 10.1038/35036365. [DOI] [PubMed] [Google Scholar]
- 86.Chang N.S., Pratt N., Heath J., Schultz L., Sleve D., Carey G.B., Zevotek N. Hyaluronidase induction of a WW domain-containing oxidoreductase that enhances tumor necrosis factor cytotoxicity. J. Biol. Chem. 2001;276:3361–3370. doi: 10.1074/jbc.M007140200. [DOI] [PubMed] [Google Scholar]
- 87.Kennedy J., Kelner G.S., Kleyensteuber S., Schall T.J., Weiss M.C., Yssel H., Schneider P.V., Cocks B.G., Bacon K.B., Zlotnik A. Molecular cloning and functional characterization of human lymphotactin. J. Immunol. 1995;155:203–209. [PubMed] [Google Scholar]
- 88.Yoshida T., Imai T., Takagi S., Nishimura M., Ishikawa I., Yaoi T., Yoshie O. Structure and expression of two highly related genes encoding SCM-1/human lymphotactin. FEBS Lett. 1996;395:82–88. doi: 10.1016/0014-5793(96)01004-6. [DOI] [PubMed] [Google Scholar]
- 89.Amor S., Groome N., Linington C., Morris M.M., Dornmair K., Gardinier M.V., Matthieu J.M., Baker D. Identification of epitopes of myelin oligodendrocyte glycoprotein for the induction of experimental allergic encephalomyelitis in SJL and Biozzi AB/H mice. J. Immunol. 1994;153:4349–4356. [PubMed] [Google Scholar]
- 90.Flytzani S., Stridh P., Guerreiro-Cacais A.O., Marta M., Hedreul M.T., Jagodic M., Olsson T. Anti-MOG antibodies are under polygenic regulation with the most significant control coming from the C-type lectin-like gene locus. Genes Immun. 2013 doi: 10.1038/gene.2013.33. [Epub ahead of print]. PMID: 23784360. [DOI] [PubMed] [Google Scholar]
- 91.Flicek P., Amode M.R., Barrell D., Beal K., Brent S., Carvalho-Silva D., Clapham P., Coates G., Fairley S., Fitzgerald S., et al. Ensembl 2012. Nucleic Acids Res. 2012;40:D84–D90. doi: 10.1093/nar/gkr991. [DOI] [PMC free article] [PubMed] [Google Scholar]
- 92.Parkinson H., Kapushesky M., Shojatalab M., Abeygunawardena N., Coulson R., Farne A., Holloway E., Kolesnykov N., Lilja P., Lukk M., et al. ArrayExpress—a public database of microarray experiments and gene expression profiles. Nucleic Acids Res. 2007;35:D747–D750. doi: 10.1093/nar/gkl995. [DOI] [PMC free article] [PubMed] [Google Scholar]
- 93.Glaser R.L., Broman K.W., Schulman R.L., Eskenazi B., Wyrobek A.J., Jabs E.W. The paternal-age effect in Apert syndrome is due, in part, to the increased frequency of mutations in sperm. Am. J. Hum. Genet. 2003;73:939–947. doi: 10.1086/378419. [DOI] [PMC free article] [PubMed] [Google Scholar]
- 94.Churchill G.A., Doerge R.W. Empirical threshold values for quantitative trait mapping. Genetics. 1994;138:963–971. doi: 10.1093/genetics/138.3.963. [DOI] [PMC free article] [PubMed] [Google Scholar]
- 95.Voigt C., Moller S., Ibrahim S.M., Serrano-Fernandez P. Non-linear conversion between genetic and physical chromosomal distances. Bioinformatics. 2004;20:1966–1967. doi: 10.1093/bioinformatics/bth168. [DOI] [PubMed] [Google Scholar]
Associated Data
This section collects any data citations, data availability statements, or supplementary materials included in this article.