Abstract
Many halogenated organic contaminants (HOCs) are considered endocrine disruptors and affect the hypothalamic-pituitary-thyroid axis, often by interfering with circulating levels of thyroid hormones (THs). This study investigated one potential mechanism for TH disruption, inhibition of sulfotransferase activity. One of the primary roles of TH sulfation is to support the regulation of biologically active T3 through the formation of inactive THs. This study investigated TH sulfotransferase inhibition by 14 hydroxylated polybrominated diphenyl ethers (OH-BDEs), BDE 47, triclosan, and fluorinated, chlorinated, brominated and iodinated analogues of 2,4,6-trihalogenated phenol and BPA. A new mass spectrometry-based method was also developed to measure the formation rates of 3,3′-T2 sulfate (3,3′-T2S). Using pooled human liver cytosol we investigated the influence of these HOCs on the sulfation of 3,3′-T2, a major substrate for TH sulfation. For the formation of 3,3′-T2 sulfate, the Michaelis constant (Km) was 1070 ± 120 nM and the Vmax was 153 ± 6.6 pmol/min.mg protein. All chemicals investigated inhibited sulfotransferase activity with the exception of BDE 47. The 2,4,6-trihalogenated phenols were the most potent inhibitors followed by the OH-BDEs and then halogenated BPAs. The IC50 concentrations for the OH-BDEs were primarily in the low nM range, which may be environmentally relevant. In silico molecular modeling techniques were also used to simulate OH-BDE binding with SULT1A1. This study suggests that some HOCs, including anti-microbial chemicals and metabolites of flame retardants, may interfere with TH regulation through inhibition of sulfotransferase activity.
Keywords: thyroid hormones, sulfotransferase enzymes, human liver cytosol, brominated flame retardants, in silico modeling
Introduction
In recent years, there has been considerable attention on halogenated organic compounds (HOCs) and their potential as endocrine disruptors.1 The focus has mainly been on estrogenic and androgenic effects, but there is increasing interest on thyroid hormone (TH) regulation.2 The maintenance of TH homeostasis is complex, but critical for normal physical and mental development.3, 4 The thyroid disrupting effects of HOCs have been attributed to their structural similarity to endogenous THs (i.e. hydroxyl group, halogens on the aromatic rings), which may allow the chemicals to interact with TH enzymes, transporter proteins and nuclear receptors.
Human studies have shown relationships between HOC exposure and alterations in serum thyroid-stimulating hormone (TSH), thyroxine (T4) or triiodothyronine (T3) concentrations. For example, higher brominated flame retardant exposure has generally been associated with lower TSH and higher free and total T4.5–9 Rodent studies have also shown TH disrupting effects, however, the effects are typically opposite to human studies, with higher exposure to brominated flame retardants levels generally associated with lower TH levels.7, 10, 11
Several potential mechanisms for TH disruption have been investigated using in vitro techniques. HOCs and their metabolites have been shown to competitively bind to TH transporter proteins, transthyretin (TTR) 12, 13 and thyroxine-binding globulin (TBG) 14 as well as to the TH alpha and beta receptors in mammals.15, 16 Further, some HOCs have been shown to inhibit deiodinase (DI) enzymes,17, 18 including work from our laboratory which investigated DI inhibition by hydroxylated polybrominated diphenyl ethers (OH-BDEs), halogenated bisphenol A compounds, triclosan and trihalogenated phenols.19
In addition to deiodination, THs undergo phase II metabolism via conjugation of the hydroxyl group with glucuronic acid or sulfate. It has been suggested that the main consequence of TH sulfation is the formation of inactive THs. This is because sulfated THs have increased rates of deiodination as compared to non-sulfated analogues.20 For example, using an in vitro assay, T4 sulfation increased inner-ring deiodination by ~200-fold, forming 3,3′,5′-triiodothyronine (rT3) sulfate.20
The cytosolic sulfotransferase (SULT) super family catalyzes a diverse range of endogenous and xenobiotics chemicals.21 The mechanism involves the transfer of a sulfonate group from the cofactor, 3′-phosphoadenosine-5′-phosphosulfate (PAPS), to the acceptor group of the substrate molecule. Eight different isozymes (SULT1A1, SULT1A3, SULT1A5, SULT1B1, SULT1B2, SULT1C1, SULT1E1 and SULT2A1) have been shown to perform TH sulfation in humans and are broadly expressed in peripheral tissues.22, 23 In general, there is a substrate preference for 3,3′-diiodothyronine (3,3′-T2) with the exception of SULT 1E1 which shows equal preference for rT3 and 3,3′-T2.23
The SULT enzymes are inhibited by various environmental contaminants, pharmaceuticals and chemicals in the diet, which may ultimately result in impacts on human health.24 For example, SULT inhibition may reduce phase II metabolism, increasing accumulation of toxic chemicals. Further, inhibition of the SULT1E1 isozyme may disrupt normal estrogen and androgen homeostasis.
Specific to the focus of this study, some studies have shown disruption of TH sulfotransferase activity by xenobiotics. For example, previous work showed that hydroxylated polychlorinated biphenyls (OH-PCBs), dibenzo-p-dioxins (PCDDs), dibenzofurans (PCDFs) and several halogenated phenols inhibit in vitro 3,3′-T2 sulfotransferase activity.25–27 In addition, two BDE congeners were shown to inhibit 3,3′-T2 sulfation in rat liver cytosol, but only after metabolism with CYP enriched microsomes.25 Further, Szabo et al. 28 showed increased SULT1B1 mRNA expression in male rat pups that were maternally exposed to a PentaBDE commercial mixture. However, previous work has mostly been performed using rat liver cytosol and there is a need to further understand TH sulfotransferase inhibition in human tissues.
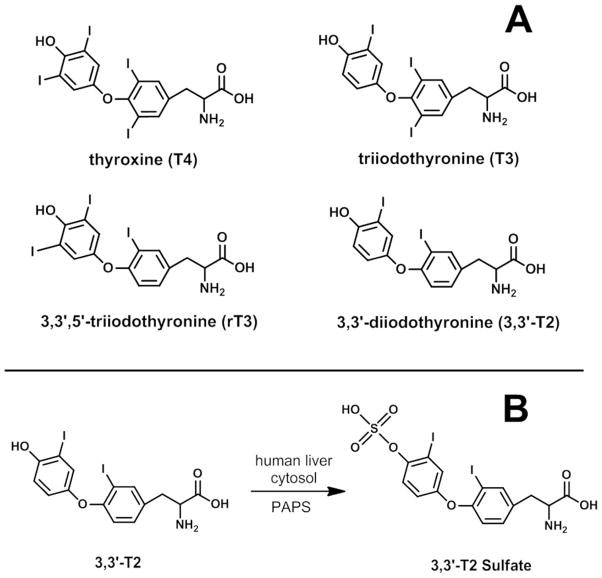
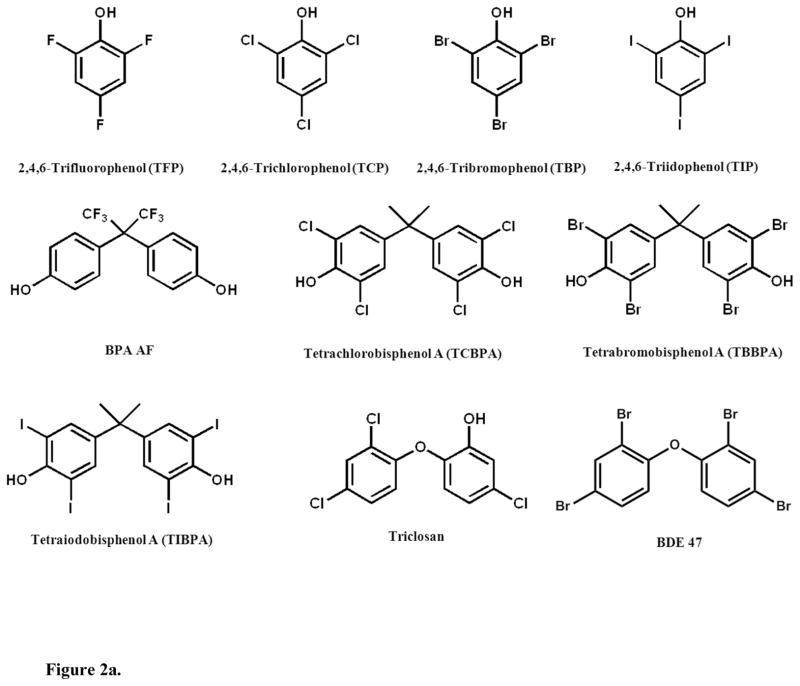
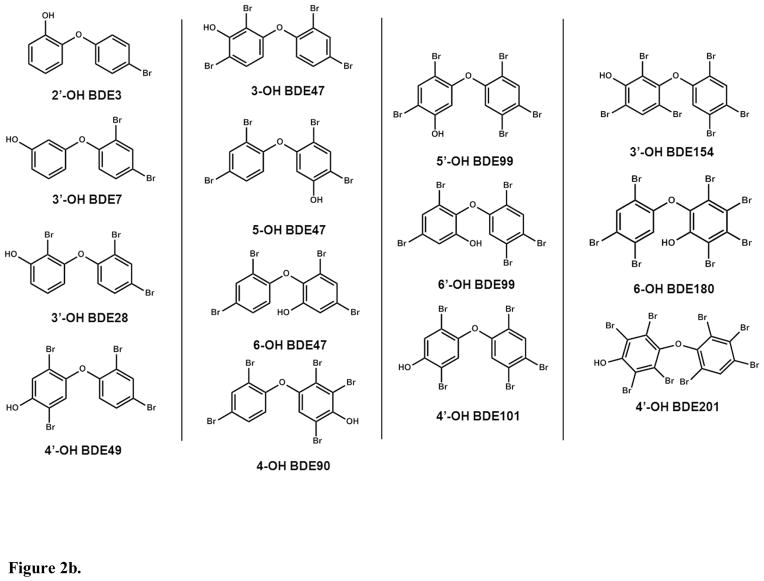
The present study investigated TH sulfotransferase inhibition by HOCs using a validated in vitro assay with a novel detection approach, liquid chromatography tandem mass spectrometry (LC/MS/MS). The 3,3′-T2 reaction is shown in Figure 1. We used 3,3′-T2 as the substrate because it is a primary substrate for multiple SULT allozymes and is a good surrogate for other THs with respect to sulfotransferase inhibition.29 Our model system was pooled human liver cytosol since the liver is a major site of TH metabolism. We tested several brominated flame retardants and their metabolites as potential TH sulfation inhibitors (chemical structures shown in Figures 2a & 2b). Further, we explored structure-activity relationships by investigating TH sulfation inhibition by fluorinated, chlorinated and iodinated analogues. In addition we tested 14 OH-BDEs. Finally, we used in silico molecular modeling to simulate OH-BDE binding with SULT1A1, an important isozyme for TH sulfation.
Figure 1.
A) Thyroid hormone structures. B) Thyroid hormone sulfation reaction investigated in the present study.
Figure 2.
Figure 2a. Chemical structures of inhibitors investigated.
Figure 2b. Chemical structures of inhibitors investigated.
Experimental Procedures
Chemicals
3,3′-T2 (>99%), triclosan (Irgasan, >97%), tetrabromobisphenol A, (TBBPA, 97%), 4,4′-(hexafluoroisopropylidene)diphenol (BPA AF, 97%), 2,4,6-tribromophenol (2,4,6-TBP, 99%), 2,4,6-trifluorophenol (2,4,6-TFP, 99%), 2,4,6,-trichlorophenol (2,4,6-TCP, 98%), 2,4,6-triiodophenol (2,4,6-TIP,97%), adenosine 3′-phosphate 5′-phosphosulfate lithium salt hydrate (>60%) were purchased from Sigma-Aldrich (St. Louis, MO). 3,3′,5,5′-tetrachlorobisphenol A (TCBPA, 98%) was purchased from TCI America (Portland, OR). 3,3′,5,5′-tetraiodobisphenol A (TIBPA, 98%) was purchased from Spectra Group Limited (Millbury, OH). 2′-OH BDE 3 (2′-OH 4-BDE. 97.5%), 3′-OH BDE 7 (3′OH 2,4-BDE. 99.3%), 3′-OH BDE 28 (3′-OH 2,4,4′-BDE, 99.6%), 3-OH BDE 47 (3-OH 2,2′,4,4′-BDE, 97%), 5-OH BDE 47 (5-OH 2,2′,4,4′-BDE, 98.0%), 6-OH BDE 47 (6-OH 2,2′,4,4′-BDE, 100%), 4′-OH BDE 49 (4′-OH 2,2′,4,5′-BDE, 97.8%), 4-OH BDE 90 (4-OH 2,2′3,4′,5-BDE, 99.5%), 5′-OH BDE 99 (5′-OH 2,2′,4,4′,5-BDE, 99.0%), 6′-OH BDE 99 (6′-OH 2,2′,4,4′,5-BDE, 99.3%), 4′-OH BDE 101 (4′-OH 2,2′,4,5,5′-BDE, 99.2%), 3′-OH BDE 154 (3′-OH 2,2′,4,4′,5,6′-BDE, 99.0%), 6-OH BDE 180 (6-OH 2,2′,3,4,4′,5,5′-BDE, 99.6%), 4′-OH BDE 201 (4′-OH 2,2′,3,3′,4,5′,6,6′-BDE, 99.3%) were purchased from AccuStandard (New Haven, CT). The 13C6-3,3′-T2 was purchased from Isotec (Miamisburg, OH). 3,3′-T2 sulfate (3,3′-T2S) was custom synthesized by the Duke University Small Molecule Synthesis Facility (98%, Durham, NC).
Sulfotransferase Inhibition Assays
Sulfotransferase assays were modified from previously described methods.27 The primary modification in our methods was the use of solid phase extraction (SPE) for sample clean-up and the use of LC/MS/MS for thyroid hormones and sulfated metabolite analysis. Human liver cytosol (pool of 28 donors) was purchased from a commercial source (Invitrogen, Carlsbad, California) and kept frozen (−80 C) until use. All donors were male, mostly Caucasian and their ages ranged from 5 to 85 years.
For investigation of sulfation inhibition, cytosol was diluted to 0.25 mg protein/ml in 0.1 M potassium phosphate buffer (pH 7.2) with 50 μM PAPS as the cofactor and 1 μM 3,3′-T2 as the substrate (total volume = 200 μl). Stock solutions of competitors were prepared in DMSO and were added such that solvent volume was 0.5% of the incubation volume. “Active” control samples (no inhibitor) were prepared by spiking with clean DMSO. Buffer blanks were prepared by incubating without the addition of cytosol. Assay reactions were started with the addition of the cytosol. Vials were incubated at 37°C for 30 min in a shaking water bath and, reactions were stopped by the addition of 0.1 M HCl (800 μl). Samples were then spiked with 13C6-3,3′-T2 (6.25 ng) as the internal standard. Extracts were cleaned using SampliQ OPT SPE cartridges (Agilent Technologies). The SPE procedures were modified from our previously published methods.19 Briefly, after conditioning (3 ml methanol, 5 ml water) samples were loaded and the column was rinsed with 2 ml of water. The thyroid hormones and sulfate conjugate were eluted with 2 ml of methanol and the extract was reduced to 1 ml under a gentle stream of nitrogen gas.
In addition, potential sulfation of the OH-BDE competitors was assessed by monitoring the 4-OH BDE 90 concentrations before and after the 30 min incubation with initial 4-OH BDE 90 concentrations of 86 nM and 172 nM (n=3), using the above methods (i.e. co-incubation with 1 μM 3,3′-T2, 30 min incubation). The 4-OH BDE 90 chosen as the representative compound for the OH-BDEs. The 4-OH BDE 90 concentrations were monitored by LC/MS/MS.
3,3′-T2 sulfation kinetics were examined by varying for the substrate concentration (10 nM–5500 nM), incubation time (0–90 min) and protein concentration (0–1 mg/ml). Inter-day variation was determined by performing the assay (1 μM 3,3′-T2, 0.25 mg/ml protein, 30 min incubation) on three separate days (n=3 per day). Samples were extracted and cleaned as described above.
The mechanism of 3,3′-T2 sulfotransferase inhibition (i.e. competitive or non-competitive inhibition) was investigated by measuring the Michaelis Menten parameters (3,3′-T2 concentrations: 0, 100, 500, 1000, 2000 and 5000 nM) with varying concentrations of 4-OH BDE 90 (0, 5, 10, 50 nM). The range of 4-OH BDE 90 concentrations bracketed the calculated IC50.
Instrumental Analysis
Instrumental analysis was performed by liquid chromatography with electrospray ionization tandem mass spectrometry (LC/MS/MS) using conditions modified from our previously published methods.19 Monitored analytes included 3,3′-T2, 3,3′-T2S and 3-monoiodothyronine (3′-T1). Specifically, the liquid chromatography gradient program was altered slightly to account for the relatively more polar property of the 3,3′-T2S. Further, the 3,3′-T2S was analyzed in electrospray ionization negative mode, using the 604>524 transition for quantification and 604>304 transition for confirmation. MS/MS parameters for 3,3′-T2, 3,3′-T2S and 3-T1 were optimized using authentic standards. All analyte responses were normalized to the response of the 13C6-3,3′-T2.
In Silico Sulfotransferase Docking Simulation
Molecular docking of 3,3′-T2 and OH-BDE compounds to the SULT1A1 binding pocket was simulated using the CDOCKER module in Discovery Studio (Accelrys Software Inc., Discovery Studio Modeling Environment, Release 3.1, San Diego, 2011). CDOCKER is a CHARMM (Chemistry at Harvard Macromolecular Mechanics) force field based simulation.30–33 The SULT1A1 structure, originally determined by crystallography,34 was obtained from the RCSB Protein Data Bank (http://www.rcsb.org, PDB ID: 2D06, “Human SULT1A1 complexed with PAP and estradiol”). Prior to simulation, the protein was cleaned (i.e. errors in the protein structure fixed), validated and the estradiol was removed. Docking was performed using the CDOCKER module and the interaction energy between the potential ligands and SULT1A1 was calculated.
QA/QC and Data Analysis
Recovery of the 3,3′-T2 and 3,3′-T2S were 84.9% (standard error = 1.2%) and 89.4% (3.0%), respectively for a 200 nM spike into heat-inactivated cytosol (n=3). Substrate deiodination was not observed in the buffer blanks, nor was formation of the 3,3′-T2S, thus blank correction was not necessary.
Sulfotransferase inhibition was calculated by comparing the relative response of the 3,3′-T2S in the HOC dosed treatments to that of the control (clean DMSO only). IC50 values were obtained using the “one site competition” model in SigmaPlot (v. 9.01, Systat Software Inc., Chicago, IL).
For the kinetics experiments, the apparent Michaelis constant (Km) and maximum reaction rate (Vmax) were obtained by fitting the data to the Michaelis Menten model in JMP 10.0 (SAS, Cary, North Carolina). For the investigation of inhibition mechanism, the Michaelis Menten parameters were compared in JMP by analyzing the ratio of the parameters using Analysis of Means 35. Linear regressions between modeled interaction energies and OH-BDE properties were investigated in JMP. The pKa for OH-BDEs was estimated using SPARC (ibmlc2.chem.uga.edu/sparc). A multivariate linear regression model was used to assess adjusted associations between predictors (pKa, OH-substitution pattern, number of bromine atoms, number of bromine atoms adjacent to OH-group) and the IC50 concentration (SAS 9.3, Cary, North Carolina). For the OH-substitution pattern, congeners were divided into either para- or non-para- OH BDE. Although the pKa and number of bromine atoms were highly correlated, variance inflation factor showed that the parameter estimates were not impacted.
Results
3,3′-T2 Sulfation Kinetics
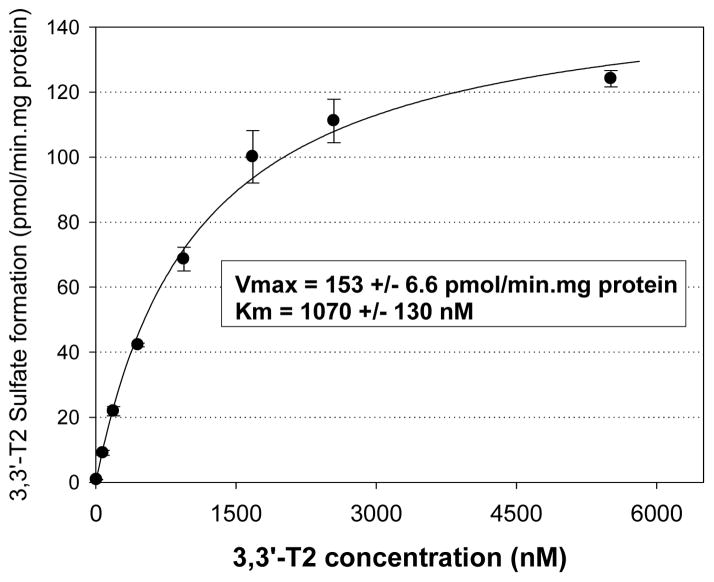
The kinetics of 3,3′-T2 sulfation were investigated in pooled human liver cytosol. The 3,3′-T2 sulfation showed typical Michaelis-Menten enzyme kinetics and the model fit was excellent (r2 = 0.98) (Figure 3). The apparent Km for the 3,3′-T2 sulfation reaction was 1070 ± 130 nM and Vmax was 153 ± 6.6 pmol/min.mg protein. Under physiologically relevant substrate concentrations (i.e. significantly below saturation), the most appropriate parameter for the comparison of metabolic rates is the intrinsic clearance rate (CLint), calculated as the ratio of Vmax to Km.36 In the present study, the CLint was 145 μl/min.mg protein for the 3,3′-T2S formation.
Figure 3.
Formation rate (pmol/min.mg protein) of 3,3′-T2 sulfate resulting from incubation of 3,3′-T2 in 0.25 mg protein/ml of pooled human liver cytosol for 30 min. Michaelis constant (Km) and maximum reaction rate (Vmax) obtained from nonlinear regression analysis. Each data point represented the mean (n=3) and error bars represent 1 standard error.
Inter-day variation was assessed by performing the assay on three separate days (n=3 per day) using the optimized conditions (1 μM 3,3′-T2, 0.25 mg/ml protein, 30 min incubation). The results showed no statistical difference between the three days (ANOVA, p=0.26).
3-T1 formation was not observed, indicating that deiodination of the 3,3′-T2 did not occur in the sulfation assays. The mean mass balance (n=3) was 119% (3,3′-T2 concentration = 250 nM), 107% (500 nM) and 93% (1 μM).
The 3,3′-T2S formation rate was linear from 0–90 min when the 3,3′-T2 (1 μM) and cytosol concentrations (0.25 mg protein/ml) were held constant (Supporting Information, Figure S1). Also, when the 3,3′-T2 (1 μM) and incubation time (30 min) were held constant, the 3,3′-T2S formation rate was linear from 0–0.50 mg protein/ml, but showed a slight drop-off at 1.0 mg/ml (Supporting Information, Figure S2).
Sulfotransferase Inhibition by Halogenated Phenolic Compounds
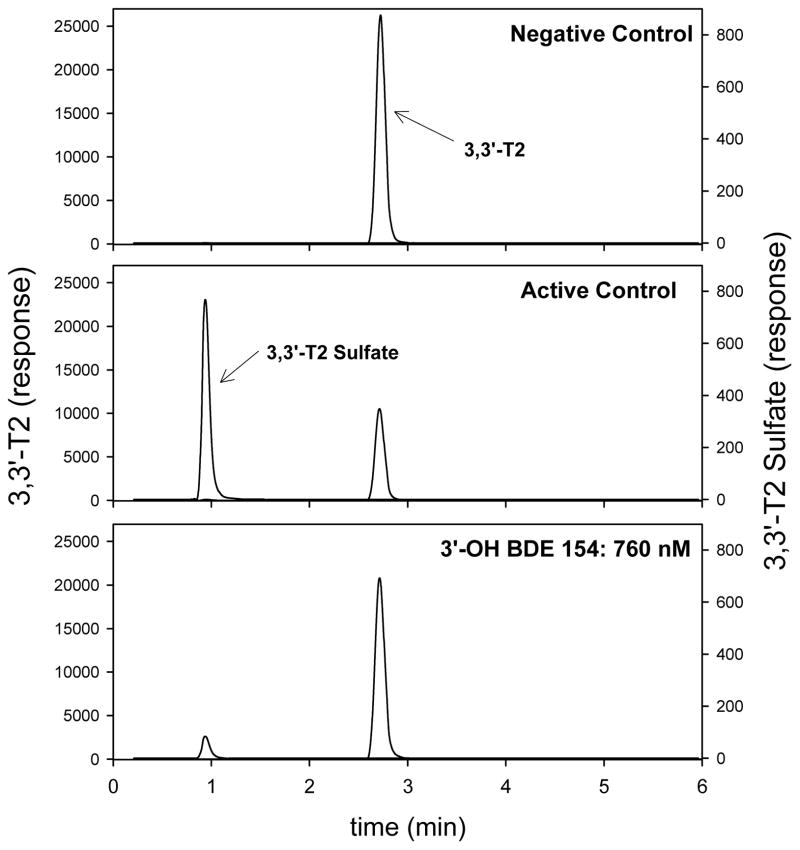
The inhibition of thyroid hormone sulfation was investigated by monitoring the formation of 3,3′-T2S from 3,3′-T2 in the presence of varying doses of individual HOCs. A representative chromatogram, using 3′-OH BDE 154 as the inhibitor, is shown in Figure 4. Calculated IC50 concentrations are shown in Tables 1 and 2. All compounds tested inhibited 3,3′-T2 sulfation in a dose-response manner with complete suppression of 3,3′-T2 sulfotransferase activity at the highest doses tested. The only exception was BDE 47 which did not inhibit 3,3′-T2 sulfation over the range of concentrations tested (10–1000 nM).
Figure 4.
LC/MS/MS chromatograms of negative control (3,3′-T2 only, no cytosol), active control (clean DMSO only) and 760 nM of 3′-OH BDE 154. Incubation conditions were 1 uM 3,3′-T2 for 30 min at 37°C. Peaks were normalized to the 13C-3,3′-T2 response.
Table 1.
IC50 Concentration (nM) and Interaction Energy (kJ/mol) for the Inhibition of 3,3′-T2S Formation by OH-BDEs from the Incubation of 1 μM 3,3′-T2 with Human Liver Cytosol.
| Compound Name | Structure | IC50 (nM) (95% CI) | Interaction Energy (kJ/mol) | Human Serum (pmol/g lipid) |
|---|---|---|---|---|
| 2′-OH BDE 3 | 2′-OH 4-monoBDE | 500 (320–800) | −30.3 | |
| 3′-OH BDE 7 | 3′-OH 2,4-diBDE | 410 (220–780) | −36.7 | |
| 3′-OH BDE 28 | 3′-OH 2,4,4′-triBDE | 190 (140–250) | −40.3 | |
| 3-OH BDE 47 | 3-OH 2,2′,4,4′-tetraBDE | 60 (40–90) | −37.4 | 0.2a, <LOQ-0.32b |
| 5-OH BDE 47 | 5-OH 2,2′,4,4′-tetraBDE | 400 (240–640) | −35.6 | 3.1a |
| 6-OH BDE 47 | 6-OH 2,2′,4,4′-tetraBDE | 130 (70–230) | −34.0 | 0.6a, 1.4–2.4b, 0.3c |
| 4′-OH BDE 49 | 4′-OH 2,2′,4,5′-tetraBDE | 650 (170–2350) | −43.3 | 0.6a, 0.28–0.96b, 0.2c |
| 4-OH BDE 90 | 4-OH 2,2′,3,4′,5-pentaBDE | 24 (16–38) | −43.6 | <LOQ-0.70b |
| 5′-OH BDE 99 | 5′-OH 2,2′,4,4′,5-pentaBDE | 520 (180–1500) | −34.6 | 3.4a |
| 6′-OH BDE 99 | 6′-OH 2,2′,4,4′,5-pentaBDE | 310 (150–610) | −36.4 | 0.5a |
| 4′-OH BDE 101 | 4′-OH 2,2′,4,5, 5′-pentaBDE | 640 (280–1450) | −45.1 | |
| 3′-OH BDE 154 | 3-OH 2,2′,4,4′,5,6′-hexaBDE | 80 (50–140) | −38.2 | |
| 6-OH BDE 180 | 6-OH 2,2′,3,4,4′,5,5′-heptaBDE | 13500 | −40.9 | |
| 4′-OH BDE 201 | 4′-OH 2,2′,3,3′,4,5′,6,6′-octaBDE | 510 (220–1130) | −46.7 |
Table 2.
IC50 Concentration (nM) for the Inhibition of 3,3′-T2S Formation by Triclosan, halogenated BPAs and 2,4,6-trihalogenated phenols from the Incubation of 1 μM 3,3′-T2 with Human Liver Cytosol.
| Compound Name | IC50 (nM) (95% CI) |
|---|---|
| Triclosan | 1410 |
| BPA-AF | 8590 (5900–12,500) |
| TCBPA | 340 (240–490) |
| TBBPA | 460 (260–800) |
| TIBPA | 13,220 (8200–21,300) |
| 2,4,6-TFP | 4.6 (2.7–7.8) |
| 2,4,6-TCP | 4.3 (3.0–6.1) |
| 2,4,6-TBP | 8.3 (5.7–12) |
| 2,4,6-TIP | 140 (100–190) |
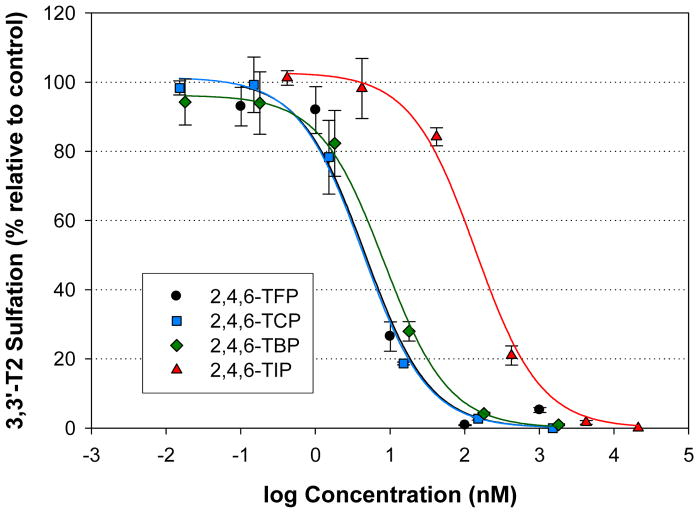
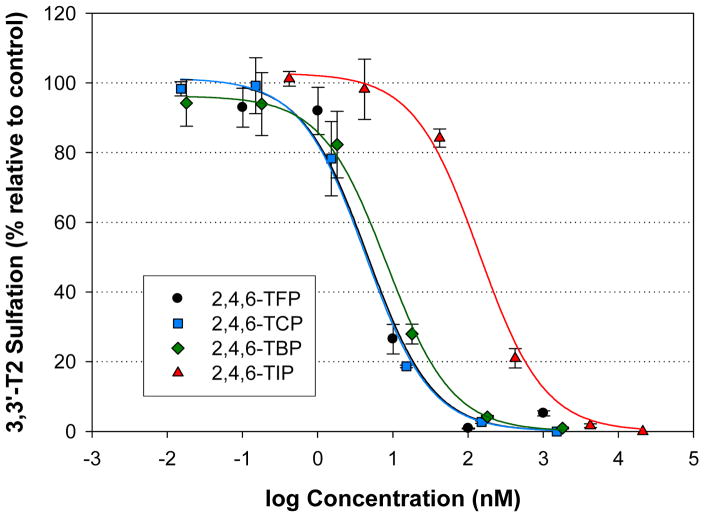
The most potent inhibitors were the 2,4,6-trihalogenated phenols. Among the compounds, the 2,4,6-TFP (IC50 = 4.6 nM), 2,4,6-TCP (4.3 nM) and 2,4,6-TBP (8.3 nM) all showed approximately equal potency with the 2,4,6-TIP (140 nM) showing less potency (140 nM) (Figure 5).
Figure 5.
Inhibition of 3,3′-T2S formation resulting from the incubation of human liver cytosol with 1 uM 3,3′-T2 and various trihalogenated compounds. Data points represent the mean (n=3), error bars represent 1 standard error.
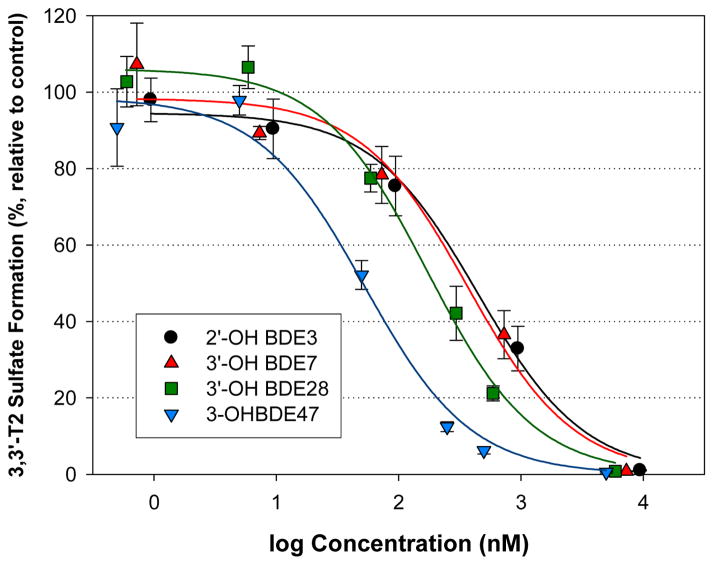
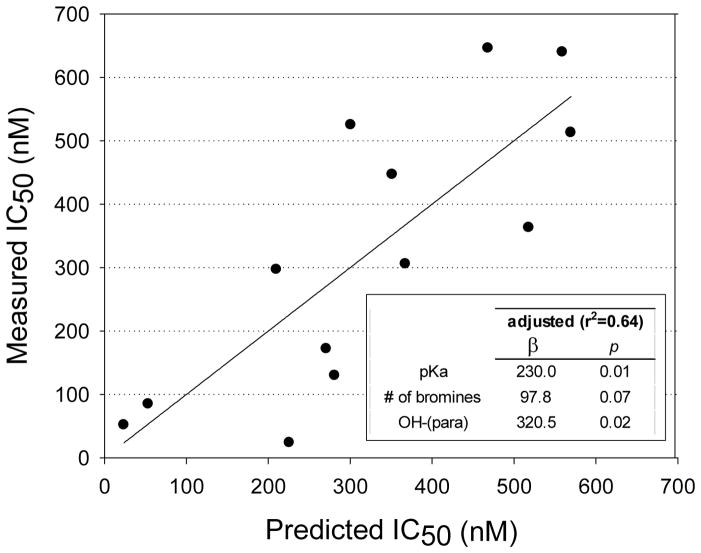
The OH-BDEs were the second most potent group of compounds with IC50 concentrations ranging from the 10s to 100s of nM, with the exception of 6-OH BDE 180 (IC50 = 13,500 nM). However, the IC50 value for 6-OH BDE 180 may be inaccurate since the dose-response curve did not pass through 50% inhibition. Thus, this congener was removed from the data set for the evaluation of structure-activity relationships. Structure-activity trends could be discerned within smaller sets of OH-BDEs. For example, within an analogous group of mono- to tetra-brominated OH-BDEs, the potency increased with increasing number of bromines: 2′-OH BDE 3 (IC50 = 500 nM) < 3′-OH BDE 7 (410 nM) < 3′-OH BDE 28 (190 nM) < 3-OH BDE 47 (60 nM) (Figure 6). Further, within the group of OH-BDE 47 compounds, potency varied by OH-substitution: 3-OH BDE 47 (60 nM) > 6-OH BDE 47 (130 nM) > 5-OH BDE 47 (400 nM). As stated earlier, BDE-47 did not show sulfotransferase inhibition. When considering the entire OH-BDE data set, no trends were obvious (Supporting Information, Figure S3). Notably, the para-OH BDEs were outliers in the IC50 versus number of bromine atoms and the IC50 versus pKa relationships. To adjust for OH-substitution pattern, a multivariate linear regression model was developed using pKa, OH-substitution pattern and number of bromine atoms. Starting with pKa as the predictor, inclusion of OH-substitution resulted in a statistically significant model (r2=0.46, p=0.04). The model was further improved by including the number of bromine atoms as a predictor. Although the pKa and number of bromine atoms are highly correlated, multicollinearity analysis, using the variance inflation factor, showed that the parameters were not impacted. Inclusion of the number of bromine atoms adjacent to the OH-group did not improve the model and thus this parameter was not incorporated. The overall model was: IC50 (nM) = 230*pKa + 97.8*number of bromine atoms + 320*(para-OH) − 1770 (r2=0.64, p=0.02). The experimental measured IC50 versus model predicted IC50 values is shown in Figure 7.
Figure 6.
Inhibition of 3,3′-T2S formation resulting from the incubation of human liver cytosol with 1 uM 3,3′-T2 and mono-, di-, tri- and tetra-OH substituted BDEs. Data points represent the mean (n=3), error bars represent 1 standard error.
Figure 7.
Experimentally measured versus model predicted IC50 concentration using the multivariate linear regression model: IC50 (nM) = 230*pKa + 97.8*number of bromine atoms + 320*(para-OH) − 1770 (r2=0.64, p=0.02). The regression line shows the 1:1 relationship between measure and predicted values.
Similar to the 2,4,6-trihalogenated phenols, the halogenated bisphenol A compounds did not show a clear trend with halogen size. The relative potency was TCBPA (IC50 = 340 nM) ≈ TBBPA (406 nM) > BPA-AF (8590 nM) > TIBPA (13,220 nM) (Figure 8).
Figure 8.
Inhibition of 3,3′-T2S formation resulting from the incubation of human liver cytosol with 1 uM 3,3′-T2 and various halogenated BPA compounds. Data points represent the mean (n=3), error bars represent 1 standard error.
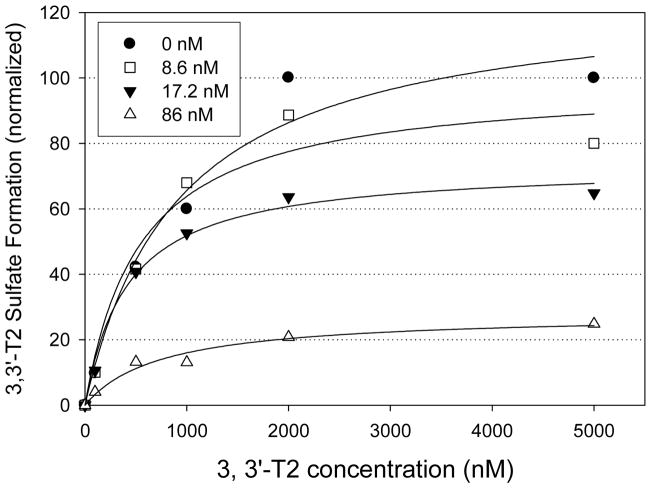
The type of inhibition (competitive vs non-competitive) was investigated by calculating the Michaelis Menten parameters using varying concentrations of 4-OH BDE 90 (Figure 9). The 4-OH BDE 90 was tested because it was the most potent OH-BDE compound in the sulfotransferase inhibition assays. For comparison between 4-OH BDE 90 concentrations, the 3,3′-T2S formation rates were normalized to the rate obtained when 3,3′-T2 = 5000 nM and 4-OH BDE 90. The Vmax rate was statistically lower with increasing 4-OH BDE 90 concentrations, but the apparent Km did not vary with 4-OH BDE 90 concentration. These results suggest that the inhibition mechanism for 4-OH BDE 90 was non-competitive, but it is not known if this is valid for the remaining OH-BDEs.
Figure 9.
3,3′-T2 sulfate formation rate (data points normalized to the formation rate when [S] = 5000 nM, 4-OH BDE 90 = 0 nM) of resulting from incubation of 3,3′-T2 with varying concentrations of 4-OH BDE 90 (0, 8.6, 17.2 and 86 nM) in 0.25 mg protein/ml of pooled human liver cytosol for 30 min. Best fit lines obtained using nonlinear regression analysis. Each data point represents the mean (n=2). Error bars were not shown for clarity.
We also investigated potential sulfation of OH-BDEs to determine if inhibition was reflective of substrate competition. To test this we monitored the concentration of 4-OH-BDE 90 at the beginning and end of the incubation period. If the OH-BDE was being sulfated, the concentration would significantly lower at the end of the incubation period. However, the 4-OH BDE 90 levels remained steady during the 30 min incubation, indicating the 4-OH BDE 90 was not sulfated during our competition experiments. The initial and final 4-OH BDE 90 concentrations were 87 nM (SE = 6.3 nM) and 91 nM (9.1 nM) in one experiment using a dosing level of 86 nM, and 140 nM (10 nM) and 145 nM (6 nM) with a dosing level of 172 nM.
In Silico Sulfotransferase Docking Simulation
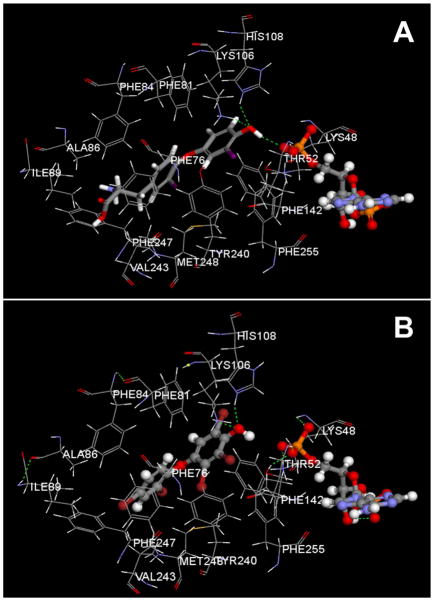
We investigated potential interactions between the OH-BDEs and SULT1A1 using in silico modeling. Docking the 3,3′-T2 with SULT1A1 showed that the molecule was positioned with the OH-group toward the active site, adjacent to the PAP cofactor, forming hydrogen bonds with Lys106 and His108 (Figure 10). All OH-BDEs adopted a “flexed” structure within the binding pocket. All para-substituted OH-BDEs showed similar positioning and hydrogen bonding with both Lys106 and His108. With the exception of the mono-, di- and tri-brominated OH-BDEs, ortho- and metasubstituted OH-BDEs did not form hydrogen bonds with Lys106 and His108. Further, some of the ortho- and meta-substituted OH-BDEs demonstrated non-optimal docking by orienting with the OH-group positioned away from the active site (5-OH BDE 47, 6-OH BDE 47, 6′-OH BDE 99, 6-OH BDE 180).
Figure 10.
SULT1A1 docking with 3,3′-T2 (A) and 4-OH BDE90 (B), and the PAP cofactor. Green dashed lines indicate hydrogen bonds. Gray is carbon, red is oxygen, blue in nitrogen, orange is phosphate, purple is iodine, dark red is bromine and white is hydrogen.
Interaction energies were determined for 3,3′-T2 and the individual OH-BDEs (Table 1). Lower interaction energies were generally associated with increased number of bromines (p<0.05) (Supporting Information, Figure S4). As well, OH-BDEs with para-OH substitutions had lower interaction energies as compared to ortho-OH and meta-OH substitutions (Supporting Information, Figure S4). Further, OH-BDEs with increased number of bromine atoms adjacent to the OH-group showed lower interaction energies, although there was considerable overlap between treatments (Figure S4). Finally, there was a positive relationship with pKa (p<0.01) (Figure S4).
Comparison of Simulated Interaction Energies and Experimental IC50 Concentrations
Overall, there was a significant positive relationship between the calculated interaction energy and experiment IC50 concentrations (r2 = 0.46, p<0.05) (Figure S5). However, three para-OH substituted BDEs did not fit the model (4′-OH BDE 49, 4′-OH BDE 101 and 4′-OH BDE 201). These compounds were less potent (higher IC50 concentrations) than predicted by the model. The 6-OH BDE 180 was excluded from the relationship since the IC50 value may have been inaccurate because the dose-response curve did not pass through 50% inhibition.
Discussion
In our experiments, we used mass spectrometry techniques to monitor the formation of the 3,3′-T2S, using an authentic standard for identification and quantification. As we are aware, this is the first direct measurement of a sulfated thyroid hormone metabolite. Earlier studies quantified TH sulfate formation using radioactivity counting. Mass spectrometry techniques are unambiguous and presumably are superior to radioactivity counting.
Our experiments used human liver cytosol which is known to contain five SULT isozymes that are capable of TH sulfation (e.g. SULT1A1, SULT1A3, SULT 1B1, SULT2A1 and SULT1E1).23 The use of liver cytosol is the strength of our study since it is more representative of actual in vivo conditions, as opposed to the testing of individual SULT isozymes. Assessing TH inhibition in individual SULT isozymes may provide additional mechanistic information, and should be the focus of future research. However, the principal finding of our study is maintained – some HOCs, including metabolites of brominated flame retardants, are potent inhibitors of TH sulfation.
In the absence of competitors, the 3,3′-T2 was readily sulfated. The formation of 3-T1 was not observed, indicating that the 3,3′-T2 was not deiodinated. This was not surprising since the assays were not optimized for DI activity (i.e. there was no dithiothreitol co-factor and we used cytosol instead of microsomes).
The Km value was very similar to that previously reported for human liver cytosol using radiolabeled techniques, but the Vmax value was approximately 2-fold lower.27, 37 The lower Vmax value in the current study may reflect differences in the source of the cytosol, as ours was derived from a pool of multiple donors and therefore may reflect inter-individual variability.
Over the course of these experiments some day to day variability in 3,3′-T2S formation rates were observed. Using the same standard conditions (1 μM 3,3′-T2, 30 min incubation, 0.25 mg protein/ml) in the kinetic experiments (and in the time- and protein-variable experiments), the 3,3′-T2S formation ranged from approximately 70–80 pmol/min.mg protein. Assessment of the inter-day variation showed no statistical differences in activity between days. These results suggest that any difference between activity rates was most likely due to analytical systematic bias.
Here, we investigated the inhibition of thyroid hormone sulfotransferase activity using 3,3′-T2 as the substrate. Previous work has shown that the sulfotransferase inhibition activity towards 3,3′-T2 was similar to that of T3 when using OH-PCBs as the inhibitors.29 These results suggest that 3,3′-T2 can be used as a surrogate to investigate general thyroid hormone sulfotransferase inhibition activity.
The current study expands upon previous research showing that some HOCs inhibit TH sulfation.25–27 But, only one study used human liver cytosol,27 whereas another study used a purified SULT isozyme.26 To our knowledge, TH sulfotransferase inhibition by OH-BDEs has not been previously been reported. However, OH-BDEs were shown to inhibit estradiol sulfotransferase activity in recombinant human SULT1E1.38
Since OH-BDEs are hydroxylated compounds, they are also likely substrates for sulfation. To assess the potential for OH-BDE sulfation, we monitored changes in the concentration of 4-OH BDE 90 during our experiments. The 4-OH BDE 90 concentrations did not decrease during the incubations, indicating that the OH-BDEs were not sulfated under the conditions used in our experiments. The 4-OH BDE 90 was assumed to be representative of the entire suite of OH-BDEs, since it was not practical to assess all of the OH-BDEs individually.
The presence of an OH-group was necessary for 3,3′-T2 sulfotransferase inhibition. For example, BDE 47 did not show inhibition, but all three OH-BDE 47 congeners did inhibit TH sulfation. This trend is consistent with a previous study that did not show inhibition with non-hydroxylated PCBs, but showed inhibition with OH-PCBs.25 Further, the same study showed that BDE 47 and BDE 99 were TH sulfotransferase inhibitors only after incubation with CYP-enriched microsomes.25 Although not specifically monitored, presumably the incubation resulted in the formation of OH-BDE metabolites that were ultimately responsible for the TH sulfotransferase inhibition. Interestingly, incubation of the Bromkal 70-5-DE mixture (primarily pentaBDE congeners) did not result in TH sulfotransferase inhibition.25
It was shown that the para-OH BDEs were outliers in the overall IC50 trends (i.e. in relationships with pKa and number of bromine atoms). Univariate models were not predictors of the IC50 concentrations and thus a multivariate linear regression model was developed to adjust for OH-substitution pattern, number of bromine atoms and pKa. The developed model was a good predictor of the experiment IC50 values and explained 64% of the total variation (Figure 7).
Here we also investigated the influence of halogen substitution by testing fluorinated, chlorinated, brominated and iodinated analogues of 2,4,6-trihalogenated phenol and BPA. As well, triclosan, which is a hydroxylated trichlorinated diphenyl ether, was tested and compared to 3′-OH BDE 28. In general, there were no consistent trends in 3,3′-T2 sulfotransferase inhibition potency. Among the trihalogenated phenols, the fluorinated, chlorinated and brominated analogues showed approximately equal potency but the iodinated analogue was 20 to 40-fold less potent. Interestingly, a previous in vitro study with human liver cytosol also showed that 2,4,6-TIP was a less potent 3,3′-T2 sulfotransferase inhibitor as compared to 2,4,6-TBP.27 Conversely, increasing potency was associated with increasing halogen size (I > Br > Cl > F) of 2,4,6-trihalogenated phenol for estradiol sulfation with recombinant human estrogen sulfotransferase.39 These trends may suggest differing binding pocket characteristics for the various SULT isozymes. Similar to the trihalogenated phenols, the iodinated BPA (TIBPA) was also least potent among the BPA analogues which showed a relative potency of TCBPA ≈ TBBPA > BPA-AF > TIBPA. It should be noted that the BPA-AF is not an identical analogue to the other halogenated BPA compounds; BPA-AF has the halogens on the bridge methyl groups whereas the other BPA compounds have the halogens on the phenol groups. Finally, triclosan was approximately 7-fold less potent than 3′-OH BDE 28 which is the structurally similar brominated analogue.
The compounds investigated in the current study were more potent sulfotransferase inhibitors as compared to deiodinase inhibitors.19 In general, IC50 values for sulfotransferase were in the nM range, but were in the μM range for deiodinase inhibition. These results suggest that sulfotransferase inhibition may be a more sensitive endpoint to monitor for thyroid hormone disruption resulting from HOC exposure. For example, in the current study the trihalogenated phenols had IC50 values between 4–140 nM for sulfotransferase inhibition but T4→T3 deiodinase inhibition IC50 values were between 10–6200 μM. An exception was TIBPA which showed approximately similar potency for sulfotransferase and deiodinase inhibition. These trends may also indicate different binding pocket requirements between the SULT and DI enzymes.
The mechanism of sulfotransferase inhibition was investigated by calculating the Michaelis Menten parameters with varying concentrations of 4-OH BDE 90. The 4-OH BDE 90 was tested because it was identified as the most potent OH-BDE compound in the sulfotransferase inhibition assays. It was assumed that the 4-OH BDE 90 was an appropriate surrogate for the remaining OH-BDEs, but further testing is needed for verification.
The study showed that increasing 4-OH BDE 90 concentrations resulted in decreasing Vmax rates, but the Km concentration did not change, suggesting that the mechanism was through non-competitive inhibition. Using crystallography, it was shown that 4,4′-OH 3,3′,5,5′-chlorobiphenyl binds to the human estrogen sulfotransferase binding pocket, suggesting competitive inhibition.40 Consistent with our in vitro results, non-competitive inhibition was shown for 3-OH benzo(a)pyrene sulfation in human liver cytosol with triclosan as the inhibitor41 and for estradiol sulfonation in recombinant estrogen sulfotransferase with OH-PCBs as the inhibitor.39 Conversely, competitive inhibition was shown for 3,3′-T2 sulfation in rat liver cytosol using 4-OH 2,3,3′,4′,5-CB as the inhibitor.26 Previous studies have shown that there are two binding sites for para-nitrophenol within the SULT binding pocket.42 And it has been postulated that the HOC inhibitor binds to the catalytic site and TH binds to the secondary site, resulting in slower sulfation of the endogenous TH.41
In Silico Sulfotransferase Docking Simulation
The docking simulations used the SULT1A1 binding pocket as the model for our in vitro assays with human liver cytosol. Selection of SULT1A1 was justified by the dominant expression of this isozyme in the liver, as well as the relatively low Km value, as compared to the other SULTs in the liver. As noted earlier, the human liver express five isozymes that are capable of TH sulfation: SULT1A1, SULT1A3, SULT 1B1, SULT2A1 and SULT1E1.23 It was beyond the scope of the current study to quantify the individual SULT expression in our pooled liver cytosol, but previous work, using immunoblotting techniques, showed the human liver SULT profile is dominated by expression of SULT1A1 (53%) followed by SULT2A1 (27%), SULT1B1 (14%) and SULT1E1 (6%).43 The SULT1A3 was not expressed in the liver cytosol. Further, with respect to reaction with 3,3′-T2, the SULT1A1 has the lowest Km value. Specifically, Km values were 0.12 μM for SULT1A1,37 31–35 μM for SULT1A3,37 3.0 for SULT2A144 and 3.5–9.7 μM for SULT1E1.22, 44 The Km value for SULT 1B1 has not been published. Finally, it was shown that 3,3′-T2 sulfation inhibition, by various phenols as the inhibitors, was correlated between human liver cytosol and recombinant SULT1A1.27 This further indicates that the SULT1A1 is an important isozyme for TH sulfation in the human liver.
Although the binding pocket is highly conserved between isozymes, slight differences in the amino acid sequence result in substrate binding specificity.45 Further, the SULT1A1 has been shown to have a very high affinity for 3,3′-T2. As mentioned above, the SULT1A1 has been shown to be the dominant SULT expressed in the human liver, but other SULTs are present. Therefore, our docking simulations may not completely capture the variation in SULT binding that occurs in the liver, or in our pooled human liver cytosol samples.
As determined by crystallography, the binding pocket of SULT1A1 is L-shaped and is comprised of hydrophobic residues (i.e. Phe, Val, Ala, Ile, Tyr, Met).42 The catalytic residues, His108 and Lys106, are positioned near the PAP binding site. For sulfation to occur, the OH-group must be positioned near the sulfur group of the PAPS and adjacent to the histidine residue.45 Consistent with previous in silico modeling,42 our modeling showed that the hydroxyl group on the 3,3′-T2 was positioned within the catalytic site, forming hydrogen bonds with His108 and Lys106.
The simulations also calculated the interaction energy between the SULT1A1 binding pocket and OH-BDEs. Lower interaction energies are associated with higher binding affinities. Our results found that lower interaction energies were associated with the para-substituted OH-BDEs. These compounds showed hydrogen bonding between the OH-group and the catalytic His108 and Lys106 residues, and the OH-group was close to the PAP, similar to that of the endogenous 3,3′-T2. This was expected since the 3,3′-T2 also has a para-substituted OH-group, and thus these OH-BDEs most closely resembled the endogenous ligand. Conversely, the ortho- and meta-substituted OH-BDEs had higher (less negative) interaction energies and did not show hydrogen binding with catalytic residues. Also, the OH-group in most of these compounds was not positioned near the PAP. In addition, higher brominated OH-BDEs were associated with lower interaction energies, consistent with the very hydrophobic architecture of the binding pocket. Increasing the number of bromines adds size and hydrophobic character to the molecule which could result in steric hindrance restrictions in the binding pocket. However, this was not observed in our simulations as the compound with the highest number of bromine atoms (4′OH BDE 201) also had the lowest calculated interaction energy.
In general, there was a positive relationship between the calculated interaction energy and the OH-BDE potency, as determined by the in vitro inhibition experiments (Figure S5). The exceptions were the para-OH substituted BDEs where 3 out of the 4 compounds were less potent than predicted by the IC50-interaction energy relationship. It is not known why these OH-BDEs were outliers and further investigation is warranted. The general agreement between modeled and experimental results is suggestive of a competitive inhibition mechanism which is inconsistent with our experimental results. However, this discussion assumes that the SULT1A1, or a structurally-similar isozyme, was the dominant SULT in the pooled human liver cytosol. Although previous research has shown that the SULT1A1 is the dominant SULT expressed in the human liver, this was unconfirmed in our pooled liver cytosol and thus it may not be possible to draw associations between the modeling and experimental data.
Environmental Significance
The study contributes to an increasing body of literature that demonstrates HOCs may be endocrine disruptors of the thyroid hormone system. Specifically, the study showed that several HOCs – including brominated flame retardants, hydroxylated metabolites of PBDEs, halogenated BPA chemicals and the anti-microbial triclosan – can interfere with thyroid hormone sulfation. The IC50 values calculated here for the halogenated phenols and OH-BDEs were in the low nM range. While it is difficult to directly compare these in vitro measures to in vivo exposure levels, it is worth noting that some of these OH-BDEs have been measured in human serum at levels up to 0.06 nM (lipid normalized levels reported in Table 1), much lower than our IC50 values.9, 46 Further, it is not known how the in vitro IC50 values in our experiments can be extrapolated to in vivo effects. The primary role of TH sulfation appears to be the regulation of biologically active T3. The T4S is not metabolized to T3S via outer-ring deiodination, but forms rT3S via inner-ring deiodination. As well, sulfated THs are more readily deiodinated as compared their non-sulfated analogues, further promoting the formation of inactive THs. Therefore, the in vivo consequence of sulfotransferase inhibition may be to increase amount of circulating, biologically active T3. Relatively high T3S levels have been measured in cord blood, suggesting that TH sulfation is critical for regulating TH levels in the fetus.47 Further, TH sulfotransferase activity has been measured in astrocytes from rat brain tissues.48 Thus, future research should focus on TH sulfotransferase inhibition in these tissues.
Supplementary Material
Acknowledgments
Dr. Kate Hoffman (Duke University) is thanked for assistance with the multivariate linear regression model. Dr. David Minh (formerly Duke University, now Illinois Institute of Technology) is thanked for helpful discussions regarding in silico modeling of OH-BDEs.
Funding
Research funding was provided by the National Institutes of Health (grant number R01 ES016099). Craig M. Butt was partially supported by a post-doctoral fellowship from the Natural Sciences & Engineering Research Council (NSERC) of Canada.
Abbreviations
- HOC
halogenated organic compound
- TH
thyroid hormone
- TSH
thyroid-stimualting hormone
- T4
thyroxine
- T3
triiodothyronine
- TTR
transthyretin
- TBG
thyroxine-binding globulin
- DI
deiodinase
- OH-BDE
hydroxylated polybrominated diphenyl ether
- rT3
3,3′,5′-triiodothyronine
- SULT
cytosolic sulfotransferase
- PAPs
3′-phosphoadenosine-5′-phosphosulfate
- 3,3′-T2
3,3′-diiodothyronine
- OH-PCBs
hydroxylated polychlorinated biphenyl
- PCDD
dibenzo-p-dioxin
- PCDF
dibenzofuran
- LC/MS/MS
liquid chromatography tandem mass spectrometry
- TBBPA
tetrabromobisphenol A
- BPA AF
4,4′-(hexafluoroisopropylidene)diphenol
- 2,4,6-TBP
2,4,6-tribromophenol
- 2,4,6-TFP
2,4,6-trifluorophenol
- 2,4,6-TCP
2,4,6,-trichlorophenol
- 2,4,6-TIP
2,4,6-triiodophenol
- TCBPA
3,3′,5,5′-tetrachlorobisphenol A
- TIBPA
3,3′,5,5′-tetraiodobisphenol A
- 3,3′-T2S
3,3′-T2 sulfate
- SPE
solid phase extraction
- 3′-T1
3-monoiodothyronine
Footnotes
Figures containing chemical structures of inhibitors investigated, 3,3′-T2S formation as a function of time and protein concentration, calculated interaction energy as a function of number of bromines, OH-substitution and number of adjacent bromine atoms, and calculated interaction energy versus experimental IC50 values. This information is available free of charge via the Internet at http://pubs.acs.org/.
References
- 1.Vandenberg LN, Colborn T, Hayes TB, Heindel JJ, Jacobs DR, Lee DH, Shioda T, Soto AM, vom Saal FS, Welshons WV, Zoeller RT, Myers JP. Hormones and Endocrine-Disrupting Chemicals: Low-Dose Effects and Nonmonotonic Dose Responses. Endocr Rev. 2012;33:378–455. doi: 10.1210/er.2011-1050. [DOI] [PMC free article] [PubMed] [Google Scholar]
- 2.Boas M, Feldt-Rasmussen U, Main KM. Thyroid effects of endocrine disrupting chemicals. Mol Cell Endocrinol. 2012;355:240–248. doi: 10.1016/j.mce.2011.09.005. [DOI] [PubMed] [Google Scholar]
- 3.Yen PM. Physiological and molecular basis of thyroid hormone action. Physiol Rev. 2001;81:1097–1142. doi: 10.1152/physrev.2001.81.3.1097. [DOI] [PubMed] [Google Scholar]
- 4.Bianco AC, Salvatore D, Gereben B, Berry MJ, Larsen PR. Biochemistry, cellular and molecular biology, and physiological roles of the iodothyronine selenodeiodinases. Endocr Rev. 2002;23:38–89. doi: 10.1210/edrv.23.1.0455. [DOI] [PubMed] [Google Scholar]
- 5.Johnson PI, Stapleton HM, Mukherjee B, Hauser R, Meeker JD. Associations between brominated flame retardants in house dust and hormone levels in men. Sci Total Environ. 2013;445–446:177–184. doi: 10.1016/j.scitotenv.2012.12.017. [DOI] [PMC free article] [PubMed] [Google Scholar]
- 6.Chevrier J, Harley KG, Bradman A, Gharbi M, Sjodin A, Eskenazi B. Polybrominated Diphenyl Ether (PBDE) Flame Retardants and Thyroid Hormone during Pregnancy. Environ Health Perspect. 2010;118:1444–1449. doi: 10.1289/ehp.1001905. [DOI] [PMC free article] [PubMed] [Google Scholar]
- 7.Turyk ME, Persky VW, Imm P, Knobeloch L, Chatterton R, Anderson HA. Hormone Disruption by PBDEs in Adult Male Sport Fish Consumers. Environ Health Perspect. 2008;116:1635–1641. doi: 10.1289/ehp.11707. [DOI] [PMC free article] [PubMed] [Google Scholar]
- 8.Leijs MM, ten Tusscher GW, Olie K, van Teunenbroek T, van Aalderen WM, de Voogt P, Vulsma T, Bartonova A, von Krauss MK, Mosoiu C, Riojas-Rodriguez H, Calamandrei G, Koppe JG. Thyroid hormone metabolism and environmental chemical exposure. Environ Health. 2012;11:S10. doi: 10.1186/1476-069X-11-S1-S10. [DOI] [PMC free article] [PubMed] [Google Scholar]
- 9.Stapleton HM, Eagle S, Anthopolos R, Wolkin A, Miranda ML. Associations between Polybrominated Diphenyl Ether (PBDE) Flame Retardants, Phenolic Metabolites, and Thyroid Hormones during Pregnancy. Environ Health Perspect. 2011;119:1454–1459. doi: 10.1289/ehp.1003235. [DOI] [PMC free article] [PubMed] [Google Scholar]
- 10.Ellis-Hutchings RG, Cherr GN, Hanna LA, Keen CL. Polybrominated diphenyl ether (PBDE)-induced alterations in vitamin A and thyroid hormone concentrations in the rat during lactation and early postnatal development. Toxicol Appl Pharmacol. 2006;215:135–145. doi: 10.1016/j.taap.2006.02.008. [DOI] [PubMed] [Google Scholar]
- 11.Hallgren S, Sinjari T, Hakansson H, Darnerud PO. Effects of polybrominated diphenyl ethers (PBDEs) and polychlorinated biphenyls (PCBs) on thyroid hormone and vitamin A levels in rats and mice. Arch Toxicol. 2001;75:200–208. doi: 10.1007/s002040000208. [DOI] [PubMed] [Google Scholar]
- 12.Hamers T, Kamstra JH, Sonneveld E, Murk AJ, Kester MHA, Andersson PL, Legler J, Brouwer A. In vitro profiling of the endocrine-distrupting potency of brominated flame retardants. Toxicol Sci. 2006;92:157–173. doi: 10.1093/toxsci/kfj187. [DOI] [PubMed] [Google Scholar]
- 13.Meerts IATM, van Zanden JJ, Luijks EAC, van Leeuwen-Bol I, Marsh G, Jakobsson E, Bergman A, Brouwer A. Potent competitive interactions of some brominated flame retardants and related compounds with human transthyretin in vitro. Toxicol Sci. 2000;56:95–104. doi: 10.1093/toxsci/56.1.95. [DOI] [PubMed] [Google Scholar]
- 14.Marchesini GR, Meimaridou A, Haasnoot W, Meulenberg E, Albertus F, Mizuguchi M, Takeuchi M, Irth H, Murk AJ. Biosensor discovery of thyroxine disrupting chemicals. Toxicol Appl Pharmacol. 2008;232:150–160. doi: 10.1016/j.taap.2008.06.014. [DOI] [PubMed] [Google Scholar]
- 15.Kitamura S, Shinohara S, Iwase E, Sugihara K, Uramaru N, Shigematsu H, Fujimoto N, Ohta S. Affinity for thyroid hormone and estrogen receptors of hydroxylated polybrominated diphenyl ethers. J Health Sci. 2008;54:607–614. [Google Scholar]
- 16.Kojima H, Takeuchi S, Uramaru N, Sugihara K, Yoshida T, Kitamura S. Nuclear hormone receptor activity of polybrominated diphenyl ethers and their hydroxylated and methoxylated metabolites in transactivation assays using chinese ovary cells. Environ Health Perspect. 2009;117:1210–1218. doi: 10.1289/ehp.0900753. [DOI] [PMC free article] [PubMed] [Google Scholar]
- 17.Auf’mkolk M, Koehrle J, Hesch RD, Cody V. Inhibition of rat liver iodothyronine deiodinase: Interaction of aurones with the iodothyronine ligand-binding site. J Biol Chem. 1986;261:11623–11630. [PubMed] [Google Scholar]
- 18.Schmutzler C, Hamann I, Hofmann PJ, Kovacs G, Stemmler L, Mentrup B, Schomburg L, Ambrugger P, Gruters A, Seidlova-Wuttke D, Jarry H, Wuttke W, Kohrle J. Endocrine active compounds affect thyrotropin and thyroid hormone levels in serum as well as endpoints of thyroid hormone action in liver, heart and kidney. Toxicology. 2004;205:95–102. doi: 10.1016/j.tox.2004.06.041. [DOI] [PubMed] [Google Scholar]
- 19.Butt CM, Wang D, Stapleton HM. Halogenated phenolic contaminants inhibit the in vitro activity of the thyroid regulating deiodinases in human liver. Toxicol Sci. 2011;124:339–347. doi: 10.1093/toxsci/kfr117. [DOI] [PMC free article] [PubMed] [Google Scholar]
- 20.Visser TJ. Role of sulfation in thyroid hormone metabolism. Chem Biol Interact. 1994;92:293–303. doi: 10.1016/0009-2797(94)90071-x. [DOI] [PubMed] [Google Scholar]
- 21.Lindsay J, Wang LL, Li Y, Zhou SF. Structure, function and polymorphism of human cytosolic sulfotransferases. Curr Drug Metab. 2008;9:99–105. doi: 10.2174/138920008783571819. [DOI] [PubMed] [Google Scholar]
- 22.Kester MHA, Van Dijk CH, Tibboel D, Hood AM, Rose NJM, Meinl W, Pabel U, Glatt H, Falany CN, Coughtrie MWH, Visser TJ. Sulfation of thyroid hormone by estrogen sulfotransferase. J Clin Endocrinol Metab. 1999;84:2577–2580. doi: 10.1210/jcem.84.7.5975. [DOI] [PubMed] [Google Scholar]
- 23.Wu SY, Green WL, Huang WS, Hays MT, Chopra IJ. Alternate pathways of thyroid hormone metabolism. Thyroid. 2005;15:943–958. doi: 10.1089/thy.2005.15.943. [DOI] [PubMed] [Google Scholar]
- 24.Wang LQ, James MO. Inhibition of sulfotransferases by xenobiotics. Curr Drug Metab. 2006;7:83–104. doi: 10.2174/138920006774832596. [DOI] [PubMed] [Google Scholar]
- 25.Schuur AG, Legger FF, van Meeteren ME, Moonen MJH, van Leeuwen-Bol I, Bergman A, Visser TJ, Brouwer A. In vitro inhibition of thyroid hormone sulfation by hydroxylated metabolites of halogenated aromatic hydrocarbons. Chem Res Toxicol. 1998;11:1075–1081. doi: 10.1021/tx9800046. [DOI] [PubMed] [Google Scholar]
- 26.Schuur AG, van Leeuwen-Bol I, Jong WMC, Bergman A, Coughtrie MWH, Brouwer A, Visser TJ. In vitro inhibition of thyroid hormone sulfation by polychlorobiphenylols: Isozyme specificity and inhibition kinetics. Toxicol Sci. 1998;45:188–194. doi: 10.1006/toxs.1998.2504. [DOI] [PubMed] [Google Scholar]
- 27.Visser TJ, Kaptein E, Glatt H, Bartsch I, Hagen M, Coughtrie MWH. Characterization of thyroid hormone sulfotransferases. Chem-Biol Interact. 1998;109:279–291. doi: 10.1016/s0009-2797(97)00139-7. [DOI] [PubMed] [Google Scholar]
- 28.Szabo DT, Richardson VM, Ross DG, Diliberto JJ, Kodavanti PRS, Birnbaum LS. Effects of Perinatal PBDE Exposure on Hepatic Phase I, Phase II, Phase III, and Deiodinase 1 Gene Expression Involved in Thyroid Hormone Metabolism in Male Rat Pups. Toxicol Sci. 2009;107:27–39. doi: 10.1093/toxsci/kfn230. [DOI] [PMC free article] [PubMed] [Google Scholar]
- 29.Schuur AG, Brouwer A, Bergman A, Coughtrie MWH, Visser TJ. Inhibition of thyroid hormone sulfation by hydroxylated metabolites of polychlorinated biphenyls. Chem-Biol Interact. 1998;109:293–297. doi: 10.1016/s0009-2797(97)00140-3. [DOI] [PubMed] [Google Scholar]
- 30.Wu GS, Robertson DH, Brooks CL, Vieth M. Detailed analysis of grid-based molecular docking: A case study of CDOCKER - A CHARMm-based MD docking algorithm. J Comput Chem. 2003;24:1549–1562. doi: 10.1002/jcc.10306. [DOI] [PubMed] [Google Scholar]
- 31.Vieth M, Hirst JD, Kolinski A, Brooks CL. Assessing energy functions for flexible docking. J Comput Chem. 1998;19:1612–1622. [Google Scholar]
- 32.Mattila K, Renkonen R. Modelling of Bet v 1 Binding to Lipids. Scand J Immunol. 2009;70:116–124. doi: 10.1111/j.1365-3083.2009.02277.x. [DOI] [PubMed] [Google Scholar]
- 33.Koska J, Spassov VZ, Maynard AJ, Yan L, Austin N, Flook PK, Venkatachalam CM. Fully Automated Molecular Mechanics Based Induced Fit Protein-Ligand Docking Method. J Chem Inf Model. 2008;48:1965–1973. doi: 10.1021/ci800081s. [DOI] [PubMed] [Google Scholar]
- 34.Gamage NU, Tsvetanov S, Duggleby RG, McManus ME, Martin JL. The structure of human SULT1A1 crystallized with estradiol - An insight into active site plasticity and substrate inhibition with multi-ring substrates. J Biol Chem. 2005;280:41482–41486. doi: 10.1074/jbc.M508289200. [DOI] [PubMed] [Google Scholar]
- 35.Nelson PR, Wludyka PS, Copeland KAF. The Analysis of Means: A Graphical Method for Comparing Means, Rates, and Proportions. Society for Industrial and Applied Mathematics; Philadelphia: 2005. [Google Scholar]
- 36.Hofstee BHJ. On the evaluation of the constants Vm and KM in enzyme reactions. Science. 1952;116:329–331. doi: 10.1126/science.116.3013.329. [DOI] [PubMed] [Google Scholar]
- 37.Kester MHA, Kaptein E, Roest TJ, van Dijk CH, Tibboel D, Meinl W, Glatt H, Coughtrie MWH, Visser TJ. Characterization of human iodothyronine sulfotransferases. J Clin Endocrinol Metab. 1999;84:1357–1364. doi: 10.1210/jcem.84.4.5590. [DOI] [PubMed] [Google Scholar]
- 38.Hamers T, Kamstra JH, Sonneveld E, Murk AJ, Visser TJ, Van Velzen MJM, Brouwer A, Bergman A. Biotransformation of brominated flame retardants into potentially endocrine-disrupting metabolites, with special attention to 2,2′,4,4′-tetrabromodiphenyl ether (BDE-47) Mol Nutr Food Res. 2008;52:284–298. doi: 10.1002/mnfr.200700104. [DOI] [PubMed] [Google Scholar]
- 39.Kester MHA, Bulduk S, Tibboel D, Meinl W, Glatt H, Falany CN, Coughtrie MWH, Bergman A, Safe SH, Kuiper G, Schuur AG, Brouwer A, Visser TJ. Potent inhibition of estrogen sulfotransferase by hydroxylated PCB metabolites: A novel pathway explaining the estrogenic activity of PCBs. Endocrinology. 2000;141:1897–1900. doi: 10.1210/endo.141.5.7530. [DOI] [PubMed] [Google Scholar]
- 40.Shevtsov S, Petrotchenko EV, Pedersen LC, Negishi M. Crystallographic analysis of a hydroxylated polychlorinated biphenyl (OH-PCB) bound to the catalytic estrogen binding site of human estrogen sulfotransferase. Environ Health Perspect. 2003;111:884–888. doi: 10.1289/ehp.6056. [DOI] [PMC free article] [PubMed] [Google Scholar]
- 41.Wang LQ, Falany CN, James MO. Triclosan as a substrate and inhibitor of 3′-phosphoadenosine-5′-phosphosulfate-sulfotransferase and UDP-glucuronosyl transferase in human liver fractions. Drug Metab Dispos. 2004;32:1162–1169. doi: 10.1124/dmd.104.000273. [DOI] [PubMed] [Google Scholar]
- 42.Gamage NU, Duggleby RG, Barnett AC, Tresillian M, Latham CF, Liyou NE, McManus ME, Martin JL. Structure of a human carcinogen-converting enzyme, SULT1A1 - Structural and kinetic implications of substrate inhibition. J Biol Chem. 2003;278:7655–7662. doi: 10.1074/jbc.M207246200. [DOI] [PubMed] [Google Scholar]
- 43.Riches Z, Stanley EL, Bloomer JC, Coughtrie MWH. Quantitative Evaluation of the Expression and Activity of Five Major Sulfotransferases (SULTs) in Human Tissues: The SULT “Pie”. Drug Metab Dispos. 2009;37:2255–2261. doi: 10.1124/dmd.109.028399. [DOI] [PMC free article] [PubMed] [Google Scholar]
- 44.Li XY, Anderson RJ. Sulfation of iodothyronines by recombinant human liver steroid sulfotransferases. Biochem Biophys Res Commun. 1999;263:632–639. doi: 10.1006/bbrc.1999.1419. [DOI] [PubMed] [Google Scholar]
- 45.Dong D, Ako R, Wu BJ. Crystal structures of human sulfotransferases: insights into the mechanisms of action and substrate selectivity. Expert Opin Drug Metab Toxicol. 2012;8:635–646. doi: 10.1517/17425255.2012.677027. [DOI] [PubMed] [Google Scholar]
- 46.Qiu XH, Bigsby RM, Hites RA. Hydroxylated Metabolites of Polybrominated Diphenyl Ethers in Human Blood Samples from the United States. Environ Health Perspect. 2009;117:93–98. doi: 10.1289/ehp.11660. [DOI] [PMC free article] [PubMed] [Google Scholar]
- 47.Chopra IJ, Wu SY, Teco GNC, Santini F. A radioimmunoassay for measurement of 3,5,3′-triiodothyronine sulfate - studies in thyroidal and nonthyroidal diseases, pregnancy, and neonatal life. J Clin Endocrinol Metab. 1992;75:189–194. doi: 10.1210/jcem.75.1.1619009. [DOI] [PubMed] [Google Scholar]
- 48.Esfandiari A, Gavaret JM, Lennon AM, Pierre M, Courtin F. Sulfation after deiodination of 3,5,3′-triiodothyronine in rat cultured astrocytes. Endocrinology. 1994;135:2086–2092. doi: 10.1210/endo.135.5.7956931. [DOI] [PubMed] [Google Scholar]
- 49.Athanasiadou M, Cuadra SN, Marsh G, Bergman A, Jakobsson K. Polybrominated diphenyl ethers (PBDEs) and bioaccumulative hydroxylated PBDE metabolites in young humans from Managua, Nicaragua. Environ Health Perspect. 2008;116:400–408. doi: 10.1289/ehp.10713. [DOI] [PMC free article] [PubMed] [Google Scholar]
Associated Data
This section collects any data citations, data availability statements, or supplementary materials included in this article.


