
Figure 1. TaqMan end point allelic discrimination plots indicating specificity of two assays across a panel of 83 worldwide diverse isolates (23 from North America).
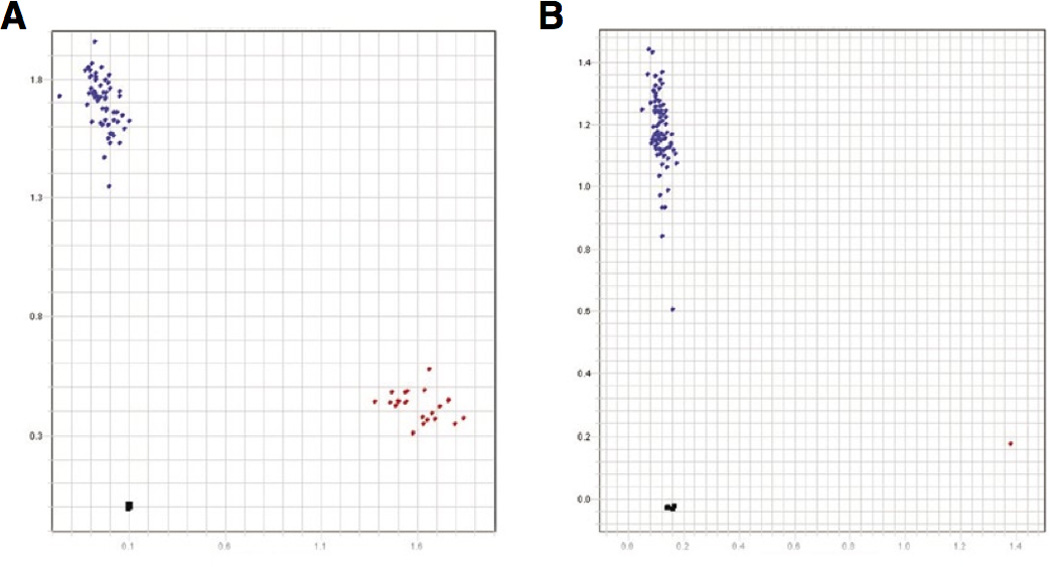
(A) North America (NA)-specific SNP assay. The dots along the x-axis (red) demonstrate the NA-specific allele (n = 23). The dots along the y-axis (blue) demonstrate the alternate allele (n = 60). Samples near the plot origin are negative no-template controls (n = 3). (B) C092-specific SNP assay. The dots along the x-axis (red) demonstrate the CO92-specific allele (n = 1). The dots along the y-axis (blue) demonstrate the alternate allele (n = 82). Samples near the plot origin are negative no-template controls (n = 3).