

Abstract
Background
It is widely accepted that chronic inflammation plays a role in the etiology of colorectal cancer. Using a two-stage design, we examined the associations between colorectal cancer and common variation in 37 key genes in the inflammation and innate immunity pathways.
Methods
In the discovery stage, 2,322 discordant sibships (2,535 cases, 3,915 sibling controls) from the Colorectal Cancer Family Registry were genotyped for over 600 tagSNPs and 99 SNPs were selected for further examination based on strength of association. In the second stage, 351 SNPs tagging gene regions covered by the 99 SNPs were tested in 4,783 Multiethnic Cohort subjects (2,153 cases, 2,630 controls).
Results
The association between rs9858822 in the PPARG gene and colorectal cancer was statistically significant at the end of the second stage (odds ratio per allele = 1.36, Bonferroni-adjusted P = 0.045), based on the “effective” number of markers in Stage 2 (n = 306). The risk allele C was common (frequency 0.3) in African Americans but rare (frequency < 0.03) in whites, Japanese Americans, Latinos and Native Hawaiians. No statistically significant heterogeneity of effects across race/ethnicity, BMI levels, regular aspirin use or pack-years of smoking was detected for this SNP. Suggestive associations were also observed for several SNPs in close vicinity to rs9858822.
Conclusions
Our results provide new evidence of association between PPARG variants and colorectal cancer risk.
Impact
Further replication in independent samples is warranted.
Keywords: pathway approach, inflammation, colorectal cancer, minority population, immunity
Introduction
Chronic inflammation and innate immunity have been strongly implicated in cancer development since Virchow first proposed a connection (1). The elimination of early neoplastic cells through the cytotoxic activity of tumor-infiltrating T cells or intra-epithelial lymphocytes is now a well-established host-defense mechanism against cancer (2, 3). Normal inflammation is an integral part of the immune response to foreign antigens. It is self-limiting and is initiated by pro-inflammatory cytokines and subsequently resolved by anti-inflammatory cytokines (4). Dysregulation of the two types of molecules may lead to chronic inflammation, a consequence of the inability of tissues to remove the irritant (including the initial tumor cells) (2–6). Chronic inflammation is characterized by the infiltration of damaged tissue by immune cells together with tissue destruction and constant attempts to repair (7). The cytokines and chemokines produced in chronic inflammation and chronic immune activation may affect tumor formation at various stages via induction of reactive oxygen species capable of oxidizing DNA, promoting tumor cell proliferation and survival, stimulating angiogenesis, providing the tools and path for tumor cells (as well as for leucocytes) migration, etc. (1).
Colorectal cancer (CRC) is a particularly relevant disease to study the links between inflammation and cancer because of the importance of the immune system in the maintenance of homeostasis in the normal gut and because of its strong associations with inflammatory bowel disease and non-steroidal anti-inflammatory drug use (8). In this study, we tested the hypothesis that common variants in 37 key genes involved in the inflammation and innate immunity pathways may result in predisposition to CRC, by examining associations between disease status and >600 tagSNPs in these genes (as well as 79 additional genetic risk variants with published evidence for association) in two large observational studies in two stages. We performed both single-variant and pathway-based analysis and took into account SNP correlation and gene correlation. Our approach is more comprehensive than past studies that mostly focused on single genes or single polymorphisms ((9–15)). The advantage of our approach over genome-wide association studies is that by utilizing prior biological knowledge, the burden of multiple comparison adjustment is reduced so that the power of identifying genuine but modest effects is enhanced.
MATERIALS AND METHODS
Stage 1 SNP selection, subjects and genotypes
The 37 genes are related to tumor infiltrating and cytotoxic activity, pattern recognition receptors, pro- and anti-inflammatory cytokines and chemokines, the nuclear factor kappa-B pathway and prostaglandin synthesis (Supplementary Table 1). Due to LD structure and proximity between genes, tagSNPs were selected for 34 gene regions (including 5kb upstream and 10kb downstream) with r2 > 0.8 based on HapMap or SeattleSNPs data (all in Europeans). TagSNPs were filtered based on minor allele frequency (MAF) (>0.05) and Illumina design score (>0.4), except that non-synonymous/missense variants were forced into the selection. 79 SNPs in relevant pathways reported to be associated with CRC were also included, bringing the number of selected SNPs to 768.
The first stage was conducted in the Colorectal Cancer Family Registry (CCFR) using a case-unaffected-sibling-control design. The CCFR is a consortium of six family registries in the United States, Australia and Canada that consist of patients and their families who represent the continuum of risk for CRC. Cases, ascertained from population-based cancer registries and family clinics, were probands with a diagnosis of invasive adenocarcinoma of the colon or rectum and controls were siblings with no history of CRC. Data on important covariates were available from risk factor questionnaires of similar format across all sites. Further information can be found elsewhere (16).
A total of 724 SNPs of the 768 SNPs (94%) were successfully genotyped for 7,086 CCFR subjects (all available sibships in CCFR with at least one CRC-discordant pair with available DNA) at the Translational Genomics Research Institute (TGen, Phoenix, AZ) using the Illumina GoldenGate technology. The average concordance rate was 99.8% among replicates. We employed strict quality controls (QC) similar to those in genome-wide association studies (details in Supplementary Data) and included 6,450 subjects (2,355 cases, 4,095 controls) on 616 SNPs for analysis. 537 SNPs can be grouped into 34 gene regions to account for long-range LD structure (see Supplementary Table 1 for gene names and locations), excluding the 79 SNPs with previous evidence of association.
Stage 1 analysis
Conditional logistic regression was used to test for associations between single SNPs (count of minor alleles) and CRC, adjusting for age and gender. Known CRC risk factors (listed in Supplementary Data) did not substantially change OR estimates (<20%) and were not included as covariates. We screened for interactions between SNPs and BMI (quartiles), gender, aspirin use (ever/never taken aspirin ≥ twice per week for > one month) and pack-years of smoking (0, ≤20, >20), and for interactions between SNPs from different gene regions (>1Mb apart) using cross-product terms. Imputation of un-typed SNPs was performed with BEAGLE 3.2 (17) and the Europeans in the 1000 Genomes Project, treating siblings as independent since no imputation program has been designed for sib-ship data. Only SNPs (n=2,305) with R2 > 0.9 were analyzed for main effects using expected allelic dosages. We used arbitrary and liberal p-value thresholds (see Results) for promoting markers with any main or interaction effects for further testing in Stage 2. A SNP-set approach based on Kolmogorov-Smirnov-like running sums of ranked single-SNP χ2 statistics (18) was also implemented to examine the collective effect of all SNPs in a gene (see Supplementary Data). Stage 1 analysis was mainly for discovery; the expectation was that true genetic effects would appear as extreme statistics in some of the tests performed would be followed up in the next stage. SAS (9.2) and R 2.10 were used in data analysis.
Stage 2 SNP selection, subjects and genotypes
The second stage was conducted in the Multiethnic Cohort (MEC) (19). The MEC includes 215,000 men and women aged 45–75 at recruitment, primarily from five racial/ethnic groups (African Americans, Japanese Americans, Latinos, Native Hawaiians and whites) in Hawaii and California (19) (more details in Supplementary Data). Identification of incident CRC cases is through linkage with the Hawaii Tumor Registry, the Los Angeles County Cancer Surveillance Program and the State of California Cancer Registry. Controls were randomly selected from the pool of MEC cancer-free subjects who provided a blood sample and were frequency-matched to cases on age at cohort entry within each ethnic group. A total of 2,237 CRC cases and 2,697 controls from the five groups with available DNA were genotyped.
For the genetic regions covered by the promising variants from Stage 1, plus 5kb up- and 10kb down-stream, tagSNPs were selected to capture common variation (MAF > 0.05) with r2 > 0.9 in the HapMap CEU (Europeans), ASW (African Americans), CHB (Chinese), JPT (Japanese), MKK (Africans) and MEX (Mexicans). A sequential algorithm was used so that tagSNPs selected for a previous population were forced into the subsequent round(s) of selection. We note that genetic variation in Native Hawaiians, which are admixed with Asian, European and Polynesian ancestries, may be less well covered since no Polynesian population is included in any public datasets. A total of 384 tagSNPs were selected and 364 were successfully genotyped by TGen on the Illumina GoldenGate platform. The average concordance rate was 99.5% among replicates pairs. After QC (details in Supplementary Data), genotypes for 351 SNPs and 4,783 subjects (2,630 controls, 2,153 cases) were used in analysis. Principal components (PCs) based on 93 ancestry informative markers (AIMs) that separate major continental ancestries (20) were derived, except for 144 subjects for whom AIMs genotyping was considered to have failed.
Stage 2 analysis
Logistic regression with adjustment for age, gender and racial/ethnic groups was performed to estimate odds ratios (ORs) and 95% confidence intervals (CIs) for each increase in allelic count. Further adjustment for up to 8 PCs in the subset of data with PCs did not change ORs importantly (change <4%), indicating that adjustment for self-reported race was sufficient to control for potential population stratification; ORs in this subset were also similar to those from the full data set. Adjusting additionally for CRC risk factors did not change ORs substantially (change <13%). Thus, these covariates were not considered further in main-effect analyses. Effect modification across race/ethnicity, BMI, regular aspirin use (yes/no), and pack-years of smoking (0, ≤20, >20) was tested with a likelihood ratio test (LRT) comparing models with and without the cross-product interaction terms, with further adjustment for BMI, physical activity (average MET hours), total intake of red meat, pack-years of smoking, aspirin use and daily intake of calcium and folate, where appropriate. Risk factors were grouped based on tertiles unless otherwise specified. Heterogeneity across anatomical sub-sites (left colon, right colon, and rectum) was tested using multinomial logistic regression in SAS. Bonferroni correction was performed to adjust for multiple comparisons at significance level 0.05 (2-sided) based on the number of independent/effective markers estimated by the “Keffective” program (21): for each chromosome, estimates were obtained for each ethnic group then the maximum among all groups was taken; the sum of the maximums across all chromosomes was 306, leading to a single-test significance threshold 1.63×10⁻⁴. Imputation was performed with BEAGLE (3.3) and ethnic specific reference panels from the 1000 Genomes Project: ASN for Japanese Americans, EUR for whites, EUR and AFR for African Americans, ASN and EUR for Native Hawaiians, EUR and AMR for Latinos. Only markers (n=1,541) with R2 > 0.8 in all five groups were kept for analysis. QC and data analysis was performed with PLINK (22) and R (2.13) except otherwise noted. All presented p-values are before Bonferroni correction, unless otherwise specified.
Combining the two stages
When a SNP was available (i.e., was genotyped or passed imputation quality measures) in both stages, a fixed-effect model was applied to combine ORs. I2 was calculated, where I2 > 25% indicates high level of heterogeneity. We used the combined ORs as a supplemental index of the noteworthiness of a risk variant.
Summary effect of non-significant genes in Stage 2
To explore whether genes with no statistically significant single-variant association contributed to CRC risk globally, we first selected the most important SNPs (conditional p-values < 0.05) in these genes with stepwise regression, adjusting for sex and ethnicity (missing values were replaced with mean dosage within sex and ethnic groups to preserve sample size). The sum of the selected “risk” alleles (with OR>1) was then tested for association with disease. The significance of this summary effect was assessed with permutation: disease status was randomly shuffled within ethnicity and sex groups and the above procedures were repeated for each permuted dataset; P-value was the proportion among 4,000 permutated datasets for which the LRT statistics for the sum of the selected “risk” alleles were greater than that observed in the original data.
RESULTS
Stage 1
The 2,322 discordant sibships from CCFR (n = 6,450) were of sizes 2 (54%), 3 (26%), 4 (12%), 5 (5%) and 6 to 13 (3%) and most (83%) were of European descent. The proportion of men was 51.0% in cases and 44.6% in controls. Cases (mean = 55.1, SD =11.3) and controls (mean = 53.8, SD = 11.8) were similar in age distribution. 1,535 sibships included only colon cancer cases, 720 only rectal cancer and 67 both colon and rectal cancers. From available parental information, 2 pairs of sibships (9 subjects) were related as half-sibs, and 44 parents and their siblings (total 124 subjects) were also present. Sensitivity analysis showed that excluding the 133 subjects that complicated the sibship structure did not materially alter the results. Model convergence was questionable for 15 SNPs among 616 analyzed SNPs due to sparse data so results were available for 601 markers. We used the following criteria to promote 99 markers for further examination: 1) P <0.1 for genotyped markers (n=49) or < 0.05 for imputed markers (n=31) in the main-effect analysis; 2) P < 0.001 for interactions between SNPs and risk factors (n=5); 3) P < 0.0001 for interaction tests between SNP pairs from different gene regions (n=14). These SNPs were distributed on 15 chromosomes (see Supplementary Table 2 for markers and genes, Supplementary Table 3 for main-effect association results). The SNP-set based analysis did not reveal more genes/regions of interest, as only two gene-specific p-values were < 0.05 (p=0.0024 and 0.01, respectively, for IL10 and PTGIS) and both had been included for follow-up based on single-variant analysis (Supplementary Table 3).
Stage 2
The main characteristics of the 4,783 MEC subjects (2,630 controls, 2,153 cases) are shown in Table 1. There were 480 rectal, 910 right colon and 565 left colon cancer cases (counts are mutually exclusive). We found one genotyped SNP, rs9858822 in the second intron of PPARG on Chr 3, to be statistically significantly associated with CRC (Bonferroni-adjusted P = 0.045, raw P = 1.48×10⁻⁴) (Table 2). The OR for each copy of allele C was 1.36 and the genotypic ORs for AC and CC, vs. AA, were 1.24 (95% CI: 0.99–1.56) and 2.03 (95% CI: 1.42–2.89), respectively. A log-additive genetic model was preferable based on the Bayesian Information Criterion, compared to dominant, recessive or co-dominant models. The C allele was common (MAF = 0.35) in African Americans but was relatively rare (MAF ≤ 0.03) in the other 4 ethnic/racial groups, consistent with the HapMap data. As a result, the observed association was mainly driven by the African Americans where the OR per C allele was 1.36 (P = 4.9×10⁻⁴), whereas in the other four groups combined the OR was 1.19 (P = 0.53). This effect was not confounded by known CRC risk factors (further adjustment resulted in <5% change in OR) or differed across ethnicity/race (Pinteraction = 0.99, perhaps owing to the sparse data in some ethnic groups). Similarly, there did not seem to be important effect modification by pack-years of smoking, BMI or regular aspirin use (raw Pinteraction ≥ 0.08). For example, the OR (95% CI) for allele C was 1.28 (0.97 – 1.70) among regular aspirin users (n=1,544) and 1.38 (1.08 – 1.76) among non-users (n=2,517), with adjustment of other risk factors. Since rs9858822 was not genotyped or successfully imputed in Stage 1 (as expected, given its low frequency in Europeans), no OR for the combined studies was available.
Table 1.
Main characteristics of 4,783 subjects by ethnicity in the Multiethnic Cohort
| Ethnicity/Race
|
||||||
|---|---|---|---|---|---|---|
| AA | NH | JA | LA | EA | ||
| N (% male) | Cases | 443 (45.2) | 114 (58.8) | 725 (58.9) | 489 (59.5) | 382 (51.1) |
| Controls | 824 (72.7) | 177 (40.7) | 799 (46.6) | 414 (60.6) | 416 (52.4) | |
| Mean age (SD) | Cases | 63.5 (8.1) | 58.8 (8.2) | 62.6 (8.4) | 62.3 (7.2) | 62.6 (8.2) |
| Controls | 62.9 (7.6) | 56.6 (6.9) | 60.3 (8.3) | 60.5 (6.6) | 60.0 (8.0) | |
| Mean BMI (SD) | Cases | 28.7 (5.0) | 30.0 (5.2) | 25.2 (4.0) | 27.9 (4.5) | 26.8 (4.6) |
| Controls | 27.8 (4.8) | 28.9 (5.5) | 24.6 (3.5) | 27.6 (4.3) | 26.2 (4.9) | |
| Pack-years of smoking * | Cases | 3.9 (14.2) | 7.1 (27.5) | 2.9 (19.8) | 1.3 (12.0) | 8.3 (31.8) |
| Controls | 6.2 (19.8) | 6.2 (19.8) | 0 (12.0) | 1.3 (10.3) | 2.0 (19.8) | |
| % Aspirin use # | Cases | 44.6 | 44.6 | 27.8 | 43.9 | 48.1 |
| Controls | 47.4 | 27.5 | 25.8 | 41.2 | 49.6 | |
EA: European Americans; AA: African Americans; JA: Japanese Americans; LA: Latinos; NH: Native Hawaiians
Data are median (upper quartile). Lower quartiles are all zero.
Ever used aspirin at least twice per week consecutively for more than a month
Table 2.
Association between colorectal cancer and rs9858822 in the Multiethnic Cohort
| SNP | Chr | BP (HG19) | Minor/Major | Group | Cases/Controls | MAF1 (controls) | MAF (cases) | OR2 (95% CI) | P3 |
|---|---|---|---|---|---|---|---|---|---|
| rs9858822 | 3 | 12411238 | C/A | All | 2152/2630 | 1.36 (1.16, 1.60) | 1.5×10⁻⁴ | ||
| LA | 489/414 | 0.027 | 0.034 | 1.26 (0.72, 2.20) | 0.42 | ||||
| JA | 725/799 | 0 | 0 | na | na | ||||
| AA | 443/824 | 0.31 | 0.39 | 1.36 (1.15, 1.62) | 0.0005 | ||||
| EA | 381/416 | 0.0036 | 0.0013 | 0.31 (0.03, 3.05) | 0.32 | ||||
| NH | 114/177 | 0.0028 | 0.0044 | 2.65 (0.16, 44.7) | 0.50 |
EA: European Americans; AA: African Americans; JA: Japanese Americans; LA: Latinos; NH: Native Hawaiians.
MAF: minor allele frequency
OR for the minor allele
P-values were from log-additive models, adjusted for age, gender and racial/ethnic groups. No heterogeneity across ethnic groups was detected (Phet > 0.3)
The PPARG gene maps to 12,329,348 – 12,475,854 at 3p25.2 and SNPs in our data were located from 12,330,730 to 12,479,552. LD structure for PPARG is complex and LD blocks are difficult to define in the 1000 Genomes data (Supplementary Figures 1 to 3 for LD in Europeans, Africans and East Asians in the 1000 Genomes Project). A few other SNPs located nearby in the PPARG region showed suggestive associations in Stage 2 (Figure 1), even though none passed the stringent Bonferroni adjustment. For example, the raw p-value for rs4135304 (12,394,601 bp) and rs6778740 (12,398,636 bp) was 2.9×10⁻⁴ and 2.5×10⁻⁴, respectively, and these SNPs were in high LD (r2 = 0.78 and 0.93) with rs9858822 in African Americans. Logistic regression of all variants in PPARG conditional on rs9858822 did not reveal better candidate markers.
Figure 1.
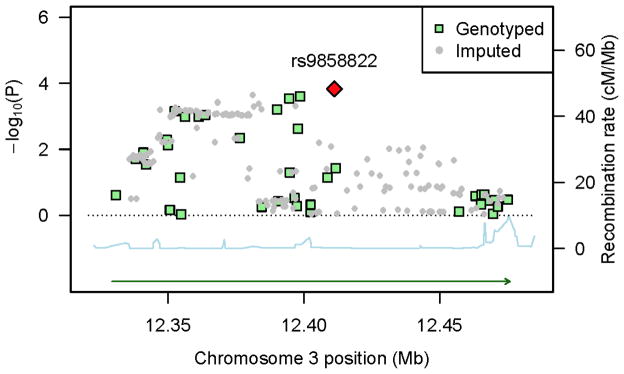
P-values in the Multiethnic Cohort for genotyped and imputed in the PPARG region as a function of genetic position (HG19), along with recombination rates (combined rates from HapMap) that reflect local LD structure. The top hit SNP is shown as a red diamond. SNP density is not ideal at some region because only SNPs with high imputation accuracy (R2 > 0.8) in ALL five ethnic groups were analyzed and R2 can vary a lot due to differences in allele frequencies and linkage disequilibrium patterns across populations.
Rs9858822 lies in close proximity to a H3K4me1 ChIP-seq peak in the colon cancer cell line HCT-116 (ENCODE, Stanford/Yale/USC/Harvard) (23). This histone modification is a mark of a putative enhancer element. A few SNPs in high LD (r2 ≥ 0.69, |D′|=1) with rs9858822 in the HapMap ASW (African Americans) are located within the putative enhancer elements, such as rs9812856 (12,404,491), rs4135343 (12,447,964) and rs4135346 (12,448,498). Notably, rs4135343 is found at the 3′ end of a shorter PPARG splice variant, in both H3K4me1 and H3K27ac ChIP-seq peaks, and directly downstream of many transcription factor ChIP- seq signals (ENCODE, HAIB). These SNPs were imputed with R2 > 0.91 only in African Americans in Stage 2 and were not analyzed in other ethnic groups or in Stage 1. The p-values of association were 0.0002, 0.0014 and 0.0015, respectively, for the three variants in African Americans.
Rs1801282 (Pro12Ala, C/G) in PPARG has been inconsistently associated with CRC in past studies. In our data, it was genotyped in Stage 1 and was imputed in Stage 2 with R2 ≥ 0.8 in all ethnic groups. However, the SNP was not associated with CRC in either stage, or when the two studies were combined (all P’s > 0.4, Supplementary Table 5). In Stage 2, no important association was observed in subsite-specific analyses (colon or rectum), or when adjusted for BMI and diabetes status, or when stratified by ethnicity (all P’s > 0.05, Supplementary Table 5).
Overall, we did not detect important interaction effects between SNPs and ethnicity or known risk factors (BMI, pack-years of smoking or aspirin use) after multiple comparison adjustment (Pinteraction’s ≥ 0.0003). Similarly, no strong heterogeneity by anatomical location of the tumor was observed (Pheterogeneity’s > 0.005). All 31 SNPs with P < 0.05 in Stage 2 main-effect analysis are shown in Supplementary Materials. Results from imputed SNPs were similar to those from genotyped ones.
Summary effect of non-significant genes in Stage 2
Among the 313 SNPs in genes other than PPARG where no variant was statistically significantly associated with CRC, stepwise regression selected 12 SNPs with conditional p-values < 0.05. The sum of the selected “risk” alleles (with OR>1) seemed associated with CRC (χ2 = 63.3, P = 1.8 ×10⁻¹⁵). However, this effect was statistically non-significant from permutation analysis (P = 0.26), when the so-called “winner’s curse” was corrected for.
DISCUSSION
Using a discovery and a validation step, both conducted in large and well-annotated studies, we examined associations between colorectal cancer and common variation in 37 key genes involved in the inflammation and immunity pathways. At the end of the validation step, only one SNP in the second intron of PPARG, rs9858822 (12,411,238 on Chr 3), showed statistically significant association after stringent Bonferroni-type multiple comparison adjustment. This SNP is common (MAF 0.3) in African Americans, a population at high risk for CRC, but rare in Europeans, Hispanics, East Asians and Native Hawaiians (MAF < 0.03).
PPARG encodes a nuclear transcription factor, PPARγ, that regulates target gene expression upon ligand activation and through interaction with transcription co-factors. Natural ligands for PPARγ include fatty acids and their derivatives. PPARγ has a predominant role in lipid metabolism and adipocyte differentiation, as well as in maintaining glucose homeostasis and insulin sensitivity, and in inflammation. PPARγ proteins are expressed in a broad range of tissues including heart, skeletal muscle, small and large intestines, kidney, etc., depending on the isoforms (24–26). Some links have been demonstrated between PPARγ and colorectal tumor growth or differentiation, although the exact mechanism remains unclear (27–31). PPARγ and its ligands have been shown to block pro-inflammatory genes in activated macrophages, monocytes and colon cancer cell lines by inhibiting the nuclear factor kappa-B (a master regulator of inflammatory processes), AP-1 and STAT pathways (32–34). There is growing evidence that obesity/Type 2 diabetes, inflammation and cancer (in particular CRC) are etiologically related (35, 36). Being at the crossroads of all these processes, PPARγ may be a key element to understanding the pathophysiology of CRC.
The association of rs9858822 with CRC has not been reported before, probably owing to its low frequency in non-African descent populations. Because of the extended and complex LD structure in the PPARG region, we view this signal as an indication that the neighboring PPARG region may contain causal risk variants for CRC, possibly representing an ethnic-specific susceptibility locus in African Americans only. This signal is unlikely a chance finding given the supporting evidence (small p-values) from neighboring SNPs (Figure 1).
The Pro12Ala polymorphism (rs1801282), the most studied PPARG variant to date, has been consistently associated with Type 2 diabetes (37, 38). It has also been linked to CRC risk, but inconsistently so. For example, a reduced risk was reported in a Spanish (12), a Greek (39) and a Singapore-Chinese study (11); however, no effect was observed in several other studies in the U.S. or among West Asians (13, 15, 40–42). Owing to the various designs and study populations, it is hard to reconcile these past studies. As discussed before, technical artifact during genotyping and the presence of multiple genetic ancestries within individual studies (population stratification) (43) may not have been carefully controlled in earlier candidate gene studies. We did not observe any statistically significant association between Pro12Ala and CRC in our data, consistent with a recent systematic review of colorectal cancer and genetic polymorphisms (44) that examined 15 SNPs in the inflammation pathways, including two in PPARG, rs3856806 (C1431T) and rs1801282 (Pro12Ala). With more than 15,000 cases and 15,000 controls, rs1801282 was not associated with CRC (P-values > 0.35 for both heterozygous and homozygous genotypes) (44); neither was rs3856806.
The strengths of our study include a comprehensive SNP tagging approach to capture common genetic variation in key genes in the inflammation and immunity pathways, rigorous genotype quality control procedures, large sample sizes in both stages, a replication in a multi-ethnic population where ethnic-specific risk can be examined, the ability to control for a variety of environmental risk factors and to examine gene-environment interactions, and a strict multiple comparison adjustment approach. The value of conducting association studies in multiethnic populations is evident from our result for rs9858822. Given its low frequency in European-descent populations, the association with CRC (if confirmed) could not have been easily detected if not tested in African Americans. The use of Bonferroni correction based on the number of independent/effective markers estimated from Keffective (21) has been shown to be conservative (45). This was especially so in our analysis because we used the maximum estimate across five ethnic groups as the number of independent/effective markers for each chromosome.
The limitations of our study include treating sibs in Stage 1 (in CCFR) as independent subjects during imputation. To reduce the possibility of bias caused by this un-met assumption, we restricted analysis to those markers imputed with a high R2 (> 0.9), which eliminated many imputed markers from Stage 1 and prohibited us from combining the results from both studies for these SNPs. However, this issue is not relevant to our findings with rs9858822, because this variant is rare in whites and could not have been reliably imputed even if the discovery phase had been conducted in unrelated subjects. Other limitations included that some interactions may have been missed due to insufficient power and/or model misspecification.
In summary, our findings from two large studies with different designs and populations suggest that a new region in PPARG tagged by rs9858822 may constitute a susceptibility locus for CRC. Replication in independent samples, especially in African Americans, is warranted. In addition, a summary effect for the other studied genes (excluding PPARG) in the inflammation and innate immunity pathways was not important, indicating little effects of common variants in these genes with respect to colorectal cancer risk.
Supplementary Material
Acknowledgments
Grant Support
This study was funded by the National Institutes of Health grant R01 CA129063. The MEC study is funded by the National Institutes of Health grants UM1 CA164973, R37 CA54281, P01 CA33619, R01 CA63464, and U01 CA98758, and U01 CA136792. The CCFR study is funded by the National Institutes of Health grant U01CA097735 (Australasian Colorectal Cancer Family Registry), U01 CA074799 (Familial Colorectal Neoplasia Collaborative Group [USC]), U01 CA074800 (Mayo Clinic Cooperative Family Registry for Colon Cancer Studies), U01 CA074783 (Ontario Registry for Studies of Familial Colorectal Cancer), U01 CA074794 (Seattle Colorectal Cancer Family Registry), U01 CA074806 (University of Hawaii Colorectal Cancer Family Registry). The sponsoring agency played no role in study design and in collection, analysis, and interpretation of data.
Footnotes
Conflicts of interest: None declared.
Author Contributions: Study concept and design: Loïc Le Marchand, David Duggan, Cornelia M. Ulrich, Darin Taverna. Acquisition of data: Loïc Le Marchand, Terrilea Burnett, Noralane Lindor, John L. Hopper, Steven Gallinger, John A. Baron, Robert Haile, Polly Newcomb, Laurence N. Kolonel, Brian E. Henderson. Analysis and interpretation of data: Hansong Wang, Daniel O. Stram, Loïc Le Marchand. Drafting of manuscript: Hansong Wang, Loïc Le Marchand. Critical revision of the manuscript for important intellectual content: All. Obtained funding: Loic Le Marchand. Administrative support: Loic Le Marchand, Polly Newcomb, David Duggan, Cornelia M. Ulrich.
References
- 1.Balkwill F, Mantovani A. Inflammation and cancer: back to Virchow? Lancet. 2001;357:539–45. doi: 10.1016/S0140-6736(00)04046-0. [DOI] [PubMed] [Google Scholar]
- 2.Imai K, Matsuyama S, Miyake S, Suga K, Nakachi K. Natural cytotoxic activity of peripheral-blood lymphocytes and cancer incidence: an 11-year follow-up study of a general population. Lancet. 2000;356:1795–9. doi: 10.1016/S0140-6736(00)03231-1. [DOI] [PubMed] [Google Scholar]
- 3.Shankaran V, Ikeda H, Bruce AT, White JM, Swanson PE, Old LJ, et al. IFNgamma and lymphocytes prevent primary tumour development and shape tumour immunogenicity. Nature. 2001;410:1107–11. doi: 10.1038/35074122. [DOI] [PubMed] [Google Scholar]
- 4.Dvorak HF. Tumors: wounds that do not heal. Similarities between tumor stroma generation and wound healing. N Engl J Med. 1986;315:1650–9. doi: 10.1056/NEJM198612253152606. [DOI] [PubMed] [Google Scholar]
- 5.Burnet FM. The concept of immunological surveillance. Prog Exp Tumor Res. 1970;13:1–27. doi: 10.1159/000386035. [DOI] [PubMed] [Google Scholar]
- 6.Herberman RB, Ortaldo JR. Natural killer cells: their roles in defenses against disease. Science. 1981;214:24–30. doi: 10.1126/science.7025208. [DOI] [PubMed] [Google Scholar]
- 7.Macarthur M, Hold GL, El-Omar EM. Inflammation and Cancer II. Role of chronic inflammation and cytokine gene polymorphisms in the pathogenesis of gastrointestinal malignancy. Am J Physiol Gastrointest Liver Physiol. 2004;286:G515–20. doi: 10.1152/ajpgi.00475.2003. [DOI] [PubMed] [Google Scholar]
- 8.Ulrich CM, Bigler J, Potter JD. Non-steroidal anti-inflammatory drugs for cancer prevention: promise, perils and pharmacogenetics. Nat Rev Cancer. 2006;6:130–40. doi: 10.1038/nrc1801. [DOI] [PubMed] [Google Scholar]
- 9.Cacev T, Radosevic S, Krizanac S, Kapitanovic S. Influence of interleukin-8 and interleukin-10 on sporadic colon cancer development and progression. Carcinogenesis. 2008;29:1572–80. doi: 10.1093/carcin/bgn164. [DOI] [PubMed] [Google Scholar]
- 10.Castro FA, Forsti A, Buch S, Kalthoff H, Krauss C, Bauer M, et al. TLR-3 polymorphism is an independent prognostic marker for stage II colorectal cancer. Eur J Cancer. 2011;47:1203–10. doi: 10.1016/j.ejca.2010.12.011. [DOI] [PubMed] [Google Scholar]
- 11.Koh WP, Yuan JM, Van Den Berg D, Ingles SA, Yu MC. Peroxisome proliferator-activated receptor (PPAR) gamma gene polymorphisms and colorectal cancer risk among Chinese in Singapore. Carcinogenesis. 2006;27:1797–802. doi: 10.1093/carcin/bgl001. [DOI] [PubMed] [Google Scholar]
- 12.Landi S, Moreno V, Gioia-Patricola L, Guino E, Navarro M, de Oca J, et al. Association of common polymorphisms in inflammatory genes interleukin (IL)6, IL8, tumor necrosis factor alpha, NFKB1, and peroxisome proliferator-activated receptor gamma with colorectal cancer. Cancer Res. 2003;63:3560–6. [PubMed] [Google Scholar]
- 13.Slattery ML, Murtaugh MA, Sweeney C, Ma KN, Potter JD, Caan BJ, et al. PPARgamma, energy balance, and associations with colon and rectal cancer. Nutr Cancer. 2005;51:155–61. doi: 10.1207/s15327914nc5102_5. [DOI] [PubMed] [Google Scholar]
- 14.Suchy J, Klujszo-Grabowska E, Kladny J, Cybulski C, Wokolorczyk D, Szymanska-Pasternak J, et al. Inflammatory response gene polymorphisms and their relationship with colorectal cancer risk. BMC Cancer. 2008;8:112. doi: 10.1186/1471-2407-8-112. [DOI] [PMC free article] [PubMed] [Google Scholar]
- 15.Tsilidis KK, Helzlsouer KJ, Smith MW, Grinberg V, Hoffman-Bolton J, Clipp SL, et al. Association of common polymorphisms in IL10, and in other genes related to inflammatory response and obesity with colorectal cancer. Cancer Causes Control. 2009;20:1739–51. doi: 10.1007/s10552-009-9427-7. [DOI] [PMC free article] [PubMed] [Google Scholar]
- 16.Newcomb PA, Baron J, Cotterchio M, Gallinger S, Grove J, Haile R, et al. Colon Cancer Family Registry: an international resource for studies of the genetic epidemiology of colon cancer. Cancer Epidemiol Biomarkers Prev. 2007;16:2331–43. doi: 10.1158/1055-9965.EPI-07-0648. [DOI] [PubMed] [Google Scholar]
- 17.Browning SR, Browning BL. Rapid and accurate haplotype phasing and missing data inference for whole genome association studies using localized haplotype clustering. Am J Hum Genet. 2007;81:1084–97. doi: 10.1086/521987. [DOI] [PMC free article] [PubMed] [Google Scholar]
- 18.Wang K, Li M, Bucan M. Pathway-Based Approaches for Analysis of Genomewide Association Studies. Am J Hum Genet. 2007;81:1278–83. doi: 10.1086/522374. [DOI] [PMC free article] [PubMed] [Google Scholar]
- 19.Kolonel LN, Henderson BE, Hankin JH, Nomura AM, Wilkens LR, Pike MC, et al. A multiethnic cohort in Hawaii and Los Angeles: baseline characteristics. Am J Epidemiol. 2000;151:346–57. doi: 10.1093/oxfordjournals.aje.a010213. [DOI] [PMC free article] [PubMed] [Google Scholar]
- 20.Kosoy R, Nassir R, Tian C, White PA, Butler LM, Silva G, et al. Ancestry informative marker sets for determining continental origin and admixture proportions in common populations in America. Hum Mutat. 2009;30:69–78. doi: 10.1002/humu.20822. [DOI] [PMC free article] [PubMed] [Google Scholar]
- 21.Moskvina V, Schmidt KM. On Multiple-Testing Correction in Genome-Wide Association Studies. Genet Epidemiol. 2008;32:567–73. doi: 10.1002/gepi.20331. [DOI] [PubMed] [Google Scholar]
- 22.Purcell S, Neale B, Todd-Brown K, Thomas L, Ferreira MA, Bender D, et al. PLINK: a tool set for whole-genome association and population-based linkage analyses. Am J Hum Genet. 2007;81:559–75. doi: 10.1086/519795. [DOI] [PMC free article] [PubMed] [Google Scholar]
- 23.The ENCODE Consortium Porject. A user’s guide to the encyclopedia of DNA elements (ENCODE) PLoS Biol. 2011;9:e1001046. doi: 10.1371/journal.pbio.1001046. [DOI] [PMC free article] [PubMed] [Google Scholar]
- 24.Berger J, Moller DE. The mechanisms of action of PPARs. Ann Rev Med. 2002;53:409–35. doi: 10.1146/annurev.med.53.082901.104018. [DOI] [PubMed] [Google Scholar]
- 25.Fajas L, Auboeuf D, Raspe E, Schoonjans K, Lefebvre A-M, Saladin R, et al. The Organization, Promoter Analysis, and Expression of the Human PPARgamma Gene. J Biol Chem. 1997;272:18779–89. doi: 10.1074/jbc.272.30.18779. [DOI] [PubMed] [Google Scholar]
- 26.Fajas L, Fruchart J-C, Auwerx J. PPARgamma3 mRNA: a distinct PPARgamma mRNA subtype transcribed from an independent promoter. FEBS Letters. 1998;438:55–60. doi: 10.1016/s0014-5793(98)01273-3. [DOI] [PubMed] [Google Scholar]
- 27.DuBois RN, Gupta R, Brockman J, Reddy BS, Krakow SL, Lazar MA. The nuclear eicosanoid receptor, PPARgamma, is aberrantly expressed in colonic cancers. Carcinogenesis. 1998;19:49–53. doi: 10.1093/carcin/19.1.49. [DOI] [PubMed] [Google Scholar]
- 28.Sarraf P, Mueller E, Jones D, King FJ, DeAngelo DJ, Partridge JB, et al. Differentiation and reversal of malignant changes in colon cancer through PPARgamma. Nat Med. 1998;4:1046–52. doi: 10.1038/2030. [DOI] [PubMed] [Google Scholar]
- 29.Sarraf P, Mueller E, Smith WM, Wright HM, Kum JB, Aaltonen LA, et al. Loss-of-function mutations in PPAR gamma associated with human colon cancer. Mol Cell. 1999;3:799–804. doi: 10.1016/s1097-2765(01)80012-5. [DOI] [PubMed] [Google Scholar]
- 30.Saez E, Tontonoz P, Nelson MC, Alvarez JG, Ming UT, Baird SM, et al. Activators of the nuclear receptor PPARgamma enhance colon polyp formation. Nat Med. 1998;4:1058–61. doi: 10.1038/2042. [DOI] [PubMed] [Google Scholar]
- 31.Lefebvre AM, Chen I, Desreumaux P, Najib J, Fruchart JC, Geboes K, et al. Activation of the peroxisome proliferator-activated receptor gamma promotes the development of colon tumors in C57BL/6J-APCMin/+ mice. Nat Med. 1998;4:1053–7. doi: 10.1038/2036. [DOI] [PubMed] [Google Scholar]
- 32.Jiang C, Ting AT, Seed B. PPAR-[gamma] agonists inhibit production of monocyte inflammatory cytokines. Nature. 1998;391:82–6. doi: 10.1038/34184. [DOI] [PubMed] [Google Scholar]
- 33.Ricote M, Li AC, Willson TM, Kelly CJ, Glass CK. The peroxisome proliferator-activated receptor-gamma is a negative regulator of macrophage activation. Nature. 1998;391:79–82. doi: 10.1038/34178. [DOI] [PubMed] [Google Scholar]
- 34.Su CG, Wen X, Bailey ST, Jiang W, Rangwala SM, Keilbaugh SA, et al. A novel therapy for colitis utilizing PPAR-gamma ligands to inhibit the epithelial inflammatory response. J Clin Invest. 1999;104:383–9. doi: 10.1172/JCI7145. [DOI] [PMC free article] [PubMed] [Google Scholar]
- 35.Brower V. Illuminating the diabetes-cancer link. J Natl Cancer Inst. 2012;104:1048–50. doi: 10.1093/jnci/djs322. [DOI] [PubMed] [Google Scholar]
- 36.Wang D, Dubois RN. Associations between obesity and cancer: the role of fatty acid synthase. J Natl Cancer Inst. 2012;104:343–5. doi: 10.1093/jnci/djs010. [DOI] [PMC free article] [PubMed] [Google Scholar]
- 37.Saxena R, Voight BF, Lyssenko V, Burtt NP, de Bakker PI, Chen H, et al. Genome-wide association analysis identifies loci for type 2 diabetes and triglyceride levels. Science. 2007;316:1331–6. doi: 10.1126/science.1142358. [DOI] [PubMed] [Google Scholar]
- 38.Altshuler D, Hirschhorn JN, Klannemark M, Lindgren CM, Vohl M-C, Nemesh J, et al. The common PPAR[gamma] Pro12Ala polymorphism is associated with decreased risk of type 2 diabetes. Nat Genet. 2000;26:76–80. doi: 10.1038/79216. [DOI] [PubMed] [Google Scholar]
- 39.Theodoropoulos G, Papaconstantinou I, Felekouras E, Nikiteas N, Karakitsos P, Panoussopoulos D, et al. Relation between common polymorphisms in genes related to inflammatory response and colorectal cancer. World J Gastroenterol. 2006;12:5037–43. doi: 10.3748/wjg.v12.i31.5037. [DOI] [PMC free article] [PubMed] [Google Scholar]
- 40.Abuli A, Fernandez-Rozadilla C, Alonso-Espinaco V, Munoz J, Gonzalo V, Bessa X, et al. Case-control study for colorectal cancer genetic susceptibility in EPICOLON: previously identified variants and mucins. BMC Cancer. 2011;11:339. doi: 10.1186/1471-2407-11-339. [DOI] [PMC free article] [PubMed] [Google Scholar]
- 41.Jiang J, Gajalakshmi V, Wang J, Kuriki K, Suzuki S, Nakamura S, et al. Influence of the C161T but not Pro12Ala polymorphism in the peroxisome proliferator-activated receptor-gamma on colorectal cancer in an Indian population. Cancer Sci. 2005;96:507–12. doi: 10.1111/j.1349-7006.2005.00072.x. [DOI] [PMC free article] [PubMed] [Google Scholar]
- 42.Murtaugh MA, Ma KN, Caan BJ, Sweeney C, Wolff R, Samowitz WS, et al. Interactions of peroxisome proliferator-activated receptor {gamma} and diet in etiology of colorectal cancer. Cancer Epidemiol Biomarkers Prev. 2005;14:1224–9. doi: 10.1158/1055-9965.EPI-04-0681. [DOI] [PubMed] [Google Scholar]
- 43.Hirschhorn JN, Gajdos ZK. Genome-wide association studies: results from the first few years and potential implications for clinical medicine. Annu Rev Med. 2011;62:11–24. doi: 10.1146/annurev.med.091708.162036. [DOI] [PubMed] [Google Scholar]
- 44.Theodoratou E, Montazeri Z, Hawken S, Allum GC, Gong J, Tait V, et al. Systematic meta-analyses and field synopsis of genetic association studies in colorectal cancer. J Natl Cancer Inst. 2012;104:1433–57. doi: 10.1093/jnci/djs369. [DOI] [PubMed] [Google Scholar]
- 45.Gao X, Becker LC, Becker DM, Starmer JD, Province MA. Avoiding the high Bonferroni penalty in genome-wide association studies. Genet Epidemiol. 2010;34:100–5. doi: 10.1002/gepi.20430. [DOI] [PMC free article] [PubMed] [Google Scholar]
Associated Data
This section collects any data citations, data availability statements, or supplementary materials included in this article.