Abstract
We show that cultures of mouse embryo liver generate insulin-positive cells when transduced with an adenoviral vector encoding the three genes: Pdx1, Ngn3 and MafA (Ad-PNM). Only a proportion of transduced cells become insulin-positive and the highest yield occurs in the period E14-16, declining at later stages. Insulin-positive cells do not divide further although they can persist for several weeks. RT-PCR analysis of their gene expression shows the upregulation of a whole battery of genes characteristic of beta cells including upregulation of the endogenous counterparts of the input genes. Other features, including a relatively low insulin content, the expression of genes for other pancreatic hormones, and the fact that insulin secretion is not glucose-sensitive, indicate that the insulin-positive cells remain immature. The origin of the insulin-positive cells is established both by co-immunostaining for -fetoprotein and albumin, and by lineage tracing for Sox9, which is expressed in the ductal plate cells giving rise to biliary epithelium. This shows that the majority of insulin-positive cells arise from hepatoblasts with a minority from the ductal plate cells.
Keywords: Hepatoblast, beta cell, Pdx1, Ngn3, MafA, Sox9
1. Introduction
During embryonic development cells undergo a sequence of developmental decisions, usually in response to external signals (Gilbert, 2010; Slack, 2012; Wolpert and Tickle, 2011). At each stage the cell state is defined by a combination of transcription factors that controls the activity of the appropriate repertoire of genes. For each cell lineage the end product of the sequence of decisions is a specific differentiated cell type. It is possible to alter the pathway taken by a lineage in two ways. During the stage of competence to extracellular signals, the cell may be caused to develop down a different pathway by exposure to a different extracellular factor or to a different concentration of the same factor. This is why grafts of embryonic tissue from one position to another are often caused to develop in a manner consistent with their new position. In addition it is possible to alter the course of development by misexpression of those transcription factors which define the intermediate or terminal states of cell differentiation.
To some extent it has even proved possible to reprogram terminally differentiated cells by misexpression of transcription factors appropriate to a different cell type (Gurdon and Melton, 2008; Zhou and Melton, 2008). However such procedures frequently have no effect or give partial transformations resulting in mixed phenotypes. Because of the importance of the pancreatic beta cell for control of blood sugar, and its role in diabetes, considerable effort has gone into elucidation of the pathways of pancreatic development in recent years (Gittes, 2009; Grapin-Botton et al., 2007; McKnight et al., 2010; Murtaugh and Melton, 2003; Rieck et al., 2012). Methods for generating cells with a beta-like phenotype have also attracted much attention because of the prospect that these cells could be used for transplantation therapy of type 1 diabetes (Bonner-Weir and Weir, 2005; Gangaram-Panday et al., 2007; Miszta-Lane et al., 2006).
In 2008 Zhou et al showed that the three gene combination Pdx1, Ngn3 and MafA could reprogram pancreatic exocrine cells of adult mice into a beta-like phenotype (Zhou et al., 2008). PDX1 normally controls growth and development of the pancreatic bud, NGN3 is required for formation of endocrine progenitors, and MAFA (and also PDX1 again) are required for maturation of beta cells (Gittes, 2009; Grapin-Botton et al., 2007; McKnight et al., 2010; Murtaugh and Melton, 2003; Rieck et al., 2012). Our laboratory had previously found that overexpression of the gene for an activated form of PDX1 (PDX1-VP16) in the immature liver of Xenopus tadpoles could bring about a reprogramming to pancreas (Horb et al., 2003). In view of the potency of Pdx1 + Ngn3 +MafA (here referred to as PNM) on adult pancreatic exocrine cells, we were interested to find what was the susceptibility of the cells of the liver to this gene combination. The liver is developmentally related to the pancreas as it arises from the same region of the embryonic endoderm, which becomes partitioned into liver and pancreatic buds depending on the concentration of FGF and BMP secreted by the neighboring cardiac mesoderm (Chung et al., 2008; Deutsch et al., 2001; Gouon-Evans et al., 2006; Zaret and Grompe, 2008). This close developmental relationship may mean that the chromatin configuration of mature liver cells still allows access by pancreatic transcription factors to their target genes and so their overexpression can be effective at phenotypic reprogramming (Kraus and Grapin-Botton, 2012). In studies on adult mice we have found that PNM has two effects. It will reprogram hepatocytes to a mixed phenotype which has some properties of beta cells and some of hepatocytes. It will also reprogram a Sox9 positive cell population, probably cells of small bile ducts, to a different mixed phenotype having some properties of beta cells and some of ducts (Banga et al., 2012). In view of the previous experience with Pdx1-VP16 in Xenopus, we were interested to examine the susceptibility of embryonic liver to this three gene combination and this is done in the present paper.
The experiments were carried out using in vitro cultures of cells from embryonic mouse liver buds. These are mixed cultures containing both epithelial and mesenchymal cells and, later on, also some ductal plate cells. Ductal plate cells express Sox9 and later give rise to the epithelium of the biliary system (Antoniou et al., 2009; Carpentier et al., 2011; Delous et al., 2012; Lemaigre, 2003). Cultures were transduced with Ad-PNM, which is an adenoviral vector encoding all three genes: Pdx1, Ngn3 and MafA. Adenovirus is a DNA virus which is suitable for transient overexpression as it does not integrate into the host cell genome.
Our results show that PNM brings about a partial reprogramming to insulin-positive cells and that the competence to respond declines during the second half of the gestation period. The cells of origin are mostly hepatoblasts although there is also a small contribution from Sox9-positive cells, which are presumed biliary precursors. As seen previously with pancreatic exocrine cells (Akinci, 2012), the reprogramming appears to be incomplete. Although the cells do secrete insulin they do not respond appreciably to glucose-stimulation, as do normal beta cells. They also have lower insulin content than normal beta cells and express hormones characteristic of other pancreatic endocrine cell types. These are all characteristics of immature beta cells so suggest that the embryonic hepatoblasts are diverted in their development by the three transcription factors to become immature pancreatic endocrine cells.
2. Results
2.1 Induction of a partial beta cell phenotype in embryonic liver cultures
Embryonic liver cultures were established from CD1 mice and were transduced with Ad-PNM. Previous work with this three gene vector has shown that it is much more effective that cotransfection with individual vectors encoding the three genes separately (Akinci, 2012). The cultures were set up from gestation days E12-E18. Liver buds were dissected from the embryos, minced with forceps and collagenased to dissociate them into single cells. These were filtered through a 100 micron mesh and plated in Kubota’s medium (Kubota and Reid, 2000) on a Matrigel substrate. Cultures were exposed to Ad-PNM for three days and on the following day were fixed for immunostaining or processed for Q-RT-PCR analysis.
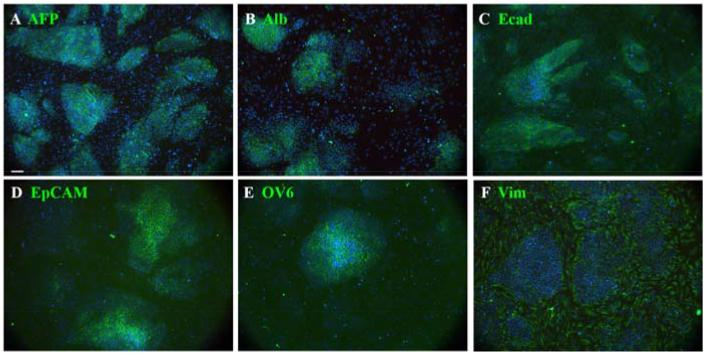
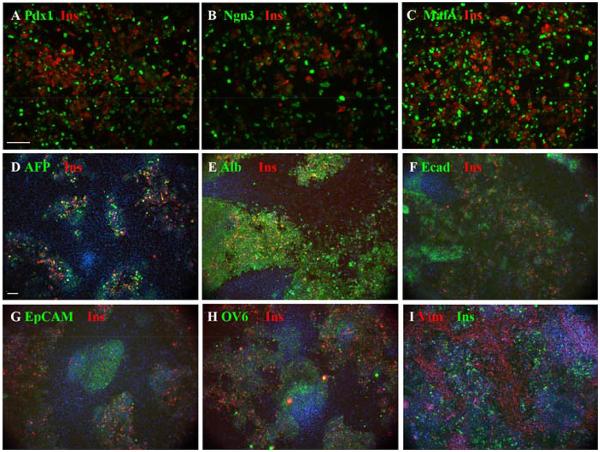
The appearance of control cultures is shown in Fig.1. They appear as islands of epithelial cells separated by areas of mesenchyme. The epithelial cells stain positive for a number of hepatoblast or hepatocyte markers: -fetoprotein (AFP), E-cadherin, epithelial cell adhesion molecule (EpCAM), OV6, and albumin. The AFP level decreases and the albumin level increases over the period E12-E18. Following Ad-PNM transduction, a large number of insulin-immunopositive cells appear (Fig.2), while none are seen in control cultures. Fig.2A-C shows the concordance between insulin expression and the expression of the three virus-encoded proteins: PDX1, NGN3 and MAFA. Many more cells become transduced with virus than express insulin. Those that do express insulin are not those showing the highest level of virus-encoded proteins, rather they appear to show medium levels. There was a pronounced difference in the number of insulin-positive cells seen depending on the embryonic stage at which the cultures had been initiated.
Fig.1.
Cultures from E12 liver buds. A-F. Cultures consist of islands of hepatoblasts surrounded by mesenchyme. In addition to the indicated antibodies in green they are also stained for insulin (red), for which they are all completely negative, and for DAPI (blue). These were fixed after two days of culture. Scale bar 100 m.
Fig.2.
Effect of transduction with Ad-PNM. A-C. Expression of insulin (red) along with the three vector-encoded proteins (green), showing insulin present in many cells with medium level expression of the vector proteins. D-I. Insulin-positive cells shown with the same endogenous markers as in Fig.1, and also stained with DAPI. Scale bars 100 m.
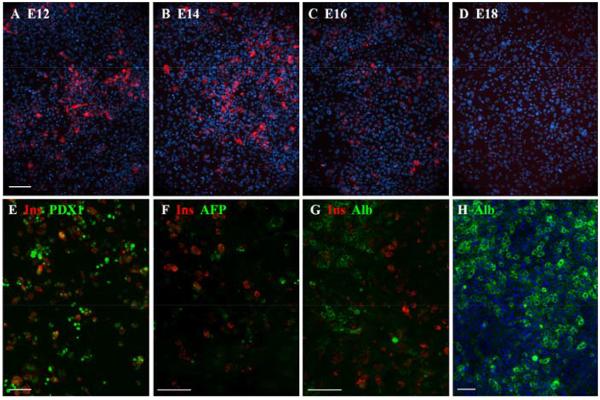
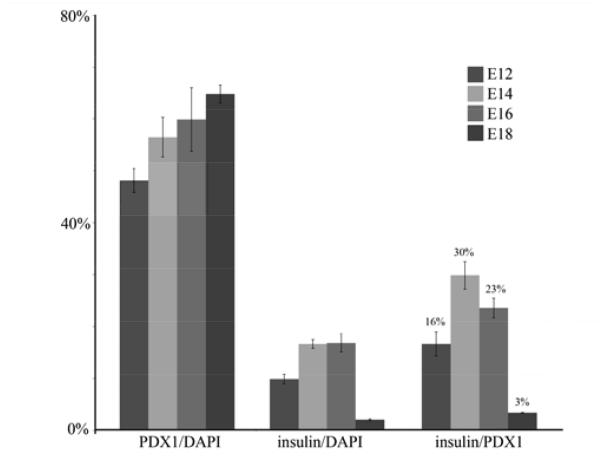
The overall proportion of insulin-positive cells peaked at about 17% for cultures initiated in the period E14-16 (Fig.3A-D). In Fig.4 are presented quantitative data. This shows that the level of virus transduction, measured by the number of cells expressing PDX1, increased only slightly with stage, (E12 to E18, p=0.014, differences for lesser intervals are not significant). On the other hand the proportion of insulin-positive cells, as a fraction of virus-transduced cells, is low for early and late stages and peaks for E14-initiated cultures at 29.7±2.6%. By E18-initiated cultures it has fallen to 3.2±0.09%. For the comparison between E14 and E18 initiated cultures the p-value is 0.007. Previous work on hepatocytes isolated from postnatal and adult mouse liver showed no insulin-positive cells, although some are obtained from rat hepatocytes (Akinci et al., submitted for publication).
Fig.3.
Competence of embryonic liver to respond to Ad-PNM. A-D show the insulin-positive cells (red) induced after treatment of cultures initiated from embryos of the indicated stage. DAPI is blue. E-G show 3 week cultures. Insulin positive cells persist, with medium levels of PDX1 and they contain no AFP or albumin. F. 3 week control culture showing widespread albumin expression. Scale bars 100 m.
Fig.4.
Change of competence with embryonic stage. For cultures initiated between E12 and E18, the transduction efficiency increases slightly, but the proportion of insulin-positive cells peaks at E14-16. Errors are standard errors, based on 3 independent experiments.
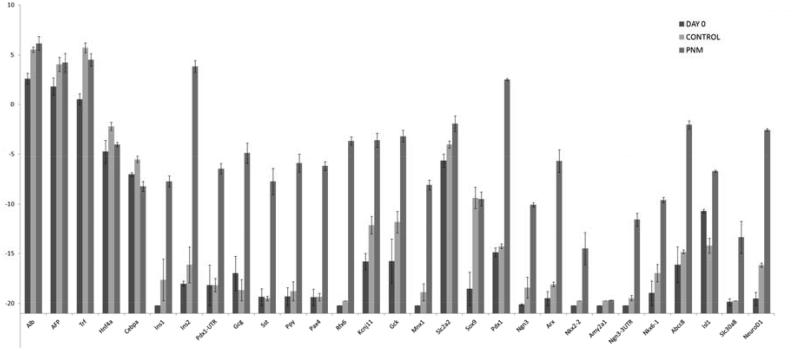
Maintenance of cultures over long periods was difficult because of the death of epithelial cells and their overgrowth by mesenchymal cells. However some long term cultures were successfully conducted (Fig.3E-H). These showed that insulin-positive cells could persist for at least 5 weeks, that they possessed a medium level of nuclear PDX1, and that they did not express -fetoprotein or albumin. We were not able to isolate the reprogrammed cells from the cultures so the RT-PCR analysis is necessarily of mixed cell populations. It shows upregulation of a suite of genes characteristic of beta cells (Fig.5). They include genes for the hormones insulin 1 and 2 (rodents have two insulin genes), and for the transcription factors: PAX4, RFX6, MNX1, ISL1, NKX6.1 and NeuroD. Moreover the endogenous counterparts of the input genes, Pdx1-UTR and Ngn3-UTR were upregulated as assessed by using PCR primers complementary to the 3′UTR (MafA has no 3′UTR). Also upregulated were the genes for glucokinase and KCNJ11, which are components of the glucose-sensing mechanism. Slc2a2, encoding the glucose transporter GLUT2, is also highly expressed but is normally expressed in hepatocytes as well as beta cells. Expression of the genes typical of hepatoblasts or hepatocytes, Alb, Afp, Trf, Hnf4a, C/ebpa, was not reduced, presumably because of the fact that many of the cells were not reprogrammed. Although the PCR analysis indicates upregulation of a panel of genes typical of beta cells, there are also genes encoding products characteristic of other pancreatic endocrine types, notably the transcription factor ARX, and the hormones glucagon, somatostatin and pancreatic polypeptide (PP). Expression of the gene for the characteristic exocrine product amylase is missing, indicating that the reprogramming is not to pancreas in general, but to an endocrine precursor, or a mixed endocrine type of cell. Comparison of these results with similar studies already published shows that the reprogrammed hepatoblasts are more similar to reprogrammed cells isolated from adult liver than they are to reprogrammed pancreatic exocrine cells (Akinci, 2012; Banga et al., 2012). In terms of beta cell characteristics both liver cell populations show greater enhancement of expression of NeuroD, Nkx2.2 and Slc30a8 (encoding a zinc transporter). However, they also show higher levels of Arx and non-beta type hormone genes, especially that encoding glucagon. The pancreatic gene expression profile is generally similar to that of whole islets, which include the non-beta endocrine cells (Banga et al., 2012).
Fig.5.
qRT-PCR for a panel of beta cell genes in embryonic liver cultures transduced with Ad-PNM. Errors are standard errors, based on 3 independent experiments.
2.2 Cell division and insulin secretion
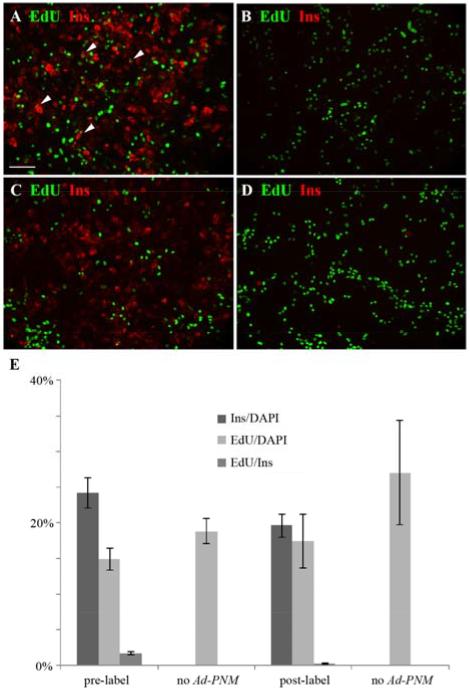
To examine cell division after the Ad-PNM transduction, cultures were exposed overnight to ethynyl deoxyuridine (EdU) and fixed the next day for EdU detection and immunostaining. If the EdU label was given before the Ad-PNM, a proportion of the insulin-positive cells were positive for EdU. However, when the Ad-PNM was given first, followed by the EdU, then the insulin-positive cells showed virtually no EdU labeling (Fig.6; p=0.003 for pre- versus post-Ad-PNM label). This shows that the reprogrammed cells are no longer dividing, something seen previously with pancreatic exocrine cells reprogrammed with Ad-PNM (Akinci, 2012)
Fig.6.
Absence of cell division of reprogrammed cells. EdU is green and insulin red. A. 2 hour pulse of EdU given before Ad-PNM transduction. Many insulin-positive cells are EdU-positive (examples indicated with arrowheads). B. Control without Ad-PNM, showing no insulin-positive cells. C. Overnight label with EdU after Ad-PNM transduction. Here there are no insulin-positive cells that are EdU-positive. D. Control without Ad-PNM showing no insulin-positive cells. E. Quantitative results, errors are standard errors, based on 4 samples. Scale bar 100 m.
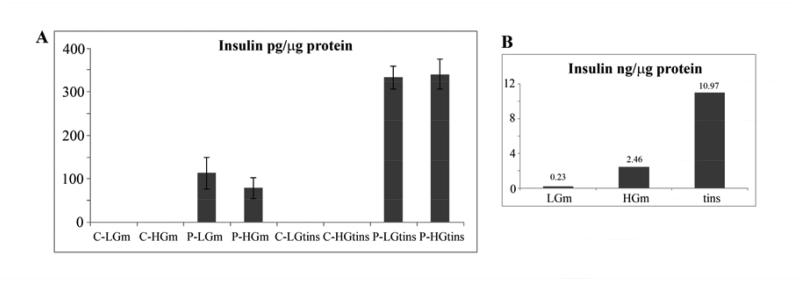
The insulin protein content of the reprogrammed cultures was measured by ELISA. This showed that the content was 336 ± 6 pg/microgm total protein. By comparison, the figure for adult mouse islets measured by the same method was 10970 pg/microgm. This suggests that the reprogrammed cells have only about 3% of the insulin content of mature beta cells. Insulin was secreted into the medium by the reprogrammed cells. Some experiments showed a modest (two fold) degree of stimulation of insulin secretion when the glucose was raised from 2.8 to 20 mM. However this was not reproducible and the majority of cultures showed no glucose sensitivity (Fig.7A). Under the same conditions, adult mouse islets showed the expected enhancement of secretion in the presence of high glucose (Fig.7B). The low insulin content and the general lack of glucose sensitivity indicates that the reprogrammed cells have an immature beta cell (or mixed endocrine cell) phenotype rather than a mature one.
Fig.7.
Insulin secretion and content. A. Reprogrammed hepatoblasts. The left four bars show secretion into the medium, the right four bars show insulin content of the cells. Errors are standard errors, this figure is based on six independent experiments. B. Adult mouse islets. C=not transduced, P=Ad-PNM transduced, LG=low glucose, HG=high glucose, m=medium, tins=total insulin in cells.
2.3 Cell lineage of beta-like cells
We investigated the cell lineage of the reprogrammed cells in two ways. One used co-immunostaining of the cultures and the other employed a genetic lineage label for Sox9, which is expressed in cells of the ductal plate of embryos which later give rise to the biliary system (Antoniou et al., 2009; Carpentier et al., 2011; Delous et al., 2012; Lemaigre, 2003).
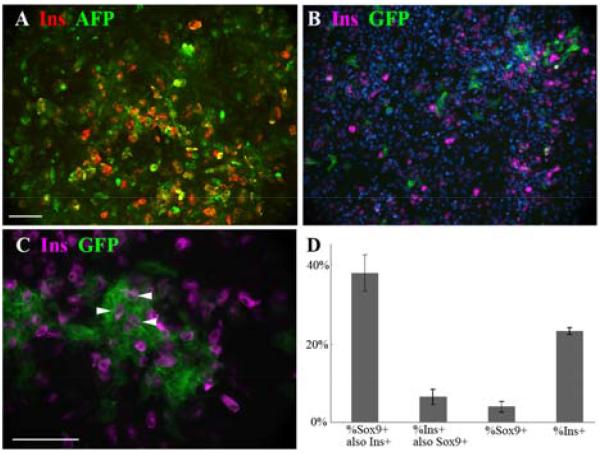
As shown in Figs.1 and 2 the liver bud cultures formed islands of epithelial cells surrounded by mesenchyme. The insulin-positive cells always arose within the epithelial islands and not in the mesenchyme. This is clearly apparent in Fig.2D-I. Some of the epithelial markers, especially Ecadherin, appeared to be lost rapidly from insulin-positive cells but others were retained for the three day culture period. In Fig.8A is shown a co-staining for insulin and AFP. Quantification of results from co-staining showed that the proportion of insulin-positive cells also positive for AFP is 91.6±4.4%. and the proportion of insulin-positive cells also positive for albumin is 98.8±0.5%. This indicates that most of the insulin-positive cells retain the hepatoblast or hepatocyte markers over three days, indicating that they are derived from hepatoblasts. Over prolonged culture these liver markers are lost suggesting that their genes are downregulated in the reprogrammed cells (Fig.3F,G). In the three day cultures there are no insulin-positive cells in the mesenchymal spaces between the epithelial islands, consistent with the idea that they derive from hepatoblasts (Fig.2I). It is not possible to quantify this by cell counting as some vimentin does appear in the epithelial cells over the culture period.
Fig.8.
Cell lineage studies. A. Co-expression of AFP and insulin in E14-initiated culture transduced with Ad-PNM. B-C. Cultures from Sox9CreER embryos were treated with tamoxifen and subsequently with Ad-PNM. Sox9 expressing cells become and remain green and some insulin-positive cells are green (examples indicated with arrowheads). Insulin is viewed in far red, rendered as magenta. Scale bars 100 m. D. Quantification of results. This experiment used 4d tamoxifen treatment.
The other method employed the Sox9-CreER;mTmG transgenic mouse strain which we have used previously (Banga et al., 2012). On treatment with tamoxifen, cells with the Sox9 promoter active, which are making CreER, recombine their reporter genes such that a membrane bound td-Tomato protein becomes replaced by a membrane bound GFP. These cells will then remain green even if the Sox9 gene is no longer active. For the present study, embryonic liver cultures from E14 were treated over 3 or more days with tamoxifen to label the Sox9 expressing cells. They were then treated for one day with Ad-PNM to induce reprogramming. After a further three days of culture they were fixed for analysis. Following this procedure, about 4% of cells were green, indicating the level of expression of Sox9 during the first three days. 23±0.8% were insulin-positive. 37.7±4.6% of the green cells were insulin-positive, showing that the Sox9 population does indeed contribute to the reprogrammed cells. However, only 6.4±2.0% of the total insulin-positive cells were green. If the tamoxifen treatment period is extended to 7 days and the Ad-PNM is given afterwards, the differences from 4 days are not significant (p>0.05 for the proportion of GFP cells which are insulin-positive and the proportion of insulin-positive cells that are GFP-positive). This indicates that the efficiency of recombination is approaching 100% after three days, which would be consistent with our earlier experiments with whole mice of this strain. Evidently a proportion of the beta-like cells do arise from the Sox9 population. However the majority arise from hepatoblasts.
3. Discussion
3.1 Susceptibility of embryonic liver
Our results show that embryonic liver is quite susceptible to partial reprogramming by PNM. Parallel studies on a variety of postnatal and in vitro cell types have shown that adult mouse hepatocytes transduced with Ad-PNM give no insulin-positive cells and in terms of new gene expression show only a slight upregulation of the two insulin genes, with no other beta cell gene expression (Akinci et al. 2013, submitted for publication). However a hepatoblast-like cell line called ASH does give comparable results to those described here, albeit with a lower percentage of insulin-positive cells. We can conclude that embryo mouse liver is significantly more susceptible than adult. The reasons for this will require further investigation but one possibility is that the chromatin configuration of hepatoblasts is substantially different from that of mature hepatocytes. This was shown by (Kyrmizi et al., 2006) in a chromatin immunoprecipitation study in which it was found that although the same transcription factors control the cell state in the embryo and adult, the number and extent of cross regulatory connections is much higher in the adult. There was also some change between E14 and E18, consistent with the reduction of competence for reprogramming that we observe during this period. In an earlier study on Xenopus we showed that the activated form of Pdx1, Pdx1VP16, could completely reprogram 3d tadpole liver to pancreas (Horb et al., 2003). However subsequent unpublished work showed that this effect was lost by one week of development, which is again consistent with the present result on mouse embryo liver.
3.2 Extent of reprogramming
In recent years there have been a number of studies showing reprogramming of one cell type to another by the overexpression of specific transcription factors. These include the conversion of pancreatic exocrine cells to hepatocytes (Shen et al., 2000), B lymphocytes into macrophages (Xie et al., 2004), pancreatic exocrine cells to endocrine cells (Zhou et al., 2008), fibroblasts to neurons (Vierbuchen et al., 2010) or fibroblasts to cardiomyocytes (Ieda et al., 2010). 1-4 transcription factors are needed, and they are selected from those involved in the normal embryonic development of the cell type in question (Slack, 1985; Slack, 2007). In this context it is important to distinguish between genuine reprogramming of cell type and transient upregulation of individual target genes by the introduced factors. Genuine reprogramming involves a permanent and stable new state, which is maintained in the absence of the introduced factors. It is always difficult to be sure that this has really occurred in cases where the new cell type is postmitotic, as even non-integrating viral vectors may persist for a long time in such cells. In the case of reprogramming to induced pluripotent stem cells (Nishikawa et al., 2008; Takahashi and Yamanaka, 2006) this problem does not arise, as the cells divide rapidly and clearly maintain their new state. In the present study arguments in favor of reprogramming are as follows. First there is a whole battery of new genes upregulated, not just direct targets of the input factors. Secondly, the endogenous counterparts of Pdx1 and Ngn3 are upregulated. This is probably also true of MafA but it is not possible to prove it because of the lack of a 3′UTR in its transcript. Expression of endogenous counterparts is one important precondition for the new state to be stable in the absence of the initiating factors. Thirdly, insulin-positive cells can persist for long periods, at least 5 weeks in our experiments. Fourthly, the new phenotype is very similar to that which we have observed in other work which involved the demonstrable loss of the viral vector (Banga et al., 2012). For these reasons we think it probable that this system does display reprogramming although we cannot be completely certain of this.
The actual phenotype of the insulin-positive cells has many features in common with real beta cells but there are also several differences. In particular the presence of some non-beta type endocrine markers suggests that, as in the other systems we have examined, the reprogramming here is incomplete, perhaps to a multiendocrine or immature form of cell (Teitelman et al., 1993). This is compatible with the low insulin content and the general lack of glucose sensitivity of insulin secretion. The generation of immature beta cells is also often observed in procedures to make beta cells from embryonic stem cells (Cheng et al., 2013; D’Amour et al., 2006; Hosoya et al., 2012).
The loss of cell division by the insulin-positive cells is similar to what we have seen with reprogrammed pancreatic exocrine cells (Akinci, 2012). Real beta cells also do not divide much (Bonner-Weir, 1994; Bouwens and Rooman, 2005) and this suggests that expansion of reprogrammed cells in vitro will be difficult.
3.3 Origin of insulin-positive cells
In recent years several laboratories have reported procedures whereby cells of the adult liver can be induced to produce insulin by the overexpression of transcription factors normally involved in pancreatic endocrine development (Ber et al., 2003; Ferber et al., 2000; Kaneto et al., 2005; Kojima et al., 2003; Miyatsuka et al., 2003; Yechoor et al., 2009). The liver contains two distinct types of epithelial cell: the hepatocyte and the biliary epithelial cell. These both arise from the hepatoblasts present in the early liver bud (Si-Tayeb et al., 2010). Based on the markers present on the epithelial islands in our cultures (AFP, E-cad, EpCAM, OV6) we consider these cells to be hepatoblasts. The biliary system normally arises in the second half of gestation from structures called ductal plates which form around the portal veins (Shiojiri, 1997). The Sox9 gene is expressed in early cells of the ductal plates and its expression persists in small but not large bile ducts after birth (Antoniou et al., 2009; Carpentier et al., 2011). In our system using Sox9CreER;mT/mG liver cultures it was possible to visualize GFP-positive cells after tamoxifen treatment, numbering less than 10% of total cells. Since they must be expressing Sox9 at the time of treatment we consider them to be ductal plate cells.
The co-expression for a period of AFP or albumin, together with insulin, indicates clearly that a high percentage of the insulin-positive cells derive from hepatoblasts. The Sox9 labeling experiment in addition shows that a minority of insulin-positive cells derive from ductal plate cells that have commenced expression of Sox9. The fact that both hepatoblasts and Sox9 cells can give rise to insulin-positive cells is comparable to our in vivo results (Banga et al., 2012) (and Banga, 2013 submitted). In vivo there is evidence for glucose sensitivity of the Sox9-derived cells and it remains possible that the Sox9 derived cells in the current work are glucose sensitive, but as a small minority they would not be observable against the background of the majority of hepatoblast-derived cells.
In recent years there has been considerable interest in producing beta cells in vitro for potential transplantation therapy of patients with type 1 diabetes (Fryer et al., 2013; Weir et al., 2011). We believe that the demonstrable greater susceptibility of embryonic cells demonstrated here should assist the progress of this work.
4. Experimental Procedures
4.1 Isolation of mouse embryonic hepatoblasts and viral infection
Animal experiments were conducted under University of Minnesota IACUC Protocol #1002A78295. Embryonic liver buds were isolated from CD1 mouse embryos at E12, E14, E16, and E18. Hepatoblasts were released by disrupting liver tissues by pipetting and dissociating them with 0.5mg/ml collagenase (Worthington) at 37°C for 20-30 min. The single cell suspension was filtered through a 100μm cell strainer (BD Biosciences) to remove clumps and debris. About 106 cells were plated on Matrigel (BD Biosciences)-coated plates and maintained in Kubota’s medium (Kubota and Reid, 2000). After 2 days, cells had spread to 80% to 90% confluence, and Ad-PNM was administrated at a nominal multiplicity of infection (MOI) of 10000. The medium was changed every day during the culture period.
Ad-PNM is a first generation adenoviral vector encoding Pdx1, Ngn3 and MafA joined by 2A sequences. Its construction is described in (Akinci, 2012). Kubota’s medium is a 1:1 mixture of DMEM and Ham’s F12 (DMEM/F12; Gibco) supplemented with 20ng/ml recombinant human epidermal growth factor (rhEGF; Gibco), 5μg/ml human recombinant insulin (Invitrogen), 10−7M dexamethasone, 10μg/ml human apo-transferrin (Sigma-Aldrich), 4.4mM nicotinamide (Sigma-Aldrich), 0.2% albumin from bovine serum (BSA; Sigma-Aldrich), 0.5 M 2-mercaptoethanol (Sigma-Aldrich), 2mM L-glutamine, 1% anti-anti, 1×10⁻¹⁰M ZnSO4 (Sigma-Aldrich), 1×10⁻¹⁰M Na2SeO3, and 7.8μM free fatty acids. The free fatty acid stock is composed of 1M palmitic acid (Sigma-Aldrich), 1M palmitoleic acid (Sigma-Aldrich), 151mM stearic acid (Sigma-Aldrich), 1M oleic acid (Sigma-Aldrich), 1M linoleic acid (Sigma-Aldrich) and 1M linolenic acid (Sigma-Aldrich) in ethanol (Sigma-Aldrich).
4.2 Immuno and EdU staining
Cultures were fixed 3 days after Ad-PNM administration with formalin (1:10 dilution (buffered), Protocol, Fisher Scientific Company L.L.C) for 15 min. After washing, cells were permeabilized with 0.5% TritonX-100 in PBS for 30 min. They were blocked with PBS + 0.3% TritonX-100 and 10% normal goat serum (Jackson ImmunoResearch) for 1hr, then samples were incubated with primary antibodies overnight. Secondary antibody incubation was 1 hr.
Primary antibodies used were as follows: rabbit and goat anti-albumin (1:100 dilution; Bethyl Laboratories); rabbit anti-AFP (1:100 dilution; ProteinTech); rabbit anti-PDX1 (1:1000 dilution; Millipore); rabbit anti-NGN3 (1:100 dilution; Santa Cruz Biotechnologies); rabbit anti-MAFA (1:100 dilution; Santa Cruz Biotechnologies); guinea-pig anti-insulin (1:200 dilution; Abcam); mouse anti-vimentin (1:200 dilution; Sigma); mouse anti-Ecad (1:100 dilution; BD Biosciences); mouse anti-epithelial cell adhesion molecule (EpCAM; 1:100 dilution; Santa Cruz Biotechnology); mouse anti-OV6 (1:200 dilution; R&D systems). Secondary antibodies used were as follows: alexa fluor 488 goat anti-rabbit IgG; alexa fluor 488 rabbit anti-mouse; alexa fluor 594 goat anti-guinea pig IgG; alexa fluor 647 goat anti-guinea pig IgG; alexa fluor 555 goat anti-rabbit IgG. All secondary antibodies were used in 1:500 dilution (Invitrogen). Images were taken on a Leica DMI6000 B inverted microscope by a Retiga2000 camera using iPLab. t-tests were used to assess the significance of differences.
For EdU staining cultures were incubated with 10μM EdU for 2 hrs or overnight. They were fixed in formalin and were stained for EdU using a Click-iT EdU 488 Imaging kit (Invitrogen). Images were taken using Leica DMI6000 B inverted microscope.
Results shown in Figs. 1, 2, 3, 6, 7 are based on three or more independent experiments. Cell counts given in the Results are expressed as means ± standard error and t-tests were used to assess the significance of differences.
4.3 Insulin secretion
7 days after Ad-PNM transduction, E14 hepatoblasts (100% confluence, ~ 2×10⁶) plated in 6-well plates were incubated in Krebs-Ringer buffer (KRB) at 37°C for 45 min to release any adsorbed insulin. Then cells were incubated in KRB supplemented with 2.8mM glucose or 20mM glucose for 45 min at 37°C. Cells without Ad-PNM administration were used as control. After incubation, a protease inhibitor cocktail was added to each sample according to the manufacturer’s manual (Complete Mini, Protease inhibitor cocktail tablets, Roche Diagnostics). The medium was collected and concentrated by Amicon Ultra-15 centrifugal filter units (Millipore). The cells were detached with trypsin, and resuspended in KRB. A sample was used for a total protein measurement with the Pierce BCA Protein Assay kit (Thermo Scientific). After homogenization with an insulin syringe the cells, with protease inhibitors, were rotated overnight at 4°C and centrifuged (12000 rpm, 5 min at 4°C). Then the supernatant was collected for measurement of total insulin content. The concentrations of medium insulin and total insulin were measured using an Ultrasensitive Mouse Insulin ELISA kit (ALPCO), according to the manufacturer’s protocol. Insulin measurements per g cell protein are expressed as means ± standard error and t-tests were used to assess the significance of differences, as shown in the Results.
To isolate adult mouse islets the common bile duct was cannulated posterior to the branching point. Using a 30 gauge butterfly needle and a 3 ml syringe, distension solution containing Hank’s balanced salt solution supplemented with 10mg/ml insulin, 1% heparin and 5mg/2.5ml collagenase was injected through the duct until the pancreas was fully distended. The pancreas was then taken out and incubated at 37°C with the remaining distension solution. After 10 mins it was vortexed and digested for an additional 6 mins. Stop solution was then added containing FBS and it was centrifuged for 2 mins at 700rpm at 8°C. The pellet was resuspended in the stop solution and the mixture passed through the 850 m strainer. This solution was the centrifuged for 3 mins at 1000rpm at 8°C. The pellet was resuspended in FBS and layered on a gradient maker containing OptiPrep Separation medium (Bioexpress) and gradient stock solution (Cellgro). It was then spun at 1750rpm for 5 mins. The upper fraction containing the layer of islets was collected. It was resuspended in Krebs-Ringer buffer and, using an islet picker and dissecting microscope, the islets were removed from any remaining non-islet tissue. The islets were finally resuspended in fresh Krebs-Ringer buffer for the assays.
4.4 Quantitative reverse transcription – polymerase chain reaction (qRT-PCR)
Total RNA from the liver bud pieces or cell cultures was isolated using TRI reagent (Sigma-Aldrich), according to the manufacturer’s protocol. Extracted RNA samples were incubated at 37°C with DNase enzyme (Promega) for 45 min, 3 times, to achieve a complete elimination of potential residual genomic DNA. Then 2μg RNA was used to synthesize cDNA by SuperScript III Reverse Transcriptase, random primers, dNTP (10mM) and RNaseOUT Recombinant Ribonuclease Inhibitor (Invitrogen). The PCR program was an initial denaturation at 95°C for 30sec, following by 40 cycles of amplification which was denaturation at 95°C for 5sec and then annealing and extension at 60°C for 20sec. The gene expression profiles were compared by qRTPCR for Glyceraldehyde-3phosphate dehydrogenase (Gapdh), mouse Albumin (Alb), Alpha fetoprotein (Afp), Transferrin (Trf), hepatocyte nuclear factor 4 alpha (Hnf4α), CCAAT-enhancer binding protein alpha (C/ebpα), Ins1, Ins2, endogenous Pdx1, Glucagon (Gcg), Somatostatin (Sst), Pancreatic polypeptide (Ppy), paired box 4 (Pax4), regulatory factor X 6 (Rfx6), potassium inwardly-rectifying channel subfamily J member 11 (Kcnj11), glucokinase (Gck), motor neuron and pancreas homeobox1 (Mnx1), glucose transporter 2 (Glut2, Slc2a2), SRY-box containing gene 9 (Sox9), Pdx1, Ngn3, aristaless related homeobox (Arx), NK2 homeobox 2 (Nkx2.2), Amylase 2a1 (Amy2a1), endogenous Ngn3, Nkx6.1, ATP-binding cassette transporter sub-family C member 8 (Abcc8), Isl1, solute carrier family 30 member 8 (Slc30a8), neurogenic differentiation factor 1 (NeuroD1). Primer sequences are available on request. The expression levels of the genes of interest were expressed relative to transcripts of the gene for the ubiquitous enzyme glyceraldehyde-3-phosphate dehydrogenase (GAPDH), which was normalized to zero.
4.5 Sox9 lineage tracing
Animal experiments were conducted under University of Minnesota IACUC Protocol #1002A78295. Sox9-CreERT2;mT/mG animals were generated by mating heterozygous Sox9CreERT2 males (Kopp et al., 2011) with homozygous mT/mG females. mT/mG is a double-fluorescent Cre reporter mouse that expresses membrane-targeted tandem dimer Tomato (mT) prior to Cre-mediated excision and membrane-targeted green fluorescent protein (mG) after excision (Muzumdar et al., 2007). Livers were dissected from embryos and used to set up cultures in Kubota’s medium. These were treated with 1μl/ml tamoxifen for 3 or more days. 50% of cultures showed green cells, indicating they had the Sox9CreERT2 gene. After washing with PBS for 5 times, cells were infected by Ad-PNM and fixed for immunostaining after a further three days. Because the tissue contains considerable red fluorescence from the tdTomato, the second antibody for insulin is here alexa fluor 647 goat anti-guinea pig IgG which is viewed in far red and shown as magenta on our figures. Images were taken using Leica DMI6000 B inverted microscope. Cell counts are expressed as means ± standard error and t-tests were used to assess the significance of differences, as shown in the Results.
Highlights.
Mouse embryo liver generates insulin-positive cells when transduced with an adenoviral vector encoding the three genes: Pdx1, Ngn3 and MafA (Ad-PNM).
Characterization of the insulin-positive cells indicate that they have an immature phenotype.
Their origin is mostly from hepatoblasts with a minority from ductal plate cells.
Acknowledgements
We are grateful to Lucas Greder for assistance with adenovirus production. This work was supported by grant R01DK080747 from the National Institutes of Health (NIDDK).
Footnotes
Publisher's Disclaimer: This is a PDF file of an unedited manuscript that has been accepted for publication. As a service to our customers we are providing this early version of the manuscript. The manuscript will undergo copyediting, typesetting, and review of the resulting proof before it is published in its final citable form. Please note that during the production process errors may be discovered which could affect the content, and all legal disclaimers that apply to the journal pertain.
References
- Akinci E, Banga A, Greder LV, Dutton JR, Slack JMW. Reprogramming of pancreatic exocrine cells towards a beta cell character using Pdx1, Ngn3 and MafA. Biochem.J. 2012;442:539–550. doi: 10.1042/BJ20111678. [DOI] [PMC free article] [PubMed] [Google Scholar]
- Antoniou A, Raynaud P, Cordi S, Zong Y, Tronche F, Stanger BZ, Jacquemin P, Pierreux CE, Clotman F, Lemaigre FP. Intrahepatic Bile Ducts Develop According to a New Mode of Tubulogenesis Regulated by the Transcription Factor SOX9. Gastroenterology. 2009;136:2325–2333. doi: 10.1053/j.gastro.2009.02.051. [DOI] [PMC free article] [PubMed] [Google Scholar]
- Banga A, Akinci E, Greder LV, Dutton JR, Slack JMW. In vivo reprogramming of Sox9+ cells in the liver to insulin-secreting ducts. Proc.Natl.Acad.Sci USA. 2012;109:15336–15341. doi: 10.1073/pnas.1201701109. [DOI] [PMC free article] [PubMed] [Google Scholar]
- Ber I, Shternhall K, Perl S, Ohanuna Z, Goldberg I, Barshack I, Benvenisti-Zarum L, Meivar-Levy I, Ferber S. Functional, persistent, and extended liver to pancreas transdifferentiation. J.Biol.Chem. 2003;278:31950–31957. doi: 10.1074/jbc.M303127200. [DOI] [PubMed] [Google Scholar]
- Bonner-Weir S. Regulation of pancreatic beta cell mass in vivo. Recent Prog. Horm. Res. 1994;49:91–104. doi: 10.1016/b978-0-12-571149-4.50008-8. [DOI] [PubMed] [Google Scholar]
- Bonner-Weir S, Weir GC. New sources of pancreatic beta-cells. Nature Biotechnology. 2005;23:857–861. doi: 10.1038/nbt1115. [DOI] [PubMed] [Google Scholar]
- Bouwens L, Rooman I. Regulation of pancreatic beta-cell mass. Physiol. Rev. 2005;85:1255, 1270. doi: 10.1152/physrev.00025.2004. [DOI] [PubMed] [Google Scholar]
- Carpentier R, Suñer RE, van Hul N, Kopp JL, Beaudry JB, Cordi S, Antoniou A, Raynaud P, Lepreux S, Jacquemin P, Leclercq IA, Sander M, Lemaigre FP. Embryonic Ductal Plate Cells Give Rise to Cholangiocytes, Periportal Hepatocytes, and Adult Liver Progenitor Cells. Gastroenterology. 2011;141:1432–1438. doi: 10.1053/j.gastro.2011.06.049. e4. [DOI] [PMC free article] [PubMed] [Google Scholar]
- Cheng X, Tiyaboonchai A, Gadue P. Endodermal stem cell populations derived from pluripotent stem cells. Current Opinion in Cell Biology. 2013;25:265–71. doi: 10.1016/j.ceb.2013.01.006. [DOI] [PMC free article] [PubMed] [Google Scholar]
- Chung WS, Shin CH, Stainier DYR. Bmp2 Signaling Regulates the Hepatic versus Pancreatic Fate Decision. Developmental cell. 2008;15:738–748. doi: 10.1016/j.devcel.2008.08.019. [DOI] [PMC free article] [PubMed] [Google Scholar]
- D’Amour KA, Bang AG, Eliazer S, Kelly OG, Agulnick AD, Smart NG, Moorman MA, Kroon E, Carpenter MK, Baetge EE. Production of pancreatic hormone-expressing endocrine cells from human embryonic stem cells. Nature Biotechnology. 2006;24:1392–1401. doi: 10.1038/nbt1259. [DOI] [PubMed] [Google Scholar]
- Delous M, Yin CY, Shin DH, Ninov N, Carten JD, Pan LY, Ma TP, Farber SA, Moens CB, Stainier DYR. sox9b Is a Key Regulator of Pancreaticobiliary Ductal System Development. Plos Genetics. 2012;8 doi: 10.1371/journal.pgen.1002754. [DOI] [PMC free article] [PubMed] [Google Scholar]
- Deutsch G, Jung J, Zheng M, Lora J, Zaret KS. A bipotential precursor population for pancreas and liver within the embryonic endoderm. Development. 2001;128:871–881. doi: 10.1242/dev.128.6.871. [DOI] [PubMed] [Google Scholar]
- Ferber S, Halkin A, Cohen H, Ber I, Einav Y, Goldberg I, Barshack I, Seijffers R, Kopolovic J, Kaiser N, Karasik A. Pancreatic and duodenal homeobox gene 1 induces expression of insulin genes in liver and ameliorates streptozotocin-induced hyperglycemia. Nature Medicine. 2000;6:568–572. doi: 10.1038/75050. [DOI] [PubMed] [Google Scholar]
- Fryer BH, Rezania A, Zimmerman MC. Generating beta-cells in vitro: progress towards a Holy Grail. Current Opinion in Endocrinology Diabetes and Obesity. 2013;20:112–117. doi: 10.1097/MED.0b013e32835edb4c. [DOI] [PubMed] [Google Scholar]
- Gangaram-Panday S, Faas MF, de Vos P. Towards stem cell therapy in the endocrine pancreas. Trends Mol. Medicine. 2007;13:164–173. doi: 10.1016/j.molmed.2007.02.002. [DOI] [PubMed] [Google Scholar]
- Gilbert SF. Developmental Biology. Sinauer Associates Inc.; Sunderland, Mass: 2010. [Google Scholar]
- Gittes GK. Developmental biology of the pancreas: A comprehensive review. Dev. Biol. 2009;326:4–35. doi: 10.1016/j.ydbio.2008.10.024. [DOI] [PubMed] [Google Scholar]
- Gouon-Evans V, Boussemart L, Gadue P, Nierhoff D, Koehler CI, Kubo A, Shafritz DA, Keller G. BMP-4 is required for hepatic specification of mouse embryonic stem cell-derived definitive endoderm. Nature Biotechnology. 2006;24:1402–1411. doi: 10.1038/nbt1258. [DOI] [PubMed] [Google Scholar]
- Grapin-Botton A, Heimberg H, Lemaigre F. The genetic programme of pancreatic beta-cells: basic science for the development of beta-cell therapy. Embo Reports. 2007;8:322–326. doi: 10.1038/sj.embor.7400944. [DOI] [PMC free article] [PubMed] [Google Scholar]
- Gurdon JB, Melton DA. Nuclear Reprogramming in Cells. Science. 2008;322:1811–1815. doi: 10.1126/science.1160810. [DOI] [PubMed] [Google Scholar]
- Horb ME, Shen CN, Tosh D, Slack JMW. Experimental conversion of liver to pancreas. Current Biology. 2003;13:105–115. doi: 10.1016/s0960-9822(02)01434-3. [DOI] [PubMed] [Google Scholar]
- Hosoya M, Kunisada Y, Kurisaki A, Asashima M. Induction of differentiation of undifferentiated cells into pancreatic beta cells in vertebrates. The International journal of developmental biology. 2012;56:313–23. doi: 10.1387/ijdb.123522mh. [DOI] [PubMed] [Google Scholar]
- Ieda M, Fu J-D, Delgado-Olguin P, Vedantham V, Hayashi Y, Bruneau BG, Srivastava D. Direct Reprogramming of Fibroblasts into Functional Cardiomyocytes by Defined Factors. Cell. 2010;142:375–386. doi: 10.1016/j.cell.2010.07.002. [DOI] [PMC free article] [PubMed] [Google Scholar]
- Kaneto H, Nakatani Y, Miyatsuka T, Matsuoka T, Matsuhisa M, Hori M, Yamasaki Y. PDX-1/VP16 fusion protein, together with NeuroD or Ngn3, markedly induces insulin gene transcription and ameliorates glucose tolerance. Diabetes. 2005;54:1009–1022. doi: 10.2337/diabetes.54.4.1009. [DOI] [PubMed] [Google Scholar]
- Kojima H, Fujimiya M, Matsumura K, Younan P, Imaeda H, Maeda M, Chan L. NeuroD-betacellulin gene therapy induces islet neogenesis in the liver and reverses diabetes in mice. Nature Medicine. 2003;9:596–603. doi: 10.1038/nm867. [DOI] [PubMed] [Google Scholar]
- Kopp JL, Dubois CL, Schaffer AE, Hao EG, Shih HP, Seymour PA, Ma JN, Sander M. Sox9(+) ductal cells are multipotent progenitors throughout development but do not produce new endocrine cells in the normal or injured adult pancreas. Development. 2011;138:653–665. doi: 10.1242/dev.056499. [DOI] [PMC free article] [PubMed] [Google Scholar]
- Kraus MRC, Grapin-Botton A. Patterning and shaping the endoderm in vivo and in culture. Current Opinion in Genetics & Development. 2012;22:347–353. doi: 10.1016/j.gde.2012.05.002. [DOI] [PubMed] [Google Scholar]
- Kubota H, Reid LM. Clonogenic hepatoblasts, common precursors for hepatocytic and biliary lineages, are lacking classical major histocompatibility complex class I antigen. Proc. Natl. Acad. Sci. USA. 2000;97:12132–12137. doi: 10.1073/pnas.97.22.12132. [DOI] [PMC free article] [PubMed] [Google Scholar]
- Kyrmizi I, Hatzis P, Katrakili N, Tronche F, Gonzalez FJ, Talianidis I. Plasticity and expanding complexity of the hepatic transcription factor network during liver development. Genes & Development. 2006;20:2293–2305. doi: 10.1101/gad.390906. [DOI] [PMC free article] [PubMed] [Google Scholar]
- Lemaigre FP. Development of the biliary tract. Mechanisms of Development. 2003;120:81–87. doi: 10.1016/s0925-4773(02)00334-9. [DOI] [PubMed] [Google Scholar]
- McKnight KD, Wang P, Kim SK. Deconstructing Pancreas Development to Reconstruct Human Islets from Pluripotent Stem Cells. Cell Stem Cell. 2010;6:300–308. doi: 10.1016/j.stem.2010.03.003. [DOI] [PMC free article] [PubMed] [Google Scholar]
- Miszta-Lane H, Mirbolooki M, Shapiro AMJ, Lakey JRT. Stem cell sources for clinical islet transplantation in type 1 diabetes: Embryonic and adult stem cells. Medical Hypotheses. 2006;67:909–913. doi: 10.1016/j.mehy.2006.03.036. [DOI] [PubMed] [Google Scholar]
- Miyatsuka T, Kaneto H, Kajimoto Y, Hirota S, Arakawa Y, Fujitani Y, Umayahara Y, Watada H, Yamasaki Y, Magnuson MA, Miyazaki J, Hori M. Ectopically expressed PDX-1 in liver initiates endocrine and exocrine pancreas differentiation but causes dysmorphogenesis. Biochem.Biophys.Res.Comm. 2003;310:1017–1025. doi: 10.1016/j.bbrc.2003.09.108. [DOI] [PubMed] [Google Scholar]
- Murtaugh LC, Melton DA. Genes, signals, and lineages in pancreas development. Annual Review of Cell and Developmental Biology. 2003;19:71–89. doi: 10.1146/annurev.cellbio.19.111301.144752. [DOI] [PubMed] [Google Scholar]
- Muzumdar MD, Tasic B, Miyamichi K, Li L, Luo LQ. A global doublefluorescent cre reporter mouse. Genesis. 2007;45:593–605. doi: 10.1002/dvg.20335. [DOI] [PubMed] [Google Scholar]
- Nishikawa S.-i., Goldstein RA, Nierras CR. The promise of human induced pluripotent stem cells for research and therapy. Nat Rev Mol Cell Biol. 2008;9:725–729. doi: 10.1038/nrm2466. [DOI] [PubMed] [Google Scholar]
- Rieck S, Bankaitis ED, Wright CVE. Lineage determinants in early endocrine development. Seminars in Cell & Developmental Biology. 2012;23:673–684. doi: 10.1016/j.semcdb.2012.06.005. [DOI] [PMC free article] [PubMed] [Google Scholar]
- Shen CN, Slack JMW, Tosh D. Molecular basis of transdifferentiation of pancreas to liver. Nature Cell Biology. 2000;2:879–887. doi: 10.1038/35046522. [DOI] [PubMed] [Google Scholar]
- Shiojiri N. Development and differentiation of bile ducts in the mammalian liver. Microscopy Research and Technique. 1997;39:328–335. doi: 10.1002/(SICI)1097-0029(19971115)39:4<328::AID-JEMT3>3.0.CO;2-D. [DOI] [PubMed] [Google Scholar]
- Si-Tayeb K, Lemaigre FP, Duncan SA. Organogenesis and Development of the Liver. Developmental Cell. 2010;18:175–189. doi: 10.1016/j.devcel.2010.01.011. [DOI] [PubMed] [Google Scholar]
- Slack JMW. Homeotic transformations in Man: implications for the mechanism of embryonic development and for the organization of epithelia. J.Theor.Biol. 1985;114:463–490. doi: 10.1016/s0022-5193(85)80179-x. [DOI] [PubMed] [Google Scholar]
- Slack JMW. Metaplasia and transdifferentiation: from pure biology to the clinic. Nature Reviews Molecular Cell Biology. 2007;8:369–378. doi: 10.1038/nrm2146. [DOI] [PubMed] [Google Scholar]
- Slack JMW. Essential Developmental Biology. Wiley-Blackwell; Oxford: 2012. [Google Scholar]
- Takahashi K, Yamanaka S. Induction of pluripotent stem cells from mouse embryonic and adult fibroblast cultures by defined factors. Cell. 2006;126:663–676. doi: 10.1016/j.cell.2006.07.024. [DOI] [PubMed] [Google Scholar]
- Teitelman G, Alpert S, Polak JM, Martinez A, Hanahan D. Precursor cells of mouse endocrine pancreas coexpress insulin, glucagon, and the neuronal proteins tyrosine hydroxylase and neuropeptide Y but not pancreatic polypeptide. Development. 1993;118:1031–1039. doi: 10.1242/dev.118.4.1031. [DOI] [PubMed] [Google Scholar]
- Vierbuchen T, Ostermeier A, Pang ZP, Kokubu Y, Südhof TC, Wernig M. Direct conversion of fibroblasts to functional neurons by defined factors. Nature. 2010;463:1035–1041. doi: 10.1038/nature08797. [DOI] [PMC free article] [PubMed] [Google Scholar]
- Weir GC, Cavelti-Weder C, Bonner-Weir S. Stem cell approaches for diabetes: towards beta cell replacement. Genome Medicine. 2011;3 doi: 10.1186/gm277. [DOI] [PMC free article] [PubMed] [Google Scholar]
- Wolpert L, Tickle C. Principles of Development. Oxford University Press; Oxford and New York: 2011. [Google Scholar]
- Xie H, Ye M, Feng R, Graf T. Stepwise reprogramming of B cells into macrophages. Cell. 2004;117:663–676. doi: 10.1016/s0092-8674(04)00419-2. [DOI] [PubMed] [Google Scholar]
- Yechoor V, Liu V, Espiritu C, Paul A, Oka K, Kojima H, Chan L. Neurogenin3 Is Sufficient for Transdetermination of Hepatic Progenitor Cells into Neo-Islets In Vivo but Not Transdifferentiation of Hepatocytes. Developmental Cell. 2009;16:358–373. doi: 10.1016/j.devcel.2009.01.012. [DOI] [PMC free article] [PubMed] [Google Scholar]
- Zaret KS, Grompe M. Generation and Regeneration of Cells of the Liver and Pancreas. Science. 2008;322:1490–1494. doi: 10.1126/science.1161431. [DOI] [PMC free article] [PubMed] [Google Scholar]
- Zhou Q, Brown J, Kanarek A, Rajagopal J, Melton DA. In vivo reprogramming of adult pancreatic exocrine cells to beta-cells. Nature. 2008;455:627–632. doi: 10.1038/nature07314. [DOI] [PMC free article] [PubMed] [Google Scholar]
- Zhou Q, Melton DA. Extreme Makeover: Converting One Cell into Another. Cell Stem Cell. 2008;3:382–388. doi: 10.1016/j.stem.2008.09.015. [DOI] [PubMed] [Google Scholar]


