

Abstract
Colorectal cancer (CRC) is the third most frequent cancer and the third leading cause of cancer deaths in the United States [1]. The major cause of death is metastasis and frequently, the target organ is the liver. Successful metastasis depends on acquired properties in cancer cells that promote invasion and migration, and on multiple interactions between tumors and host-derived cells in the microenvironment. These processes, however, occur asymptomatically, thus, metastasis remains poorly understood and often diagnosed only at the final stage. To facilitate the elucidation of the mechanisms underlying these processes and to identify the molecular regulators, particularly at the early stages, we developed a mouse model of hepatic metastasis of CRC by cecal implantation of a mouse adenocarcinoma cell line in an immune competent host that reliably recapitulates all steps of tumor growth and metastasis within a defined period. By in vivo selection, we isolated cells of varying metastatic potential. The most highly metastatic CT26-FL3 cells produced liver metastasis as early as ten days after implantation in 90% of host mice. These cells expressed elevated levels of genes whose products promote invasion, migration, and mobilization of bone marrow derived cells (BMDCs). Mice bearing tumors from CT26-FL3 had elevated serum levels of OPN, MMP9, S100A8, S100A9, SAA3, and VEGFA that promote invasion and BMDC mobilization, and showed enhanced BMDC recruitment to the liver where they established a pre-metastatic niche. This model provides an important platform to characterize metastatic cells and elucidate tumor-host interactions and mechanisms that drive liver metastasis of CRC.
Keywords: Mouse model, Colorectal cancer, Liver metastasis, In vivo selection, Host-tumor interactions
INTRODUCTION
Colorectal cancer (CRC) is the third most frequent cancer and the third leading cause of cancer deaths [1]. In the United States, approximately 143,460 newly diagnosed cases and 51,690 patient deaths from CRC were predicted in 2012 [1]. Although most CRC patients survive curative local resection of the primary tumor, the leading cause of death is metastasis. When detected at an early, localized stage, the five-year survival rate is approximately 90%; however, after metastasis has occurred, this drops to less than 12% [1]. The main target organ is the liver. Approximately 20–25% of patients with CRC present with liver metastasis at the time of diagnosis, however, autopsy results reveal that up to 70% of CRC patients had liver metastases [2].
Although tumors originate from various genetic alterations, the steps leading to metastasis are quite similar; tumor cells acquire the ability to invade and penetrate the walls of lymphatic and/or blood vessels [3]. They survive and circulate through the blood stream by evading immune surveillance. They arrest and extravasate into secondary organs where they proliferate and eventually develop into a clinically detectable lesion [3]. These complex processes depend on multiple interactions between cancer cells in the tumor and host derived cells in the microenvironment in both the primary tumor and secondary organ, however, they often occur undetected in the patient [4]. Thus, in spite its devastating impact, metastasis continues to be diagnosed at its final stage when little can be done, and the underlying mechanisms, particularly in the early stages, are still poorly understood. Recent studies have shown that multiple factors secreted by the primary tumor direct the mobilization of host derived cells to the secondary organ, even prior to the arrival of metastatic cells, to create a permissive environment that promotes their proliferation [5]. Identifying these molecules and the pathways that they regulate could lead to the development of more accurate methods of early detection and intervention in the metastatic progression.
Elucidating the genetic and molecular mechanisms underlying the cross talk between the primary tumor and target organ environment at the early steps of metastasis requires a mouse model that can reliably recapitulate all stages from the growth of the primary tumor to proliferation in the secondary organ. For studies in CRC, many useful genetic models of benign adenomas have been developed, and in a number of models, CRC can advance to the locally invasive stage (reviewed in [6], [7] and [8]). However, none of these spontaneously progress to the invasive stage and metastasize to the target organs of CRC such as the liver, lymph nodes, and lungs [6]. To experimentally address specific aspects of metastatic dissemination and colonization of relevant organs, appropriate xenograft or orthotopic transplantation models have been utilized. For example, human colon cancer cell lines or tumor tissue fragments have been transplanted into nude or NOD-SCID mice either subcutaneously or in the cecum [7, 9, 10]. Metastasis to the liver has been studied by injection of cancer cell lines into the spleen, portal vein, or directly into the liver in either immunocompromised or syngeneic mouse models [6, 11]. These, however, skip the steps of tumor growth and establishment of the pre-metastatic niche (PMN) and are thus limited with respect to identifying molecular and genetic factors that facilitate the cross-talk between primary tumor and target organ environment at the early stage. Furthermore, immunocompromised mice lack an intact immune system from which many of the cells that mediate these interactions are derived. Although convenient, subcutaneous injection does not give rise to metastases in the liver or other organs. Liver metastases occurred when human or mouse cancer cell lines or tissues were implanted into the cecum or rectum of immunocompromised or syngeneic host strains, however, it was observed in only 10–20% of the hosts [12]. The frequency could be increased by serial passaging of cell lines in both immune-deficient or syngeneic host mice [12–15]. In this study, we developed a mouse model that can reliably give rise to liver metastases in immune-competent syngeneic hosts by cecal implantation of a well characterized mouse cancer cell line, CT26. We used this model to isolate colon cancer cell lines with varying potentials for liver metastasis and further combined it with transplantation of fluorescently labeled hematopoietic stem cells (HSCs) to allow interrogation of tumor interactions with host stromal cells that are critical in the early stage. We characterized these cell lines with respect to their invasiveness, ability to influence the host microenvironment, and to mobilize BMDCs to the target organ environment to promote liver metastasis.
MATERIALS AND METHODS
Cell culture
The Balb/c-derived mouse colon carcinoma cell line CT26 was purchased from American Type Culture Collection (ATCC), and cultivated in Dulbecco’s Modification of Eagle’s Medium (DMEM) with 4.5 g/L glucose (Mediatech, Manassas, VA) supplemented with 10% fetal bovine serum (FBS) (Atlanta Biologicals, Lawrenceville, GA) and 1% Penicillin/Streptomycin (Pen/Strep, Mediatech, Manassas, VA) at 37°C and 5% CO2 in a humidified atmosphere. Transfection of cell lines was performed using Lipofectamine 2000 (Invitrogen, Grand Island, NY) following manufacturer’s instructions. CT26 cells were stably transfected with pGL4.13-mCherry-Hygro vector containing the mCherry red fluorescent protein (RFP) and the hygromycin resistance gene. Stable transfectants were selected in the presence of 50 μg/ml hygromycin B (Hygrogold, Invivogen, San Diego, CA).
Mice
CByJ.B6-Tg (UBC-GFP) 30Scha/J mice expressing enhanced green fluorescent protein (eGFP) under the control of the ubiquitin promoter were used as donors for bone marrow transplantation (BMT). Balb/cByJ mice were used as BMT and orthotopic allograft recipients. Both strains were purchased from Jackson Laboratories (Bar Harbor, ME) but were bred and maintained at the Mouse Experimentation Core Facility of the Center for Colon Cancer Research at the University of South Carolina (USC), Columbia, SC. All animal experiments were conducted according to the guidelines and approval of USC Institutional Animal Care and Use Committee.
Orthotopic allografting in Mice
For cecal implantations, sub-confluent cells were harvested and washed in phosphate buffered saline (PBS) just prior to implantation. Eight-week-old male BALB/cByJ mice were anesthetized by inhalation of 2% isoflurane in oxygen and placed in supine position. A midline incision was made to exteriorize the cecum. Using a 33-gauge micro-injector (Hamilton Company, Reno, NV), 2×10⁶ cells in 10–15 uL were injected into the cecum subserosal. The injection site was sealed with a tissue adhesive (3M, St. Paul, MN) and sterilized with 70% alcohol to kill cancer cells that may have leaked out. The cecum was replaced in the peritoneal cavity, and the abdominal wall and skin closed with 6-0 polyglycolic acid sutures (CP Medical, Portland, OR). Sham control mice underwent similar surgery, but no cells were implanted into the cecum.
Bone marrow isolation and transplantation
Four-week old male CByJ.B6-Tg(UBC-GFP)30Scha/J donor mice were anesthetized with isoflurane by inhalation and humanely sacrificed. Bone marrow (BM) cells were flushed from femur and tibia using a 21-gauge needle into PBS containing 2% FBS. Age-matched male Balb/cByJ recipient mice were total body irradiated with 950 rads administered at 200 rads/minute in a Varian Clinac linear accelerator. This dose is myeloablative and lethal to the mice unless they are reconstituted by BM transplantation. 3–5×10⁶ mono-nucleated cells were transplanted into the recipient mice by tail vein injection. Transplanted mice were administered sterile water containing 0.018% Baytril antibiotic (Bayer, Shawnee, KS) for two weeks post-transplantation to prevent infection. To assess BM engraftment, peripheral blood was drawn from the retro-orbital sinus of recipient mice at 4 weeks post-transplant. Red blood cells were lysed with ammonium chloride lysis buffer (150mM NH4CL, 10mM Na2CO3, 0.1 mM EDTA, pH 7.4). Leukocytes were then incubated with PE-Cy5 conjugated anti-CD45 antibody (BD Pharmingen, San Diego, CA), and analyzed in a Beckman Coulter Epics-XL Flow Cytometer and CXP analysis software.
Establishment of tumor cell lines
Tumor specimens were excised from Balb/cByJ mice that were implanted with CT26 cells subcutaneously, in the cecum, or from liver metastases. They were dissected free of necrotic areas, connective tissue, and blood clots then rinsed 3 times with cold (4°C) DMEM containing 1% FBS and 2% Pen/Strep. Tissues were sliced into 1–3 mm3 fragments and then subjected to sequential enzymatic digestion for 30 minutes each at 37°C in DMEM containing collagenase type I (200 units/ml), DNase (270 units/ml), or hyaluronidase type IV (35 NF units/ml) (Sigma, St. Louis, MO). The resulting cell suspension was maintained at 4°C, filtered through a 70 μm nylon cell strainer (BD Biosciences, Bedford, MA), washed in PBS, and then grown in culture as described above.
Cell proliferation assay and In vivo monitoring of tumor growth
To determine the growth rate of CT26 and CT26-FL3 in culture, 10,000 cells in 2 ml of DMEM with 10% FBS were plated per well in 6-well plates. The number of cells was counted after incubation for 3 to 8 days at 37°C. Assays were performed in triplicate and repeated three times. To monitor tumor growth, cells (2×10⁶ in 100 μl) were injected subcutaneously into BALB/cByJ mice. Tumor size was measured with calipers and tumor volume (mm3) was calculated as width2 × length/2 as describe previously by Ijichi H. et al. [16]. Measurements were taken from four mice per group and repeated three times.
Boyden Chamber cell invasion and wound healing assays
The ability of CT26 and CT26-FL3 cells to invade through Matrigel-coated filters was measured using transwell chambers (Costar, Cambridge, MA) with polycarbonate membranes (8.0-μm pore size) coated with 100 μl Matrigel (BD Biosciences, Bedford, MA) on the top side of the membrane. The upper surface of the matrix was challenged with 10,000 cells in serum-free medium containing 0.1% bovine serum albumin (BSA). The lower chamber contained medium supplemented with 10% FBS. After 16 hours, the cells were stained with 0.1% crystal violet solution. Cells and Matrigel on the upper surface of the membrane were removed carefully with a cotton swab. Cells that invaded through the matrix were visually counted at five randomly chosen field views. Each experiment was performed in triplicate wells and repeated three times.
For the wound healing assay, confluent monolayers of CT26 and CT26-FL3 cells in 6-well plates were wounded with a sterile 200 μl pipet tip and incubated with DMEM containing 1% FBS. Representative fields of monolayers containing wounds of the same width were photographed at 40× magnification after incubation for 1–4 days at 37°C in a humidified CO2 atmosphere. The extent of wound repair was evaluated by measuring the area of the wound using Image J software (NIH, Bethesda, MD). Each experiment was performed in quadruple wells and repeated three times.
Histology
Tumor-bearing mice were humanely sacrificed and the entire intestine, primary cecal tumor, and liver were excised, fixed in freshly prepared 4% paraformaldehyde in PBS, pH 7.2. Tissue blocks were embedded in paraffin, 5 μm sections obtained and then stained with hematoxylin and eosin (H&E) (VWR, West Chester, PA) for visual examination. The stained slides were reviewed and screened for representative tumor regions by a pathologist.
Immunohistochemistry
Paraformaldehyde-fixed, paraffin-embedded tissue sections were deparaffinized, rehydrated, then incubated in a microwave oven with 0.01M citrate buffer, pH 6.0 for 10 minutes for antigen retrieval. Endogenous peroxidases were blocked with 3% H2O2 for 15 min. Nonspecific epitopes were blocked with normal horse serum (Jackson ImmunoResearch, West Grove, PA) for 1 hour. The sections were incubated overnight at 4°C with antibodies against one of the following proteins: proliferating cell nuclear antigen (PCNA, 1:300 dilution), matrix metalloproteinase 9 (MMP9), matrix metalloproteinase 2 (MMP2), vascular endothelial growth factor (VEGF), VEGF receptor 1 (VEGF-R1), S100A8 (all from Abcam, Cambridge, MA), lysyl oxidase (LOX), c-MYC, Cyclin-D1 (CCND1) (all from Santa Cruz Biotechnology, Santa Cruz, CA), S100A9 (R&D Systems, Minneapolis, MN; all at 1:100 dilution). This was followed by incubation with the secondary antibody conjugated to horseradish peroxidase (HRP) (Bio-Rad, Hercules, CA) for 1 hour at room temperature (RT). Antigen signals were detected using the 2-Solution Diaminobenzidine (DAB) Kit (Invitrogen, Frederick, MD), counterstained with hematoxylin, mounted in Acrymount (StatLab, Mckinney, TX), and visualized under a light microscope.
Confocal microscopy
The liver was excised from sham control and CT-26 or CT26-FL3-tumor bearing Balb/cByJ mice, then fixed in freshly prepared 4% paraformaldehyde in PBS, pH 7.2. The tissues were then rinsed with PBS, embedded in 13% acrylamide, and vibratome sections cut at 100 μm thickness. Samples were stained with phalloidin conjugated to Alexa 633 (Invitrogen, Carlsbad, CA, 1:100 dilution) to visualize tissue morphology. Cells and primary tumors from CT26 or CT26-FL3 were stained with antibodies against E-cadherin, Fibronectin, Vimentin, and β-catenin conjugated to FITC or Cy5 (all from Cell Signaling Technology, Danvers, MA). Nuclei were stained with 1:10,000 dilution of 4′,6-diamidino-2-phenylindole (DAPI) (Invitrogen, Carlsbad, CA). Stained samples were imaged on a Zeiss LSM510 META confocal scanning laser microscope.
Western Blotting
Sera from CT26- and CT26-FL3- tumor bearing mice were analyzed by immunoblotting. Antibodies against the following proteins were used as probes: MMP9, VEGF (both from Abcam, Cambridge, MA), osteopontin (OPN), serum amyloid A3 (SAA3), S100A8, S100A9 (all from Santa Cruz Biotechnology, Santa Cruz, CA). The blots were incubated with primary antibody (1:1000) overnight at 4°C, washed three times with PBS/0.01% Triton X-100, followed by HRP-conjugated secondary antibody (Bio-Rad, Hercules, CA)(1:5000) for 1 hour at room temperature. The blots were visualized using an ECL enhanced chemiluminescence kit (GE Healthcare, Piscataway, NJ). As internal controls for equal protein loading, blots were stripped and probed with antibodies against albumin (Santa Cruz Biotechnology, Santa Cruz, CA).
RNA isolation and quantitative reverse transcription polymerase chain reaction (qRT-PCR)
Total RNA was isolated from CT26 and CT26-FL3 cells using RNeasy RNA isolation kit (Qiagen, Valencia, CA). cDNA was synthesized from total RNA using a cDNA synthesis Kit (Bio-Rad, Hercules, CA). qRT-PCR was performed on an iCycler iQ5 PCR Thermal Cycler using SYBR green supermix (Bio-Rad, Hercules, CA). Validated gene specific primer sets for hepatocyte growth factor (Hgf), interleukin 6 (Il-6), tumor necrosis factor-alpha (Tnf), interferon-gamma (Ifng), colony stimulating factors 2 and 3 (Csf1 and Csf3), Cxcl1, Cxcl4, Cxcl11 and β-actin (Actb) were obtained from RealTimePrimers (Elkins Park, PA). β-actin was used for normalization. Assays were run in five replicates.
Statistical Analysis
Data were expressed as the mean ± standard deviation (SD). Statistical analysis was performed by the Students’ t-test when only two value sets were compared, and one-way analysis of variance (ANOVA) followed by Dunnett’s test when the data involved three or more groups. P<0.05, P<0.01 or P<0.001 was considered statistically significant and indicated by *, ** or ***, respectively.
RESULTS
Isolation of cells with high incidence of spontaneous liver metastasis by in vivo selection
When injected subcutaneously into Balb/cByJ mice, CT26 mouse adenocarcinoma cells, expressing the mCherry RFP, formed tumors in all mice injected but no liver metastasis was observed. When injected into the tail vein, tumors formed in the lungs, but no liver metastasis was observed. On the other hand, when 2 × 10⁶ CT26 cells were orthotopically injected subserosal into the cecum of Balb/cByJ mice as described, 100% of injected mice developed primary colonic tumors, appearing as small white neoplasms within one week, but only 8% of the mice (2 out of 25) developed spontaneous liver metastases after 4–8 weeks of tumor growth. The kinetics of primary tumor progression in the cecum was similar in all mice.
To increase the frequency of metastases to the liver, a process of in vivo selection was applied to derive highly liver metastatic colon cancer cells from the CT26 parental cell line. 2×10⁶ CT26 cells were first injected subcutaneously into Balb/cByJ mice. After 2 weeks, recipient mice were sacrificed, tumor tissues were excised and treated with digestive enzymes to obtain a single cell suspension. After temporary culture in media to remove cell debris and red blood cells, the purified cells, named CT26-F1 were implanted into cecum of BALB/cByJ mice. After four weeks, primary cecal tumor growth was observed in all mice, and 40% (10 out of 25) of the mice developed liver metastases. Tumor tissues were excised from the metastatic lesions in the liver, digested to obtain a single cell suspension, grown in culture, and then injected into the cecum of new recipient mice. This cycle was repeated three times as shown in Fig. 1a. After three rounds of in vivo selection, a liver, highly-metastatic colon cancer cell line named CT26-FL3 was obtained, which gave rise to 90% frequency of liver metastasis (23 out of 25 mice), approximately 10-fold higher compared to that in mice injected with the parental CT26 cell line (Fig. 1b). During autopsy, a single nodular tumor localized in the cecum was observed in animals implanted with CT26 or CT26-FL3 cells (Fig. 1c), while no tumor growth was detected in mice injected with PBS into the cecum in sham surgery controls. In mice injected with CT26, few nodules (2–4) were observed in the liver of mice with metastasis within 4–6 weeks after cecal implantation (Fig. 1d–e). On the other hand, multiple nodular tumors were found in the liver of mice implanted with CT26-FL3 (Fig. 1f–g) within 4 weeks of cecal implantation. Thus, mice implanted with CT26-FL3 had a higher frequency of metastasis and a higher number of metastatic lesions in the liver within a defined period after cecal implantation. In addition, typical clinical symptoms associated with advanced disease were observed such as weight loss, splenomegaly, cramping pain, internal hemorrhage, and cachexia that are consistent with the pathology of CRC in human patients (data not shown).
Fig. 1.

Establishment of an orthotopic mouse model of CRC with high frequency of spontaneous liver metastasis by in vivo selection. a 2 × 10⁶ CT26 cells were injected into the flank of Balb/cByJ mice; tumors were excised and digested to a single cell suspension to generate CT26-F1 cell line, grown in culture, and then 2 × 10⁶ cells were injected into the cecum. Three rounds of sequential selection were performed as described in Materials and Methods to obtain the highly metastatic CT26-FL3 cell line, b Tumors from CT26 and CT26-FL3 cells gave rise to 8 and 90% frequency of liver metastasis, respectively, c representative intestinal section showing a single primary tumor in the cecum at four weeks post-implantation, d and e few metastatic lesions are observed in liver of mice bearing tumors from CT26 cells, f and g multiple metastatic nodules were observed in liver of mice bearing tumors derived from CT26-FL3 cells
We analyzed the histopathology of tissues from the primary tumor in the cecum and metastatic lesions in the liver of mice implanted with CT26-FL3, by staining formalin-fixed, paraffin-embedded sections with hematoxylin and eosin (H&E). Histopathological analyses showed a typical, hyper-cellular solid carcinoma with high grade atypia and frequent mitosis in the tumor cells in both primary (Fig. 2a, indicated by T) and hepatic metastatic tumors (Fig. 2b, indicated by M). Interestingly, we observed a prominent infiltration of leukocytes or BMDCs (indicated by black arrows) at the invasive margin of the primary tumor or metastatic lesion (Fig. 2c and 2d). This was also indicated by the infiltration of GFP positive BMDCs into metastatic lesions as shown in Fig. 5c and 6a. In addition to the visible nodules, micrometastatic lesions were detected in the liver (Fig. 2d). Very few (2–4) metastatic lesions were observed in mice implanted with the parental CT26 cell line that had liver metastasis.
Fig. 2.

Histopathological analyses of primary tumor from the cecum and metastatic tumors from the liver. H & E stained sections from a primary tumor (T) in the cecum, b metastatic tumor in the liver (M), c abundant leukocyte infiltration at the invasive front of the primary tumor (indicated by arrow) and in d micrometastasis in liver (M), e Immunohistochemical staining of formalin-fixed paraffin embedded primary tumor sections from mice bearing tumors from CT26 (left panel) or CT26-FL3 (right panel) cells with antibodies against PCNA, Cyclin D1, c-Myc, MMP2, MMP9, and VEGF. Images are shown at ×200 magnification
Fig. 5.

Expression of pro-metastatic proteins and genes in CT26, CT26-F1, and CT26-FL3 cells. a Sera taken from mice bearing tumors from CT26 or CT26-FL3 cells at four weeks after cecal implantation were analyzed by Western blotting. Blots were probed with antibodies against MMP9, OPN, VEGF-A, S100A8, S100A9, and SAA3. The fold-increase of each protein in CT26-FL3 as compared to CT26 was quantitated by Image J image analysis software. b Total protein extracts from CT26, CT26-F1, and CT26-FL3 cells were analyzed by Western blotting. Blots were probes as in a. c mRNA levels of Mmp9, Opn, Vegf-a, S100A8, S100A9, and Saa3 in CT26, CT26-F1, and CT26-FL3 were measured by qRT/PCR. The mRNA expression levels were normalized against β-actin mRNA. d Immunohistochemical analysis of sections from primary cecal tumors derived from CT26 and CT26-FL3 using antibodies against S100A8 or S100A9. Blue=tumor cells, Brown=S100A8 or S100A9. e mRNA expression levels of Hgf, Il6, Tnf-a, Ifn-g, Csf2, Csf3, Cxck1, Cxcl4, and Cxcl11 were measured by qRT/PCR. The mRNA expression level of each cytokine or growth factor in CT26-FL1 and CT26-FL3 was normalized to the measured level in CT26 cells which was set at 1.
Fig. 6.
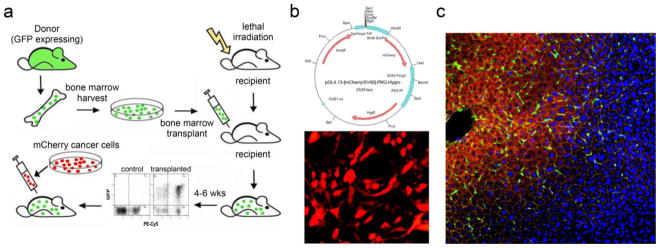
Scheme for combining cecal implantation with BMT to visualize interactions between tumor and BMDCs. a Bone marrow from transgenic mice expressing GFP was transplanted into lethally irradiated 4-week old recipient Balb/cByJ mice. Six weeks after BMT, when transplanted marrow was fully engrafted, CT26 or CT26-FL3 cells stably transfected with the mCherry RFP were injected into the cecum and allowed to grow and metastasize, b Plasmid map of vector expressing mCherry-RFP (upper panel) and representative confocal microscopy image of stably transfected CT26 cells (lower panel), c Representative confocal microscopy image of an established metastatic tumor in the liver after invading the hepatic lobule and colonizing the central vein. Red = CT26-FL3 cells expressing mCherry-RFP, Green = GFP positive BMDCs, Yellow = actin, blue = DAPI (×100 magnification)
Sections from primary cecal tumors derived from CT26 or CT26-FL3 cells were examined by immunohistochemistry for expression of biomarkers associated with proliferation, invasion, and angiogenesis such as PCNA, Cyclin-D1, c-MYC, MMP9, MMP2, and VEGF. The results in Fig. 2e, show that these proteins were more highly expressed in primary tumors from CT26-FL3 as compared to those from CT26 cells. Collectively, these data indicated that by in vivo selection, we have established a predictable mouse model of CRC with a high frequency of hepatic metastasis within a defined time-frame, and isolated two isogenic cell lines, CT26-F1 and CT26-FL3, that have increasing potentials for hepatic metastasis as compared to the parental cell line.
Comparison of proliferation, invasion, and migration of CT26 and CT26-FL3 cell lines
We further characterized CT26-FL3 by comparing its growth rate to the parental CT26 cells in vitro in cell culture and in vivo by subcutaneous injection into the flank of Balb/cByJ mice. The results showed that CT26 cells grew faster when grown in tissue culture (Fig. 3a). On the other hand, when equal numbers of cells were injected into the flank of Balb/cByJ mice, tumor growth from CT26-FL3 was faster as compared to that from CT26 cells (Fig. 3b). We compared their invasive properties using a matrigel transwell invasion assay. The results show that CT26-FL3 cells are approximately five-fold more invasive than the CT26 cells (Fig. 3c). Using a wound healing assay, we found that CT26-FL3 had a higher ability for migration compared to the CT26 cell line (Fig. 3d). In summary, these results indicate that the CT26-FL3 cells have enhanced capabilities for proliferation, migration, and invasion that most likely account for its enhanced ability to metastasize to the liver in host mice. Its faster growth in vivo also suggests that the CT26-FL3 cells can better adapt to the surrounding microenvironment, possibly as a consequence of serial in vivo passaging, due to enhanced capabilities for interacting with cells in the host microenvironment as compared to CT26 cells.
Fig. 3.

Assessment of proliferation, invasion, and migration of CT26 and CT26-FL3 cells. a Proliferation of CT26 and CT26-FL3 in tissue culture, b Growth of tumors derived from 2 × 10⁶ CT26 or CT26-FL3 cells injected into the flank of Balb/cByJ mice, c Invasion of CT26 and CT26-FL3 cells through matrigel-coated transwells, d Migration of CT26 and CT26-FL3 cells in a wound healing assay
A critical step during the invasive phase of metastasis is the activation of embryonic transcription programs that enable epithelial cancer cells to convert to cells with mesenchymal properties [17, 18]. This epithelial to mesenchymal transition (EMT) allows the cells to undergo biochemical changes that result in reduced intercellular adhesion, loss of polarity, enhanced migratory capacity and invasiveness, as well as resistance to apoptosis and enhanced production of extracellular matrix components [17]. EMT is accompanied by loss of epithelial markers and acquisition of mesenchymal cell markers. We examined the CT26 and CT26-FL3 cell lines and primary tumors from these cells for expression of E-cadherin, an epithelial cell marker, and fibronectin, vimentin, and β-catenin, markers that are associated with mesenchymal cells, as well as differences in cell morphology. The results showed that when grown in cell culture, there are no differences in the cell morphologies of CT26 and CT26-FL3 cells. Both cell lines expressed all the markers examined at elevated levels, suggesting that they have the capability to switch from the epithelial to mesenchymal state that is required for metastasis (Fig. 4, columns a and b). In contrast, tumors from CT26-FL3 expressed much higher levels of markers associated with mesenchymal cells (Fig. 4, columns c and d), supporting data indicating their enhanced migratory and invasive properties. Expression of B-catenin is particularly elevated in CT26-FL3 both in cell culture and in primary tumors; this correlates with the enhanced expression of c-Myc, Cyclin-D1, and VEGF that are among its target genes in human colon cancers.
Fig. 4.

Assessment of epithelial to mesenchymal transition markers in CT26 or CT26-FL3 cells and tumors. Cells were grown in slide chambers and examined for morphology (a and b). Primary tumor sections were taken from cecum of mice implanted with CT26 or CT26-FL3 cells (c and d). Cells and tumor sections were the stained with antibodies against E-cadherin, an epithelial cell marker or Fibronectin, Vimentin and β-catenin, markers found in mesenchymal cells. Column a CT26 cells, Column b CT26-FL3 cells; Red=protein marker, Blue=DAPI. Column c primary tumor from CT26 cells Column d primary tumor from CT26-FL3 cells; Red=Tumor cells, Green=protein marker, Blue=DAPI.
Tumors from CT26-FL3 induce secretion of proteins that promote metastasis
To determine the influence of tumors originating from the CT26 or CT26-FL3 cell lines on the host environment, we harvested blood serum from tumor bearing mice and determined the levels of proteins that are typically associated with invasion, signaling, angiogenesis, or establishment of the PMN such as MMP9, OPN, VEGF, the chemokines S100A8 and S100A9, and SAA3 protein [19–23] by Western blotting using albumin (ALB) as a loading control. The results showed that these proteins were expressed at higher levels in sera from mice bearing tumors from CT26-FL3 cells (Fig. 5a). Interestingly, the sera from these mice contained 27.5-fold higher levels of S100A8, a chemokine that has been shown to promote the establishment of the PMN and to activate critical genes and pathways that promotes colon tumor growth and metastasis [20, 23].
To determine the source of these proteins, we measured their expression in CT26, CT26-F1, and CT26-FL3. Visual examination of immunoblots of total protein extracts indicate that the relative intracellular levels of these proteins did not change significantly in cancer cells with increasing metastatic potential (Fig. 5b). Because these proteins are secreted, we measured mRNA expression levels in these cells by qRT-PCR. The results showed that, consistent with their increased serum levels, mRNA levels of Mmp9, Opn, Vegf-a, and Saa3 increased by approximately 5- to 8-fold between CT26 and CT26-FL3 cells, with intermediate expression levels in CT26-F1 (Fig. 5c). In contrast, mRNA levels of S100A8 and S100A9 remain unchanged as metastatic potential increased in spite of the 27- and 3-fold increase in serum levels, respectively (Fig. 5c). These data suggest that MMP9, OPN, VEGF-A, and SAA3 are in part, secreted by the highly metastatic tumors into circulation, while S100A8 and S100A9 are most likely derived from host cells infiltrating into the tumor. Immunohistochemical analyses showed that tumors from CT26-FL3 are more highly infiltrated by cells expressing S100A8 or S100A9 (Fig. 5d) as compared to tumors from CT26 cells.
The creation of a permissive microenvironment requires the ability to recruit non-neoplastic host derived cells into the tumor stroma where they play an important role in promoting tumor growth and progression to metastasis [5, 24]. These include BMDCs such as neutrophils, monocytes, macrophages, and other leukocytes. We compared the potential ability of CT26, CT26-FL1 and CT26-FL3-derived tumors to mobilize BMDCs to the primary tumor by measuring the mRNA levels of cytokines and growth factors that are thought to mediate the crosstalk between neoplastic cells in the primary tumor and stromal cells in the microenvironment. As shown in Fig. 5e, CT26-FL3 cells express significantly higher levels of the Hgf, Il6, Tnf, Ifn, Csf2 and Csf3, and the cytokines Cxcl1, Cxcl4, and Cxcl11. These data suggest that CT26-FL3 could be more proficient in mobilizing stromal cells that promote a pro-metastatic host environment as compared to CT26 or CT26-FL1 cells. It should be noted that the CT26-FL1 and CT26-FL3 cells used in these analyses were obtained from metastatic lesions in the liver after one or three sequential passages through the liver. The tumors were debulked into single cell suspensions and briefly grown in culture to remove contaminating stromal cells. Interestingly, CT26-FL1 expressed 35- and 3-fold higher levels of Hgf as compared to CT26 and CT26-FL3, respectively, after a single passage through the liver. It is tempting to speculate that CT26-FL1 might require higher levels of HGF for specific homing to the liver in the first round of metastasis, but enhanced expression of other genes in the highly metastatic CT26-FL3 might not necessitate the same levels of HGF after repeated passaging through the liver.
BMDCs are recruited to the liver microenvironment prior to metastasis
It was previously shown that prior to the arrival of metastasizing melanoma and Lewis lung carcinoma (LLC) cells, BMDCs were recruited to the lung microenvironment to create a PMN where metastatasizing cells can attach and proliferate [5, 25]. In the previous section, we showed that CT26-FL3 cells over-express cytokines and growth factors that induce the mobilization of a variety of BMDCs. Here, our goals were to determine if a PMN is established in the liver prior to the arrival of metastatic colon cancer cells, to examine the proficiency of tumors from CT26 and CT26-FL3 cells in recruiting BMDCs to the liver, and to enhance our model so that it can be used to facilitate the characterization of interactions between tumor cells and BMDCs that are essential for invasion and metastasis. We combined the cecal implantation with transplantation of BM cells expressing eGFP (Fig. 6a). Interactions between tumor cells expressing the mCherry RFP (Fig. 6b) and BMDCs expressing eGFP can then be visualized by confocal microscopy or quantitated by flow cytometry. Recipient Balb/cByJ mice were lethally irradiated and transplanted with whole BM from donor Balb/cByJ-UBC-GFP mice. Analyses of peripheral blood by flow cytometry at 4 weeks post-transplant showed that transplanted marrow successfully engrafted, with approximately 86 to 98 percent of leukocyte cells expressing eGFP (Fig. 6a). Similar results were observed when leukocytes were stained with antibodies that specifically detect B lymphocytes, monocytes, or macrophages (data not shown). A typical image of a metastatic lesion in the liver showed that tumors (red) were abundantly infiltrated by BMDCs (green) indicating a close interaction between these cells (Fig. 6c). Thus, combining cecal implantation and BMT can be used to track the interactions between cancer cells and host-derived BMDCs at various stages of CRC metastasis to the liver.
We determined if tumors from CT26 and CT26-FL3 cells can induce the mobilization of BMDCs to the liver prior to the arrival of metastatic cells. Two million RFP-labeled cancer cells were implanted into the cecum of Balb/cByJ mice transplanted with eGFP-expressing BM. Liver sections were examined by confocal microscopy for the presence of eGFP-positive BMDCs at weekly time points after implantation. A representative result taken from mice transplanted with CT26-FL3 cells is shown in Fig. 7a (upper panel). One week after cecal implantation, very few green cells were observed in the liver sections. However, the number of eGFP positive infiltrating BMDCs increased between two to three weeks after tumor implantation before the establishment of metastatic lesions (Supplementary Fig. 1). At this time, RFP-expressing tumor cells were first detected in the liver. After four weeks, metastatic lesions (red) were formed and numerous eGFP-positive BMDCs were observed at the invasive front and infiltrating the lesion. After five weeks, when the metastatic lesions were fully established, numerous eGFP-positive BMDCs were mostly found at the invading front of the lesions. In general, BMDC infiltration was observed as early as seven days, while red fluorescent tumor cells had been detected as early as 10 days post implantation of CT26-FL3 cells. On the other hand, BMDC infiltration in mice implanted with CT26 cells was typically observed after two weeks, and tumor cells were detected after three to four weeks (Fig. 7a, middle panel). Development of metastatic lesions occurred after four to as much as eight weeks post CT26 implantation and was found in only 8% of implanted mice. No BMDCs were found in the liver of control mice that had undergone sham surgery (Fig. 7a, lower panel). These results not only confirm that the primary tumor can affect the host liver microenvironment, they also show the enhanced ability of CT26-FL3 cells to recruit BMDCs to initiate the establishment of what is potentially the PMN in the liver prior to the arrival of metastasizing tumor cells.
Fig. 7.

Migration of BMDCs and cancer cells into the liver after cecal implantation. a Representative confocal microscopy images showed that BMDCs migrated into the liver after cecum implantation before the arrival of CT26-FL3 tumor cells (upper panel) or CT26 tumor cells (middle panel). The images were taken at weekly intervals from 1 to 5 or 7 weeks after implantation. BMDCs and tumor cells were not detected in liver of control, sham injected animals at the same time points (bottom panel). Red=CT26-FL3 expressing mCherry-RFP, Green=eGFP positive BMDCs, blue=DAPI (×10 magnification) b Immunohistochemical analysis of liver sections from mice bearing CT26-FL3 derived tumors. Sections were taken at 2.5 weeks after cecal implantation and stained with primary antibodies against VEGF-R1, S100A8, S100A9, and LOX, followed by HRP-conjugated secondary antibody, visualized by DAB detection kit and then counterstained with hematoxylin. Upper panel are sections taken from control sham-injected mice while lower panel shows images taken from liver of tumor-bearing mice (×400 magnification)
To further establish the creation of the PMN, liver sections taken at 2.5 weeks after cecal implantation of CT26-FL3 cells were analyzed by immunohistochemistry to determine the presence of molecules that have been implicated in its formation such as VEGFR1, S100A8, S100A9, and LOX [25–27]. The results in Fig. 7b (lower panel) indicate that BMDCs expressing VEGFR1, as well as S100A8, S100A9, and LOX aggregated in the liver prior to the arrival of CT26-FL3 cells. These molecules were not detected in liver sections taken from control, sham injected mice (Fig. 7b, upper panel). Co-localization studies in liver from tumor bearing mice transplanted with eGFP-expressing BM showed that VEGFR1, S100A8 and S100A9 are expressed by infiltrating BMDCs (Supplementary Fig. 2). In contrast, we found diffused basal levels of LOX in normal hepatocytes, very high levels in liver of tumor bearing mice, and its expression was not associated with infiltrating BMDCs. Together, these data confirm that prior to the arrival of cancer cells, the primary tumor can direct the recruitment of BMDCs to the liver, and that the CT26-FL3 cells are more proficient than CT26 cells in this process.
DISCUSSION
Understanding the molecular, cellular, and genetic factors that promote the metastasis of CRC to the liver requires a mouse model that can reproducibly recapitulate all steps, from the growth of the primary tumor to the development of metastatic lesions. This is particularly important in elucidating the mechanisms at the early steps of metastasis that has remained poorly understood because of the lack of detectable symptoms as it progresses in the patient. Understanding these mechanisms could lead to the identification of critical molecular mediators that may serve as biomarkers for early diagnosis or as therapeutic targets at a critical stage where intervention can potentially alleviate morbidity or mortality from metastatic disease.
Successful metastasis requires the completion of multiple complex steps that depend on numerous interactions between tumor cells and the host microenvironment [3, 4]. As early as the 19th century, Stephen Paget’s “seed and soil” hypothesis proposed that factors in the microenvironment and mechanical forces in circulation are important determinants in the organ specific dissemination of metastasis [28, 29]. Recent studies re-examining this hypothesis have shown that successful engraftment and proliferation of tumor cells (the seed) at specific sites (the soil) is determined both by the intrinsic properties of metastatic cells and that of the host microenvironment [29]. Through genetic and epigenetic changes, cancer cells in the primary tumor acquire properties necessary for progression to metastasis [28, 30]. Concurrently, a fertile and permissive microenvironment must also be established in the secondary site so that tumor cells can engraft and proliferate after extravasation [28]. This PMN is assembled in the target organ prior to the arrival of tumor cells by soluble factors secreted by the primary tumor that initiate the recruitment of cells that are mostly derived from hematopoiesis. They form clusters where tumor cells can attach and then subsequently provide the support to allow their proliferation [25, 31]. Elucidating the metastatic process therefore requires a full understanding of the properties of tumor cells and the host-derived cells in the microenvironment that participate in the intricate crosstalk that is essential for its progression and a mouse model that can reliably reproduce these steps within a defined period.
In this study, we sought to develop a mouse model of CRC with a high frequency of liver metastasis within a defined time frame in a host with an intact immune system. The model should allow examination of the properties of metastatic cells as well as the interactions between BMDCs in the microenvironment around the primary tumor and the site of metastasis, particularly at the early stages, thereby providing a platform for the identification of molecular and cellular mediators of liver metastasis of CRC. Previous studies have shown that orthotopic implantation of human colon cancer cell lines or tissues into the cecum of immune-deficient mice can result in spontaneous metastasis to the liver [32, 33], however the frequency was typically very low. This frequency can be increased by repeated passaging of metastatic cells from the liver by implantation into the cecum of new host mice [15, 32, 34, 35]. In this study, we injected the CT26 mouse colon adenocarcinoma cell line into the cecum of syngeneic Balb/cByJ mice to establish an orthotopic model of hepatic metastasis of CRC in an immune competent host. Although all implanted mice developed a primary tumor in the cecum, only 8% developed liver metastasis. By applying sequential in vivo selection, we isolated isogenic cell lines with increasing metastatic potential and increased the frequency of liver metastasis by 10-fold to 90%. The most highly metastatic cell line, CT26-FL3 gave rise to micrometastatic lesions as early as 10 days after implantation, thereby providing a predictable model that can be used to study various aspects and stages of liver metastasis. Using similar techniques in athymic nude mice, others have reported the dissemination of cancer cells to the lung and peritoneal carcinomatosis [10], however, these were not detected within the time frame of 4 to 8 weeks of the current studies.
To begin to characterize the CT26-FL3 cells, and to ensure that the model reflects known mechanisms of metastasis, we determined the expression of proteins that enhance proliferation, invasion, and angiogenesis such as c-Myc, Cyclin D1, VEGFA, and PCNA [36–39], and proteases such as MMP9 and MMP2 that are secreted by tumors and promote invasion by degrading the basement membrane [19, 21, 40]. Immunohistochemical analyses of tissue from primary tumors revealed that these molecular markers were expressed at higher levels in tumors from CT26-FL3 as compared to tumors from the CT26 cell line. These findings are supported by the significantly higher abilities for invasion and migration of CT26-FL3 compared to CT26 cells, as measured by the matrigel-coated Boyden Chamber and wound healing assays. Although the CT26 and CT26-FL3 cells show constitutive expression of both epithelial and mesenchymal markers when grown in culture [41], tumors from CT26-FL3 expressed higher levels of markers associated with mesenchymal cells, further underscoring their enhance capabilities for migration and invasion.
Analysis of mRNA transcripts expressed in both cell lines showed that Hgf mRNA levels were 10-fold higher in CT26-FL3 cells. HGF is expressed primarily by mesenchymal tissue such as fibroblasts and mononuclear cells [42]. It interacts with the c-Met tyrosine kinase receptor in cancer cells in a paracrine fashion to activate genes involved in tumor invasion and metastasis, indicating a critical reciprocal relationship between the tumor and cells in the microenvironment [36]. However, consistent with our observations, Kammula et al [43] quantitatively showed that HGF was also highly expressed in primary CRC tissues and that elevated levels of both proteins correlated with an advanced invasive stage and metastatic disease as well as poor prognosis [43]. Increased mRNA levels of Il6, Tnf, and Ifn suggests a critical role of tumor-associated inflammation [44] in metastasis progression by their activation of NF-kB, AP-1 (TNF), and STAT3 (IL-6) in epithelial cells [44–46]. High levels of IL-6 in sera of cancer patients and tumor-bearing mice correlate with poor prognosis [47]. While it is mostly produced by BMDCs at the early stage of CRC development [48], it is also produced in sporadic CRC where it can enhance STAT3 signaling [44], promote the differentiation and survival of BMDCs, and control the trafficking, recruitment and differentiation of myeloid-derived suppressor cells and neutrophils [44],. TNF is critical in maintaining chronic inflammation and promotes tumorigenesis by activating signaling pathways that stimulate cell proliferation and survival [49, 50]. The TNF receptor is expressed in BMDCs rather than in epithelial cells [51], suggesting that TNF might play a role in mobilizing these cells to the tumor microenvironment [48]. IFN-γ promotes cytotoxic, cytostatic, and antitumor effects in adaptive immune response [52], enhances proliferation by autocrine signaling, and promotes metastasis by conferring increased resistance to natural killer (NK) cells [53, 54]. It can also induce an inflammatory cascade by recruiting immune cells such as macrophages, NK cells, and CTLs [52] to create a pro-tumorigenic environment at the site of tumor development. In addition, we found that mRNA levels of the cytokines Csf2, Csf3, and chemokines Cxcl1, Cxcl4, and Cxcl11 are over expressed by four to eight-fold in CT26-FL3 cells. CSF2 and CSF3 control the differentiation, production, and functions of granulocytes and/or macrophages [55, 56]. They are typically produced by immune cells such as macrophages, mast cells, T cells, and NK cells as well as endothelial cells and fibroblasts. Recently, CSF2 was also shown to be over-expressed in more than one-third of human colorectal tumors as a result of aberrant DNA demethylation of its promoter [57]. CXCL1 and CXCL11 act as chemoattractants for the recruitment of neutrophils and activated T cells, while CXCL11 can interact with angiogenic growth factors such as fibroblast growth factor and VEGF to promote angiogenesis [58–60]. Collectively, these data suggest that enhanced metastasis by CT26-FL3 cells is due, in part, to the elevated expression of genes whose products not only confer growth advantage and invasiveness, but also mediate tumor interactions with host derived cells, particularly the immune cells, in the microenvironment and stimulate their mobilization either to the primary tumor or the secondary organ environment. The idea that interactions with the host environment can play a vital role in enhancing metastatic proficiency was further shown by the faster proliferation of CT26-FL3 cells in vivo as compared to its growth in tissue culture in vitro. Furthermore, when parental CT26 cells were first injected into the flank of Balb/cByJ mice and the resulting tumor excised, disaggregated into a single cell suspension, and then injected into the cecum, the frequency of the metastasis from the resulting cell line, CT26-F1, increased from 8% to 40% (data not shown). Thus, interaction between cancer cells and the host microenvironment was sufficient to enhance their metastatic potential and increase their ability to interact with cells in the surrounding environment to promote metastasis.
Recent studies have shown that molecular factors from the primary tumor can direct the recruitment of BMDCs to the target organ prior to the arrival of metastatic cells to establish future sites of metastasis called the PMN [25, 31]. We found that sera from mice bearing CT26-FL3 tumors had elevated levels of MMP9, OPN, VEGFA, the pro-inflammatory calcium-binding proteins S100A8 and S100A9, and SAA3. OPN secreted by tumor cells has been shown to activate BMDCs causing their migration to sites of tumorigenesis [22, 61]. The last three proteins were shown by Hiratsuka, et al. to be critical for the establishment of the PMN in lungs [20]. Analysis of protein and mRNA levels of these molecules in CT26, CT26-F1, and CT26-FL3 cells and immunohistochemical analyses of tissues from CT26 and CT26-FL3 tumors collectively indicate that MMP9, OPN, VEGFA and SAA3 are most likely secreted by the tumor cells, while S100A8 and S100A9 may originate from infiltrating BMDCs. Previous studies showed that secretion of VEGFA, TNFα, and TGFβ by tumor cells induced the expression of S100A8 and S100A9 in pre-metastatic lung where they promoted the recruitment of myeloid cells and expression of SAA3 which acted as a positive feedback regulator for further secretion of chemo-attractants that promoted tumor cell migration [20]. Ichikawa et al. [23] further showed that S100A8/A9 secreted by MDSCs in the primary tumor and at sites of metastasis created an autocrine pathway for further recruitment of more MDSCs. In colon tumor cells, they induced the secretion of genes that promote tumor cell migration, angiogenesis, recruitment of leukocytes, and the formation of a PMN in distant organs [23]. Serum level of S100A8 in mice with CT26-FL3 tumors was elevated by 27-fold suggesting that these cells are highly proficient in establishing the PMN. In all, our results indicate that the cell lines with a high propensity for metastasis are better able to recruit BMDCs to the primary tumor or secondary organ.
We combined cecal implantation of tumor cells expressing mCherry-RFP with transplantation of HSCs expressing eGFP to assess the mobilization of BMDCs to the liver microenvironment in tumor bearing mice by confocal microscopy. The data showed that the highly metastatic CT26-FL3 cells were more proficient at mobilizing BMDCs to the liver. Immunohistochemical staining and co-localization studies in liver tissues from tumor bearing mice revealed the presence of molecular and cellular markers associated with the PMN such as VEGFR1-positive cells [25], S100A8 and S100A9 [20, 31], and LOX [27, 62, 63]. While representing only a small fraction of the participants, these molecules play key roles in establishing the PMN. Further studies need to be undertaken to enumerate the full complement of BMDCs and molecules that comprise the hepatic PMN as well as the molecular signals that direct their organ specific migration.
In summary, we developed and characterized an orthotopic mouse model for hepatic metastasis of CRC in an immune competent host. By in vivo selection we isolated cell lines with increasing potentials for hepatic metastasis. Initial analyses of the properties of the highly metastatic CT26-FL3 cells indicate that they express high levels of proteins or genes whose products can allow them to mobilize BMDCs to the primary tumor and liver microenvironment. The model can be enhanced by expression of luciferase in tumor cells that can allow quantitation of tumor growth and progression in intact animals (data not shown). These studies showed that while mechanical forces and circulatory patterns may play a role in hepatic metastasis of CRC, molecular factors are critical for creating a permissive environment that allow metastasizing cells to survive and proliferate upon arrival in the liver. In combination with transplantation of eGFP-positive HSCs and the isogenic cell lines with a varying capabilities for metastasis, this model will provide the platform and tools to facilitate studies on the elucidation of host-tumor interactions that promote liver metastasis of CRC, identify the molecular and cellular participants in the “conversation” between cells in the tumor and in the microenvironment, as well as the messengers that deliver the messages between these participants.
Supplementary Material
Migration of eGFP positive BMDCs into the liver prior to the arrival to tumor cells mCherry-RFP positive tumor cells at three week post cecal implantation. Liver sections were analyzed for green fluorescence (eGFP), red fluorescence (mCherry), Phalloidin (actin) and DAPI (blue). Cells implanted with CT26-FL3 showed the presence of BMDCs and the absence of tumor cells (upper panel) while both green and red fluorescence were absent in control Sham injected animals (lower panel).
Co-localization of markers associated with pre-metastatic niche formation with BMDCs infiltrating the liver prior to the arrival of metastasizing tumor cells. Balbc/ByJ mice were transplanted with BM from transgenic mice expressing eGFP prior to implantation of CT26-FL3 cells into the cecum. Liver sections were taken 2.5 weeks post cecal implantation. The sections were stained with antibodies against S100A8 (top panel), S100A9 (second panel), LOX (third panel), and VEGF-R1 (bottom panel), then examined for the presence of BMDCs (Green), and counterstained with DAPI (Blue). Red = Positive staining for protein specific antibodies. Images were the merged to determine co-localization of the protein markers with the eGFP positive BMDCs.
Acknowledgments
The authors would like to Ms. Anna McNeal Harper and Dr. Udai Singh of the Biotechnology Core, USC Scholl of Medicine, for technical support in confocal microscopy and flow cytometry, respectively, and Ms. Julia Long, Palmetto Richland Radiology and Oncology for assistance with mouse irradiation. This work was supported by NIH Grants P20 RR17698 as a Target Principal Investigator of the USC Center for Colon Cancer Research and R01CA154731-1A1.
Abbreviations
- CRC
Colorectal cancer
- BMDC
Bone marrow derived cells
- PMN
Pre-metastatic niche
- HSC
Hematopoietic stem cells
- BM
Bone marrow
- BMT
bone marrow transplantation
- PCNA
Proliferating Cell Nuclear Antigen
- MMP
matrix metalloproteinase
- VEGF
vascular endothelial growth factor
- VEGF-R1
VEGF receptor 1
- LOX
Lysyl oxidase
- CCND1
Cyclin D1
- OPN
Osteopontin
- SAA3
Serum amyloid A3
- HRP
Horseradish peroxidase
- HGF
Hepatocyte growth factor
- IL-6
Interleukin 6
- TNF-α
Tumor necrosis factor alpha
- IFN-γ
Interferon gamma
- CSF
Colony stimulating factor
- LLC
Lewis lung carcinoma
- eGFP
enhanced green fluorescent protein
- RFP
Red fluorescent protein
- MDSC
myeloid derived suppressor cells
References
- 1.American Cancer Society. Cancer Facts and Figures 2012. Atlanta: American Cancer Society; 2012. pp. 25–6. [Google Scholar]
- 2.Schima W, Kulinna C, Langenberger H, et al. Liver metastases of colorectal cancer: US, CT or MR? Cancer imaging: the official publication of the International Cancer Imaging Society. 2005;5(Spec No A):S149–56. doi: 10.1102/1470-7330.2005.0035. [DOI] [PMC free article] [PubMed] [Google Scholar]
- 3.Shibue T, Weinberg RA. Metastatic colonization: settlement, adaptation and propagation of tumor cells in a foreign tissue environment. Seminars in cancer biology. 2011;21 (2):99–106. doi: 10.1016/j.semcancer.2010.12.003. [DOI] [PubMed] [Google Scholar]
- 4.Gupta GP, Massague J. Cancer metastasis: building a framework. Cell. 2006;127 (4):679–95. doi: 10.1016/j.cell.2006.11.001. [DOI] [PubMed] [Google Scholar]
- 5.Kaplan RN, Rafii S, Lyden D. Preparing the “soil”: the premetastatic niche. Cancer Res. 2006;66 (23):11089–93. doi: 10.1158/0008-5472.CAN-06-2407. [DOI] [PMC free article] [PubMed] [Google Scholar]
- 6.Taketo MM, Edelmann W. Mouse models of colon cancer. Gastroenterology. 2009;136 (3):780–98. doi: 10.1053/j.gastro.2008.12.049. [DOI] [PubMed] [Google Scholar]
- 7.Kobaek-Larsen M, Thorup I, Diederichsen A, et al. Review of colorectal cancer and its metastases in rodent models: comparative aspects with those in humans. Comp Med. 2000;50 (1):16–26. [PubMed] [Google Scholar]
- 8.Heijstek MW, Kranenburg O, Borel Rinkes IH. Mouse models of colorectal cancer and liver metastases. Digestive surgery. 2005;22 (1–2):16–25. doi: 10.1159/000085342. [DOI] [PubMed] [Google Scholar]
- 9.Alencar H, King R, Funovics M, et al. A novel mouse model for segmental orthotopic colon cancer. International journal of cancer Journal international du cancer. 2005;117 (3):335–9. doi: 10.1002/ijc.21185. [DOI] [PubMed] [Google Scholar]
- 10.Cespedes MV, Espina C, Garcia-Cabezas MA, et al. Orthotopic microinjection of human colon cancer cells in nude mice induces tumor foci in all clinically relevant metastatic sites. The American journal of pathology. 2007;170 (3):1077–85. doi: 10.2353/ajpath.2007.060773. [DOI] [PMC free article] [PubMed] [Google Scholar]
- 11.Hackl C, Man S, Francia G, et al. Metronomic oral topotecan prolongs survival and reduces liver metastasis in improved preclinical orthotopic and adjuvant therapy colon cancer models. Gut. 2013;62 (2):259–71. doi: 10.1136/gutjnl-2011-301585. [DOI] [PMC free article] [PubMed] [Google Scholar]
- 12.Bresalier RS, Hujanen ES, Raper SE, et al. An animal model for colon cancer metastasis: establishment and characterization of murine cell lines with enhanced liver-metastasizing ability. Cancer research. 1987;47 (5):1398–406. [PubMed] [Google Scholar]
- 13.Lin JC, Cheng JY, Tzeng CC, et al. An animal model for colon cancer metastatic cell line with enhanced metastasizing ability. Establishment and characterization Diseases of the colon and rectum. 1991;34 (6):458–63. doi: 10.1007/BF02049929. [DOI] [PubMed] [Google Scholar]
- 14.Morikawa K, Walker SM, Nakajima M, et al. Influence of organ environment on the growth, selection, and metastasis of human colon carcinoma cells in nude mice. Cancer research. 1988;48 (23):6863–71. [PubMed] [Google Scholar]
- 15.Morikawa K, Walker SM, Jessup JM, et al. In vivo selection of highly metastatic cells from surgical specimens of different primary human colon carcinomas implanted into nude mice. Cancer research. 1988;48 (7):1943–8. [PubMed] [Google Scholar]
- 16.Ijichi H, Chytil A, Gorska AE, et al. Inhibiting Cxcr2 disrupts tumor-stromal interactions and improves survival in a mouse model of pancreatic ductal adenocarcinoma. The Journal of clinical investigation. 2011;121 (10):4106–17. doi: 10.1172/JCI42754. [DOI] [PMC free article] [PubMed] [Google Scholar]
- 17.Kalluri R, Weinberg RA. The basics of epithelial-mesenchymal transition. J Clin Invest. 2009;119 (6):1420–8. doi: 10.1172/JCI39104. [DOI] [PMC free article] [PubMed] [Google Scholar]
- 18.Polyak K, Weinberg RA. Transitions between epithelial and mesenchymal states: acquisition of malignant and stem cell traits. Nat Rev Cancer. 2009;9 (4):265–73. doi: 10.1038/nrc2620. [DOI] [PubMed] [Google Scholar]
- 19.van Kempen LC, Coussens LM. MMP9 potentiates pulmonary metastasis formation. Cancer Cell. 2002;2 (4):251–2. doi: 10.1016/s1535-6108(02)00157-5. [DOI] [PubMed] [Google Scholar]
- 20.Hiratsuka S, Watanabe A, Sakurai Y, et al. The S100A8-serum amyloid A3-TLR4 paracrine cascade establishes a pre-metastatic phase. Nature cell biology. 2008;10 (11):1349–55. doi: 10.1038/ncb1794. [DOI] [PubMed] [Google Scholar]
- 21.Loges S, Mazzone M, Hohensinner P, et al. Silencing or fueling metastasis with VEGF inhibitors: antiangiogenesis revisited. Cancer Cell. 2009;15 (3):167–70. doi: 10.1016/j.ccr.2009.02.007. [DOI] [PubMed] [Google Scholar]
- 22.McAllister SS, Gifford AM, Greiner AL, et al. Systemic endocrine instigation of indolent tumor growth requires osteopontin. Cell. 2008;133 (6):994–1005. doi: 10.1016/j.cell.2008.04.045. [DOI] [PMC free article] [PubMed] [Google Scholar]
- 23.Ichikawa M, Williams R, Wang L, et al. S100A8/A9 activate key genes and pathways in colon tumor progression. Mol Cancer Res. 2011;9 (2):133–48. doi: 10.1158/1541-7786.MCR-10-0394. [DOI] [PMC free article] [PubMed] [Google Scholar]
- 24.Kaplan RN, Psaila B, Lyden D. Bone marrow cells in the ‘pre-metastatic niche’: within bone and beyond. Cancer Metastasis Rev. 2006;25 (4):521–9. doi: 10.1007/s10555-006-9036-9. [DOI] [PubMed] [Google Scholar]
- 25.Kaplan RN, Riba RD, Zacharoulis S, et al. VEGFR1-positive haematopoietic bone marrow progenitors initiate the pre-metastatic niche. Nature. 2005;438 (7069):820–7. doi: 10.1038/nature04186. [DOI] [PMC free article] [PubMed] [Google Scholar]
- 26.Yamada Y, Yamaguchi T, Matsumoto H, et al. Phase II study of oral S-1 with irinotecan and bevacizumab (SIRB) as first-line therapy for patients with metastatic colorectal cancer. Invest New Drugs. 2011 doi: 10.1007/s10637-011-9743-0. [DOI] [PubMed] [Google Scholar]
- 27.Erler JT, Bennewith KL, Cox TR, et al. Hypoxia-induced lysyl oxidase is a critical mediator of bone marrow cell recruitment to form the premetastatic niche. Cancer Cell. 2009;15 (1):35–44. doi: 10.1016/j.ccr.2008.11.012. [DOI] [PMC free article] [PubMed] [Google Scholar]
- 28.Spano D, Zollo M. Tumor microenvironment: a main actor in the metastasis process. Clin Exp Metastasis. 2012;29 (4):381–95. doi: 10.1007/s10585-012-9457-5. [DOI] [PubMed] [Google Scholar]
- 29.Fidler IJ. The pathogenesis of cancer metastasis: the ‘seed and soil’ hypothesis revisited. Nat Rev Cancer. 2003;3 (6):453–8. doi: 10.1038/nrc1098. [DOI] [PubMed] [Google Scholar]
- 30.Bos PD, Nguyen DX, Massague J. Modeling metastasis in the mouse. Curr Opin Pharmacol. 2010;10 (5):571–7. doi: 10.1016/j.coph.2010.06.003. [DOI] [PMC free article] [PubMed] [Google Scholar]
- 31.Hiratsuka S, Watanabe A, Aburatani H, et al. Tumour-mediated upregulation of chemoattractants and recruitment of myeloid cells predetermines lung metastasis. Nat Cell Biol. 2006;8 (12):1369–75. doi: 10.1038/ncb1507. [DOI] [PubMed] [Google Scholar]
- 32.Sun FX, Sasson AR, Jiang P, et al. An ultra-metastatic model of human colon cancer in nude mice. Clin Exp Metastasis. 1999;17 (1):41–8. doi: 10.1023/a:1026442321295. [DOI] [PubMed] [Google Scholar]
- 33.Thalheimer A, Illert B, Bueter M, et al. Feasibility and limits of an orthotopic human colon cancer model in nude mice. Comp Med. 2006;56 (2):105–9. [PubMed] [Google Scholar]
- 34.Rashidi B, Sun FX, Jiang P, et al. A nude mouse model of massive liver and lymph node metastasis of human colon cancer. Anticancer research. 2000;20 (2A):715–22. [PubMed] [Google Scholar]
- 35.Rashidi B, Gamagami R, Sasson A, et al. An orthotopic mouse model of remetastasis of human colon cancer liver metastasis. Clinical cancer research: an official journal of the American Association for Cancer Research. 2000;6 (6):2556–61. [PubMed] [Google Scholar]
- 36.Hanahan D, Weinberg RA. Hallmarks of cancer: the next generation. Cell. 2011;144 (5):646–74. doi: 10.1016/j.cell.2011.02.013. [DOI] [PubMed] [Google Scholar]
- 37.Partin AW, Schoeniger JS, Mohler JL, et al. Fourier analysis of cell motility: correlation of motility with metastatic potential. Proc Natl Acad Sci U S A. 1989;86 (4):1254–8. doi: 10.1073/pnas.86.4.1254. [DOI] [PMC free article] [PubMed] [Google Scholar]
- 38.Silletti S, Paku S, Raz A. Autocrine motility factor and the extracellular matrix. II. Degradation or remodeling of substratum components directs the motile response of tumor cells. Int J Cancer. 1998;76 (1):129–35. doi: 10.1002/(sici)1097-0215(19980330)76:1<129::aid-ijc20>3.0.co;2-6. [DOI] [PubMed] [Google Scholar]
- 39.Malkas LH, Herbert BS, Abdel-Aziz W, et al. A cancer-associated PCNA expressed in breast cancer has implications as a potential biomarker. Proc Natl Acad Sci U S A. 2006;103 (51):19472–7. doi: 10.1073/pnas.0604614103. [DOI] [PMC free article] [PubMed] [Google Scholar]
- 40.Deryugina EI, Quigley JP. Matrix metalloproteinases and tumor metastasis. Cancer Metastasis Rev. 2006;25 (1):9–34. doi: 10.1007/s10555-006-7886-9. [DOI] [PubMed] [Google Scholar]
- 41.Huber MA, Maier HJ, Alacakaptan M, et al. BI 5700, a Selective Chemical Inhibitor of IkappaB Kinase 2, Specifically Suppresses Epithelial-Mesenchymal Transition and Metastasis in Mouse Models of Tumor Progression. Genes Cancer. 2010;1 (2):101–14. doi: 10.1177/1947601910361749. [DOI] [PMC free article] [PubMed] [Google Scholar]
- 42.Otte JM, Schmitz F, Kiehne K, et al. Functional expression of HGF and its receptor in human colorectal cancer. Digestion. 2000;61 (4):237–46. doi: 10.1159/000007764. [DOI] [PubMed] [Google Scholar]
- 43.Kammula US, Kuntz EJ, Francone TD, et al. Molecular co-expression of the c-Met oncogene and hepatocyte growth factor in primary colon cancer predicts tumor stage and clinical outcome. Cancer Lett. 2007;248 (2):219–28. doi: 10.1016/j.canlet.2006.07.007. [DOI] [PubMed] [Google Scholar]
- 44.Grivennikov SI, Karin M. Inflammatory cytokines in cancer: tumour necrosis factor and interleukin 6 take the stage. Ann Rheum Dis. 2011;70 (Suppl 1):i104–8. doi: 10.1136/ard.2010.140145. [DOI] [PubMed] [Google Scholar]
- 45.Balkwill F. Tumour necrosis factor and cancer. Nature reviews Cancer. 2009;9 (5):361–71. doi: 10.1038/nrc2628. [DOI] [PubMed] [Google Scholar]
- 46.Bromberg JF, Wrzeszczynska MH, Devgan G, et al. Stat3 as an oncogene. Cell. 1999;98 (3):295–303. doi: 10.1016/s0092-8674(00)81959-5. [DOI] [PubMed] [Google Scholar]
- 47.Naugler WE, Karin M. The wolf in sheep’s clothing: the role of interleukin-6 in immunity, inflammation and cancer. Trends Mol Med. 2008;14 (3):109–19. doi: 10.1016/j.molmed.2007.12.007. [DOI] [PubMed] [Google Scholar]
- 48.Grivennikov S, Karin E, Terzic J, et al. IL-6 and Stat3 are required for survival of intestinal epithelial cells and development of colitis-associated cancer. Cancer Cell. 2009;15 (2):103–13. doi: 10.1016/j.ccr.2009.01.001. [DOI] [PMC free article] [PubMed] [Google Scholar]
- 49.Grivennikov SI, Kuprash DV, Liu ZG, et al. Intracellular signals and events activated by cytokines of the tumor necrosis factor superfamily: From simple paradigms to complex mechanisms. Int Rev Cytol. 2006;252:129–61. doi: 10.1016/S0074-7696(06)52002-9. [DOI] [PubMed] [Google Scholar]
- 50.Matthews CP, Colburn NH, Young MR. AP-1 a target for cancer prevention. Curr Cancer Drug Targets. 2007;7 (4):317–24. doi: 10.2174/156800907780809723. [DOI] [PubMed] [Google Scholar]
- 51.Popivanova BK, Kitamura K, Wu Y, et al. Blocking TNF-alpha in mice reduces colorectal carcinogenesis associated with chronic colitis. The Journal of clinical investigation. 2008;118 (2):560–70. doi: 10.1172/JCI32453. [DOI] [PMC free article] [PubMed] [Google Scholar]
- 52.Zaidi MR, Merlino G. The two faces of interferon-gamma in cancer. Clinical cancer research: an official journal of the American Association for Cancer Research. 2011;17 (19):6118–24. doi: 10.1158/1078-0432.CCR-11-0482. [DOI] [PMC free article] [PubMed] [Google Scholar]
- 53.Gorbacheva VY, Lindner D, Sen GC, et al. The interferon (IFN)-induced GTPase, mGBP-2. Role in IFN-gamma-induced murine fibroblast proliferation. The Journal of biological chemistry. 2002;277 (8):6080–7. doi: 10.1074/jbc.M110542200. [DOI] [PubMed] [Google Scholar]
- 54.Lollini PL, Bosco MC, Cavallo F, et al. Inhibition of tumor growth and enhancement of metastasis after transfection of the gamma-interferon gene. International journal of cancer Journal international du cancer. 1993;55 (2):320–9. doi: 10.1002/ijc.2910550224. [DOI] [PubMed] [Google Scholar]
- 55.Metcalf D, Begley CG, Johnson GR, et al. Biologic properties in vitro of a recombinant human granulocyte-macrophage colony-stimulating factor. Blood. 1986;67 (1):37–45. [PubMed] [Google Scholar]
- 56.Smith BR. Regulation of hematopoiesis. Yale J Biol Med. 1990;63 (5):371–80. [PMC free article] [PubMed] [Google Scholar]
- 57.Urdinguio RG, Fernandez AF, Moncada-Pazos A, et al. Immune-Dependent and Independent Antitumor Activity of GM-CSF Aberrantly Expressed by Mouse and Human Colorectal Tumors. Cancer research. 2013;73 (1):395–405. doi: 10.1158/0008-5472.CAN-12-0806. [DOI] [PubMed] [Google Scholar]
- 58.Scapini P, Morini M, Tecchio C, et al. CXCL1/macrophage inflammatory protein-2-induced angiogenesis in vivo is mediated by neutrophil-derived vascular endothelial growth factor-A. Journal of immunology. 2004;172 (8):5034–40. doi: 10.4049/jimmunol.172.8.5034. [DOI] [PubMed] [Google Scholar]
- 59.Acharyya S, Oskarsson T, Vanharanta S, et al. A CXCL1 paracrine network links cancer chemoresistance and metastasis. Cell. 2012;150 (1):165–78. doi: 10.1016/j.cell.2012.04.042. [DOI] [PMC free article] [PubMed] [Google Scholar]
- 60.Berencsi K, Meropol NJ, Hoffman JP, et al. Colon carcinoma cells induce CXCL11-dependent migration of CXCR3-expressing cytotoxic T lymphocytes in organotypic culture. Cancer immunology, immunotherapy: CII. 2007;56 (3):359–70. doi: 10.1007/s00262-006-0190-2. [DOI] [PMC free article] [PubMed] [Google Scholar]
- 61.Elkabets M, Gifford AM, Scheel C, et al. Human tumors instigate granulin-expressing hematopoietic cells that promote malignancy by activating stromal fibroblasts in mice. The Journal of clinical investigation. 2011;121 (2):784–99. doi: 10.1172/JCI43757. [DOI] [PMC free article] [PubMed] [Google Scholar]
- 62.Erler JT, Bennewith KL, Nicolau M, et al. Lysyl oxidase is essential for hypoxia-induced metastasis. Nature. 2006;440 (7088):1222–6. doi: 10.1038/nature04695. [DOI] [PubMed] [Google Scholar]
- 63.Erler JT, Giaccia AJ. Lysyl oxidase mediates hypoxic control of metastasis. Cancer research. 2006;66 (21):10238–41. doi: 10.1158/0008-5472.CAN-06-3197. [DOI] [PubMed] [Google Scholar]
Associated Data
This section collects any data citations, data availability statements, or supplementary materials included in this article.
Supplementary Materials
Migration of eGFP positive BMDCs into the liver prior to the arrival to tumor cells mCherry-RFP positive tumor cells at three week post cecal implantation. Liver sections were analyzed for green fluorescence (eGFP), red fluorescence (mCherry), Phalloidin (actin) and DAPI (blue). Cells implanted with CT26-FL3 showed the presence of BMDCs and the absence of tumor cells (upper panel) while both green and red fluorescence were absent in control Sham injected animals (lower panel).
Co-localization of markers associated with pre-metastatic niche formation with BMDCs infiltrating the liver prior to the arrival of metastasizing tumor cells. Balbc/ByJ mice were transplanted with BM from transgenic mice expressing eGFP prior to implantation of CT26-FL3 cells into the cecum. Liver sections were taken 2.5 weeks post cecal implantation. The sections were stained with antibodies against S100A8 (top panel), S100A9 (second panel), LOX (third panel), and VEGF-R1 (bottom panel), then examined for the presence of BMDCs (Green), and counterstained with DAPI (Blue). Red = Positive staining for protein specific antibodies. Images were the merged to determine co-localization of the protein markers with the eGFP positive BMDCs.