Abstract
Using a nontargeted metabolomics approach of 447 fasting plasma metabolites, we searched for novel molecular markers that arise before and after hyperglycemia in a large population-based cohort of 2,204 females (115 type 2 diabetic [T2D] case subjects, 192 individuals with impaired fasting glucose [IFG], and 1,897 control subjects) from TwinsUK. Forty-two metabolites from three major fuel sources (carbohydrates, lipids, and proteins) were found to significantly correlate with T2D after adjusting for multiple testing; of these, 22 were previously reported as associated with T2D or insulin resistance. Fourteen metabolites were found to be associated with IFG. Among the metabolites identified, the branched-chain keto-acid metabolite 3-methyl-2-oxovalerate was the strongest predictive biomarker for IFG after glucose (odds ratio [OR] 1.65 [95% CI 1.39–1.95], P = 8.46 × 10⁻⁹) and was moderately heritable (h2 = 0.20). The association was replicated in an independent population (n = 720, OR 1.68 [ 1.34–2.11], P = 6.52 × 10⁻⁶) and validated in 189 twins with urine metabolomics taken at the same time as plasma (OR 1.87 [1.27–2.75], P = 1 × 10⁻³). Results confirm an important role for catabolism of branched-chain amino acids in T2D and IFG. In conclusion, this T2D-IFG biomarker study has surveyed the broadest panel of nontargeted metabolites to date, revealing both novel and known associated metabolites and providing potential novel targets for clinical prediction and a deeper understanding of causal mechanisms.
Currently, stratification of individuals at risk for type 2 diabetes (T2D) within the general population is based on well-established factors such as age, BMI, and fasting glucose (1). Although these factors contribute considerably to disease risk, they may not identify at-risk individuals before the disease process is well under way.
Recently, a number of studies have found several metabolites to be correlated with insulin resistance and T2D (2–6), and T2D-associated metabolic profiles have been identified 10–15 years before the diagnosis/onset of the disease (7–9). To help preventive strategies, and maximize the potential for existing effective interventions, it is important to characterize the molecular changes that take place in the development of T2D.
We aim to understand other biochemical changes, in addition to hyperglycemia, that take place at the onset of T2D using the largest metabolomic screening approach to date. We assessed >400 metabolites to determine which metabolomic profiles are correlated with T2D and impaired fasting glucose (IFG) in a large cohort of females from TwinsUK with independent replication.
RESEARCH DESIGN AND METHODS
We analyzed data from 2,204 females from TwinsUK for whom nontargeted plasma metabolomic profiling was available along with glucose/diabetic information (10). Subjects were classified into three groups based on fasting glucose levels at time of initial sampling and at subsequent visits (on average 2.08 [1.21] visits): T2D case subjects (fasting glucose ≥7 mmol/L or physician’s letter confirming diagnosis), individuals with IFG (5.6 mmol/L< fasting glucose <7 mmol/L), and T2D control subjects (3.9 mmol/L< fasting glucose <5 mmol/L).
Metabolomics measurements (on plasma and urine).
Nontargeted metabolite detection and quantification was conducted by the metabolomics provider Metabolon, Inc. (Durham, NC) on TwinsUK fasting plasma samples as described previously (11) and on 187 spot urine samples taken at the same time as plasma.
Replication cohort for 3-methyl-2-oxovalerate.
We included 536 individuals with IFG and 184 control subjects identified via fasting glucose from the follow-up study KORA F4 (Cooperative Health Research in the Region of Augsburg) (12) with fasting metabolomic profiles for 3-methyl-2-oxovalerate.
Statistical analysis.
We inverse normalized the data as the metabolite concentrations were not normally distributed. To avoid spurious false-positive associations due to small sample size, we excluded metabolic traits with >20% missing values.
For each T2D-control and IFG-control contrast, we ran random intercept logistic regressions adjusting for age and BMI at the time of sampling, metabolite batch, and family relatedness. We used a conservative Bonferroni correction to account for multiple testing, thus giving a significant threshold of 1 × 10⁻⁴ (0.05/447).
Taking advantage of the twin design of our study, for each metabolite significantly associated with one or more contrasts, we estimated heritability using structural equation modeling. For contrasts between each disease class and controls, we ran a stepwise linear regression including all the significant metabolites to look for metabolites independently associated with T2D and IFG respectively.
We further investigated the role of 3-methly-2-oxovalerate, the strongest predictive biomarker after glucose, by 1) replicating the result in an independent population (KORA), 2) validating the result in urine (TwinsUK), 3) investigating the underlying genetic influences using genome-wide association study (GWAS) data, and 4) assessing causality of the metabolite-IFG association by Mendelian randomization.
As 3-methyl-2-oxovalerate was associated with single nucleotide polymorphism (SNP) rs1440581 (S.-Y.S., E.F., A.-K.P., et al., unpublished observations), we tested this SNP for association with T2D status using case and control subjects from the Diabetes Genetics Replication and Meta-analysis Consortium (DIAGRAM) and by genotyping rs1440581 in 4,961 T2D case subjects and 5,948 control subjects from GoDarts (KASPar System; KBiosciences; genotyping success rate >95%, Hardy-Weinberg Equilibrium P > 0.05).
RESULTS
Metabolites associated with T2D and IFG.
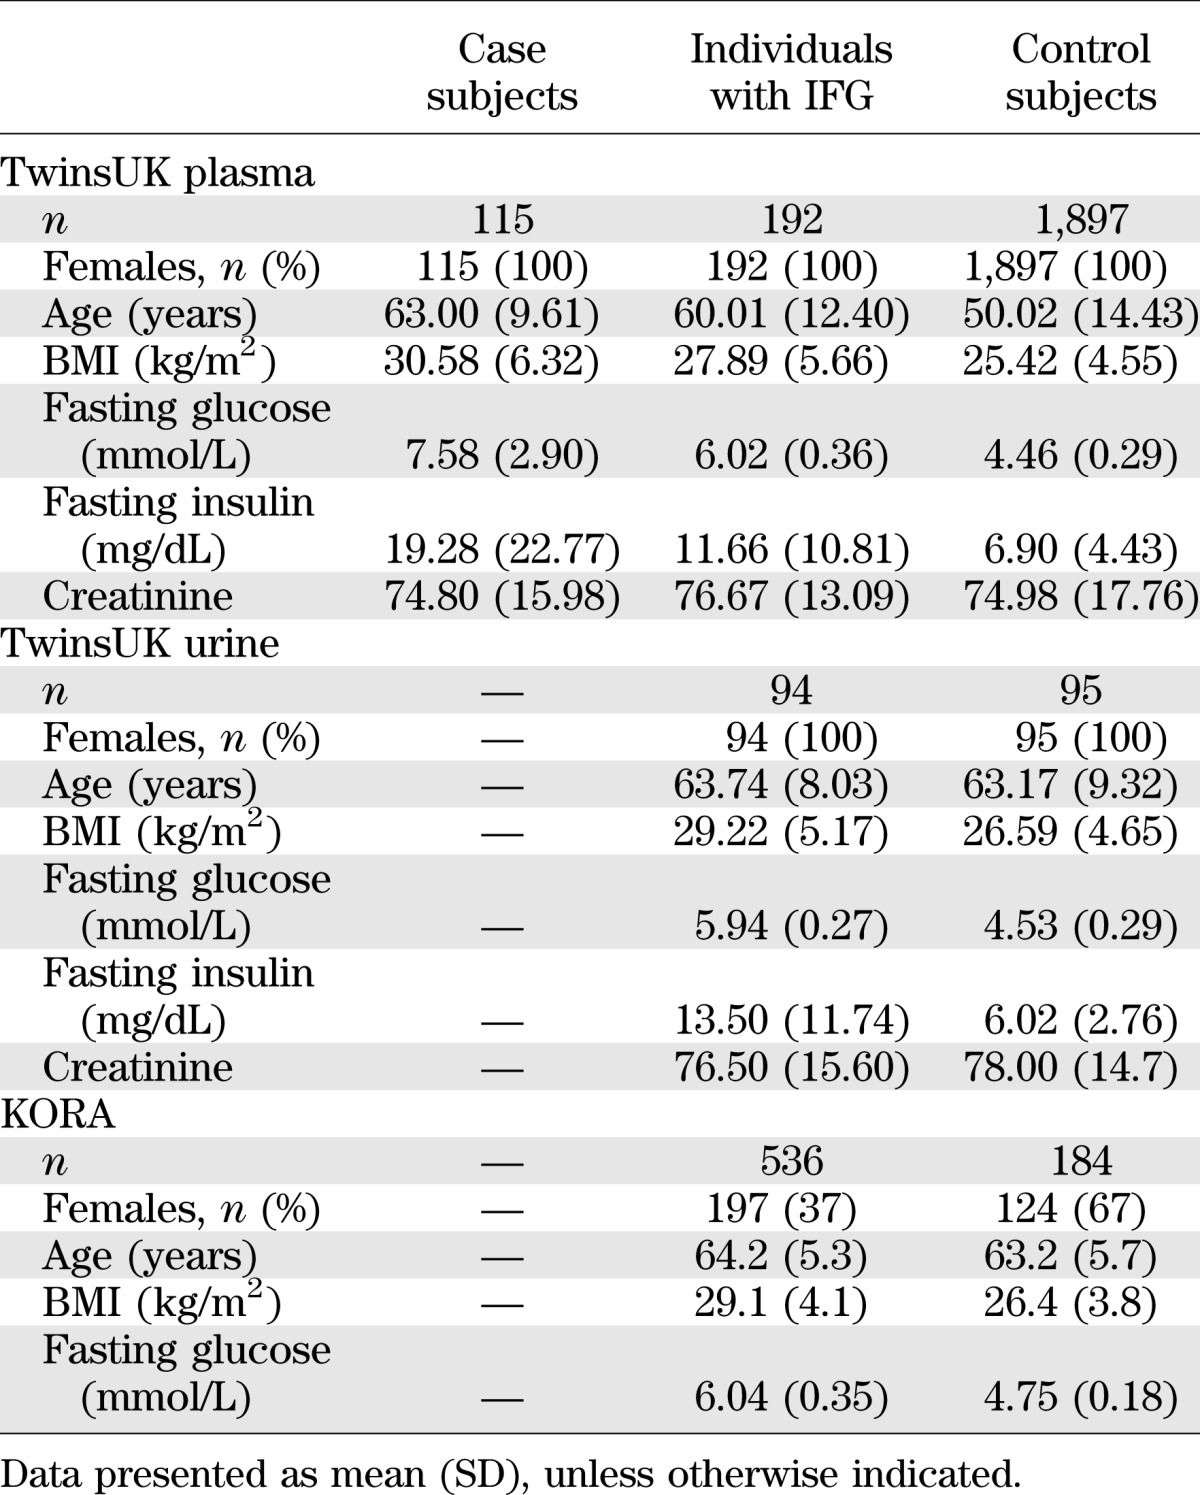
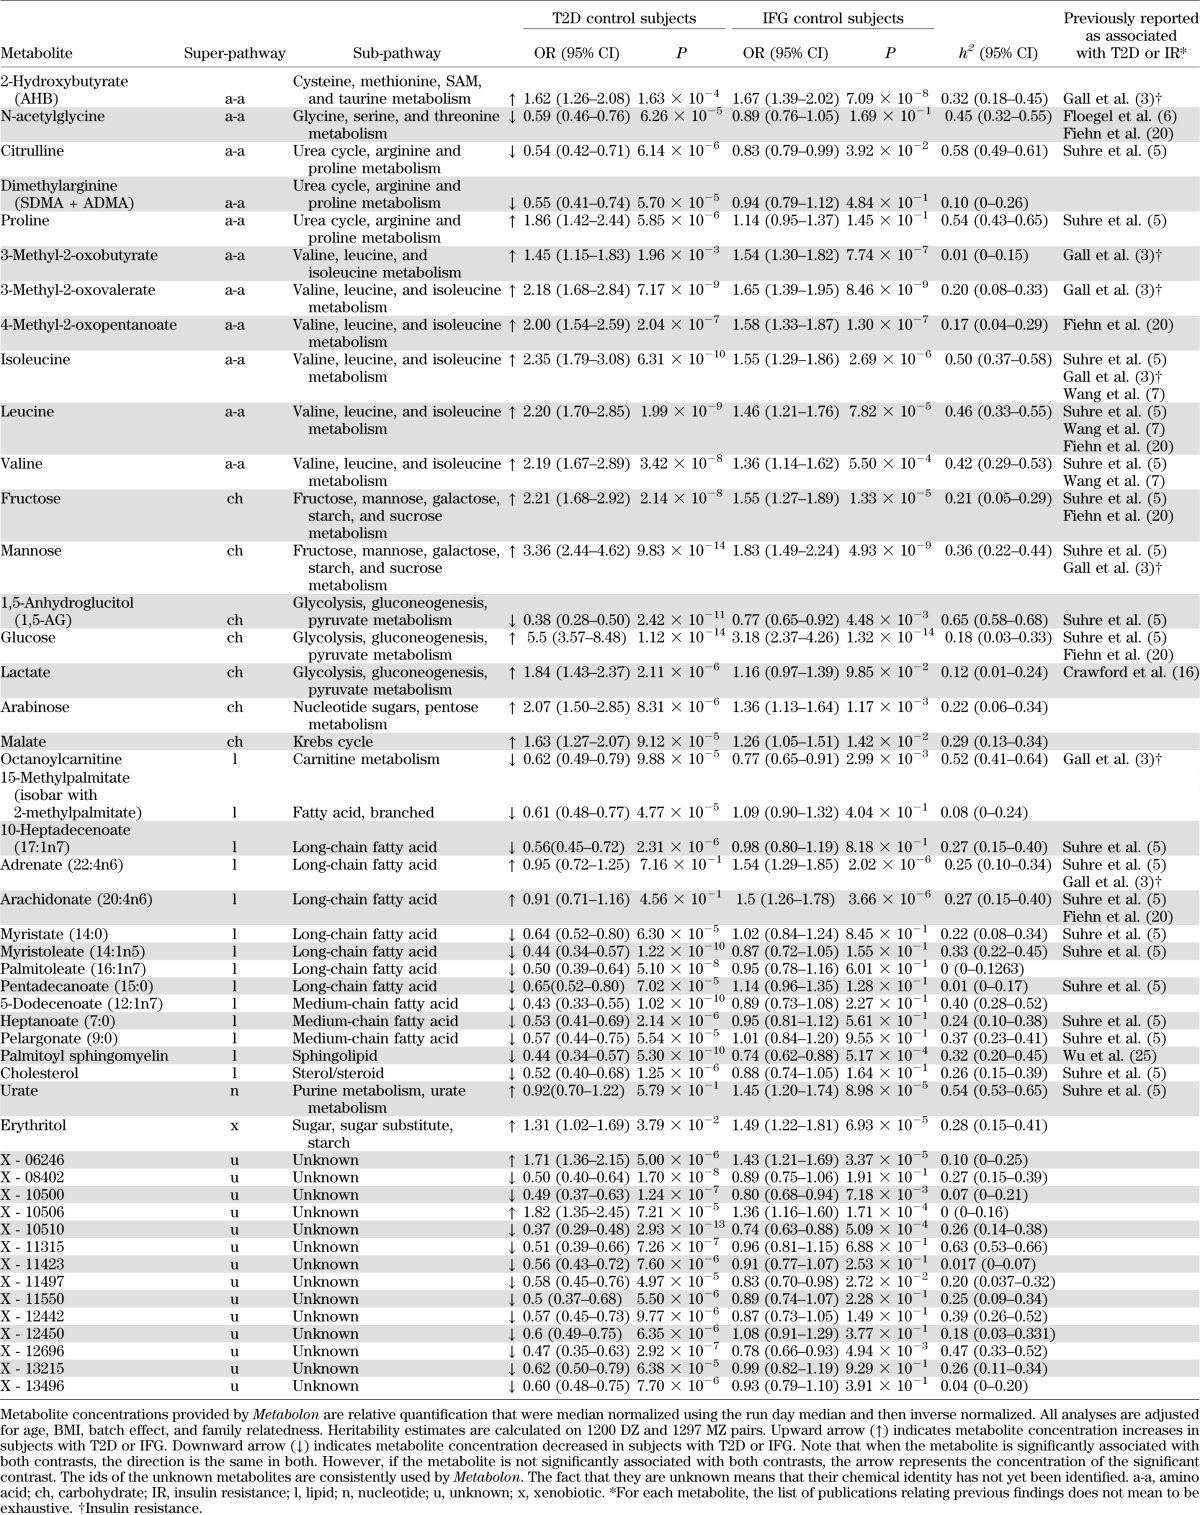
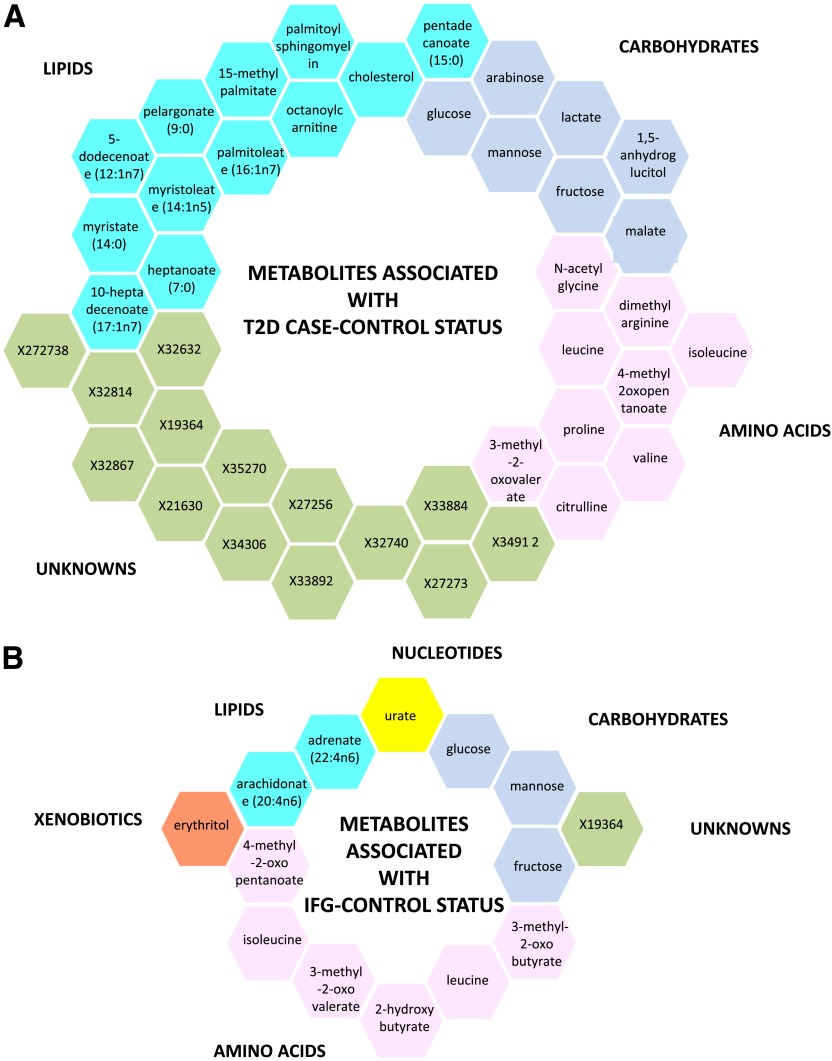
Levels of 447 fasting plasma metabolites (281 known and 176 unknown) were obtained for 115 T2D case subjects, 192 individuals with IFG, and 1,897 normoglycemic control subjects. The demographic characteristics are presented in Table 1. After adjusting for age, BMI, metabolite batch, and family relatedness, 42 of the 447 metabolites tested showed significant differences among T2D case and control subjects with a Bonferroni-corrected cutoff of 1 × 10⁻⁴ (=0.05/447). As depicted in Fig. 1A, the 42 metabolites fall into three principal classes: 12 are lipids (primarily medium and long-chain free fatty acids), 7 are carbohydrates, 9 are branched-chain amino acids (BCAAs) or derivatives, and 14 are unknown. Besides glucose, a one standard deviation change in metabolite level resulted in T2D effect sizes ranging from odds ratio (OR) 1.05 to 3.36 for adrenate (22:4n6) and mannose, respectively (Table 2).
TABLE 1.
Demographic characteristics of the study populations

FIG. 1.
Metabolites associated with T2D case-control status (A) and with IFG control status (B). Each metabolite super-pathway is represented in a different color.
TABLE 2.
List of significant metabolites in one or more comparison

We repeated the analysis for the IFG group contrasting with control subjects. This revealed 14 significantly associated metabolites, 8 of which were also identified for T2D (Table 2). Six of the 14 metabolites are related to BCAA catabolism, three are carbohydrates, and two are lipids (Fig. 1B). Two metabolites were independently associated with IFG in the stepwise regression, including these 14 metabolites: glucose and 3-methyl-2-oxovalerate. Using 1,297 monozygotic and 1,200 dizygotic twin pairs, we estimated heritability for each metabolite identified in one or more contrasts. The calculated heritabilities ranged from 0 to 65%.
Effect sizes, association statistics, heritability estimates, and literature references for both contrasts are shown in Table 2.
Investigating the role of 3-methyl-2-oxovalerate in IFG.
3-Methyl-2-oxovalerate is the branched-chain keto-acid (BCKA) derivative of isoleucine, one of three BCAAs. We found it to be significantly associated with IFG in 536 individuals with IFG and 184 normoglycemic control subjects from the KORA population (OR 1.68 [95% CI 1.34–2.11], P = 6.52 × 10⁻⁶) and in the inverse-variance fixed-effect meta-analysis of the results (1.66 [1.45–1.90], P = 2.62 × 10⁻¹³), thus replicating our result.
We next studied 94 individuals with IFG and 95 control subjects from TwinsUK with urine metabolomic profiles available at the same time as plasma sampling. 3-Methyl-2-oxovalerate correlated significantly with IFG (OR 1.87 [95% CI 1.27–2.75], P = 1 × 10⁻³), thus suggesting that urine could also be used to test for elevated 3-methyl-2-oxovalerate.
Genetics of 3-methyl-2-oxovalerate and GWAS.
3-Methyl-2-oxovalerate has a heritability h2 = 0.20 (95% CI 0.08–0.33) (Table 2). Our companion metabolite GWAS (S.-Y.S., E.F., A.-K.P., et al., unpublished observations) revealed that 3-methyl-2-oxovalerate is strongly associated with SNPs upstream of the PPM1K gene on chromosome 4 (top hit SNP rs1440581, beta = −0.014 [0.017], P = 1.21 × 10⁻¹⁶).
We assessed whether the association between 3-methyl-2-oxovalerate and IFG is consistent with a causal hypothesis. Given the magnitude of effect between 3-methyl-2-oxovalerate and T2D and between rs1440581 and 3-methyl-2-oxovalerate, we theoretically estimated assuming causality (using Mendelian randomization) that the biomarker raising allele C would be associated with increased risk of T2D (OR 1.10 [95% CI 1.03–1.18]). We obtained in the actual data a meta-analyzed test statistic of OR 1.03 ([1.00–1.05], P = 0.08) after analyzing rs1440581 in 17,132 T2D cases and 62,810 control subjects (DIAGRAM consortium [13] plus replication in GoDARTs [14]).
DISCUSSION
Using the largest biochemical screening approach to date (447 metabolites), we searched for molecular markers that arise before and after hyperglycemia in a large cross-sectional population of women. We identified 42 metabolites with high statistical significance associated with T2D and 14 metabolites associated with IFG. Although diabetes is considered to be primarily a disorder of glucose, we find other dimensions, apart from carbohydrates, in the metabolic space that associate with T2D and IFG, namely lipids and amino acids.
Although many metabolites identified have previously been associated with T2D or insulin resistance (Table 2), we are the first to report their associations with IFG. Moreover as IFG presents itself before T2D in prospective studies, this could improve disease prediction and early intervention. Also, this is the first study on IFG using a wide untargeted platform such as Metabolon (a previous IFG study [15] used a different platform with little overlap). We also report the novel association of the BCKA 3-methyl-2-oxovalerate with IFG both in plasma and in urine.
Carbohydrates.
As expected, glucose itself showed the strongest association with both T2D and IFG, followed by mannose, which is consistent with previous findings (3,5,16–19) and emphasizes the importance of other glucose and nonglucose pathways. In particular, dimethylarginine (SDMA and ADMA) has been more associated with the micro- and macrovascular complications than with the pathogenesis of diabetes itself; whereas the association of malate and arabinose with T2D was never reported.
Lipids.
T2D patients often present with elevated lipid profiles, and within this study, lipids (primarily the free fatty acids) make up the second largest group of T2D/IFG-associated metabolites.
Lipids with the longest chain (adrenate [22:4n6] and arachidonate [20:4n6]) are elevated in IFG patients compared with control subjects. Similarly, lipids with shorter chain (5-dodecenoate [12:1n7], heptanoate [7:0], and pelargonate [9:0]) are depleted in T2D patients relative to control subjects.
In contrast, the fatty acid chains found in triglyceride molecules in diabetes seem to act differently. Rhee et al. (9) found that triglycerides containing longer-chain fatty acids were associated with a decreased risk of diabetes, whereas triglycerides containing shorter chains were associated with an increased risk. This contrasting pattern of association may reflect alterations in triglyceride lipolysis, which could either contribute to or be a result of the dysregulation of glucose metabolism.
Among the lipids identified, the novel associations include the fatty acid 15-methlypalmitate and the medium fatty acid 5-dodecenoate (12:1n7).
Amino acids.
The third major group of metabolites are amino acids. Within this group, the BCAAs valine, isoleucine, and leucine and their BCKAs 3-methyl-2-oxovalerate, 4-methyl-2-oxopentanoate, and 3-methyl-2-oxobutyrate are significantly elevated in both individuals with IFG and subjects with T2D compared with control subjects.
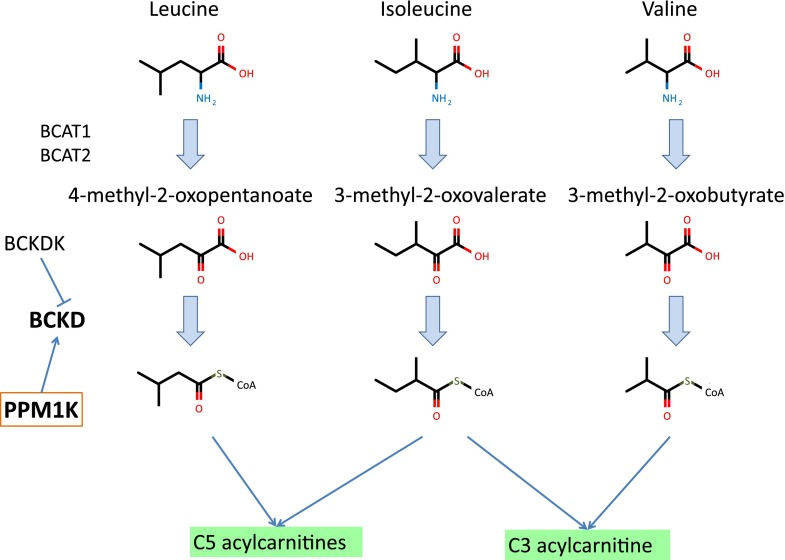
Elevated BCAA levels have previously been associated with increased risk of incident T2D (3,5,7,20) and independently predict future T2D onset (7). Breakdown products of BCAAs (propionylcarnitine, α-methylbutyrylcarnitine, and isovalerylcarnitine) were also found to be elevated (21). However, whereas previous targeted panels did not include BCKAs, the nontargeted approach used here highlighted specific effects on these important intermediates in BCAA catabolism (Fig. 2). These suggest that it may be the breakdown of BCAAs that is associated with diabetes and not specifically the elevated levels of BCAAs themselves. Consistent with this idea, a knockout of the mouse BCAT2 gene, which blocks the first step in BCAA metabolism, results in greatly elevated plasma levels of BCAAs, and yet these animals have improved glucose control, insulin sensitivity, and resistance to diet-induced obesity (22).
FIG. 2.
BCAA catabolism. The three BCAAs are first converted to BCKAs and eventually lead to the production of C3 and C5 acylcarnitines.
3-Methyl-2-oxovalerate.
Among the metabolites identified, the BCKA 3-methyl-2-oxovalerate is the strongest predictor of IFG after and independently of glucose. BCAA catabolism occurs primarily in the mitochondria, proceeding through BCAA transaminase, and then through the branched-chain α-keto-acid dehydrogenase, a complex of three separate gene products. In our companion GWAS (S.-Y.S., E.F., A.-K.P., et al., unpublished observations), SNP rs1440581 had the strongest associations with all BCAAs, all BCKAs, and the C3-acylcarnitine propionylcarnitine. This SNP is upstream of PPM1K mitochondrial phosphatase, which dephosphorylates and thereby activates the BCKD, clearly highlighting the importance of mitochondrial function for plasma levels of BCAAs and BCKAs (23). The centrality of mitochondrial function to BCAA catabolism and metabolic disease has been noted before (24). BCAA dysregulation could be a cause and/or consequence of mitochondrial dysfunction. Increased BCAA catabolism, resulting in increased BCAA catabolic intermediates, may impair mitochondrial oxidation of glucose and lipids, potentially resulting in mitochondrial stress and impaired insulin secretion and action. Reduced mitochondrial function in T2D and IFG may reduce the capacity of the mitochondria to break down BCAAs, resulting in elevated levels of BCAAs and BCKAs.
The current study has several strengths. It used a nontargeted metabolomic approach that identifies a wide range of biochemicals besides lipids. TwinsUK has phenotypic longitudinal data available that allowed us to accurately classify subjects as case, IFG, and control subjects. The availability of urine metabolites, genetic data, and twin design enabled us to explore the biological implication of 3-methyl-2-oxovalerate further. Finally, the robustness of our results is highlighted by the fact that we confirm many previous findings, and our main association reported is clearly replicated in an independent cohort and validated in urine.
Our study has some limitations. Our discovery sample consisted of women only, and some metabolites might be influenced by sex-specific hormones. Unknown metabolites might not really be new but merely not yet identified. Finally, our Mendelian randomization analysis was unable to firmly support or reject causality for the association of 3-methyl-2-oxovalerate and IFG. To explore this further, additional 3-methyl-2-oxovalerate–associated variants need to be identified and tested, boosting power and reducing the impact of potential unwanted pleiotropic confounding.
Here we find evidence that multiple metabolites from three major fuel sources (carbohydrates, lipids, and proteins) are robust risk factors for the development of both IFG and T2D. Further work is encouraged by these data, including understanding the role of diet and microbiota on the free fatty acid relationships with T2D.
ACKNOWLEDGMENTS
This study was funded by the Wellcome Trust and the European Community’s Seventh Framework Programme (FP7/2007-2013). The study also receives support from the National Institute for Health Research (NIHR) Clinical Research Facility at Guy’s and St. Thomas’ National Health Service (NHS) Foundation Trust and NIHR Biomedical Research Centre based at Guy's and St. Thomas' NHS Foundation Trust and King's College London. T.D.S. is an NIHR senior investigator and holds an ERC Advanced Principal Investigator award. J.R.B.P. is supported by the Wellcome Trust as a Sir Henry Wellcome Postdoctoral Research Fellow (092447/Z/10/Z). S-.Y.S. is supported by a postdoctoral research fellowship from the Oak Foundation. N.S.'s team is supported by the Wellcome Trust (grants WT098051 and WT091310) and the European Community's Seventh Framework Programme (EPIGENESYS Grant 257082 and BLUEPRINT Grant HEALTH-F5-2011-282510).
Part of this work was funded by Pfizer Worldwide Research and Development. M.M. and R.P.M. are employees of Metabolon, Inc. E.F., C.H., J.T., and M.J.B. are full-time employees and shareholders of Pfizer. No other potential conflicts of interest relevant to this article were reported.
C.M. analyzed the data and wrote the manuscript. E.F. and M.P. wrote the manuscript. I.E. and C.H. analyzed the data. J.R.B.P. contributed reagents/materials/analysis tools and wrote the manuscript. G.K. analyzed the replication dataset. S.-Y.S., A.-K.P., and W.Y. contributed reagents/materials/analysis tools. K.J.W. and J.T.B. reviewed and edited the manuscript. M.M. performed the experiments. C.N.A.P. performed the experiments and contributed reagents/materials/analysis tools. T.M.F. contributed reagents/materials/analysis tools and reviewed and edited the manuscript. J.T. and C.G. conceived and designed the experiments. R.P.M. performed the experiments and reviewed and edited the manuscript. M.J.B. and T.D.S. conceived and designed the experiments and wrote the manuscript. K.S. and N.S. conceived and designed the experiments and reviewed and edited the manuscript. T.D.S. is the guarantor of this work and, as such, had full access to all the data in the study and takes responsibility for the integrity of the data and the accuracy of the data analysis.
The authors thank Sally John, Carol Hicks, Li Xi, and Vinicius Bonato (Pfizer Worldwide Research and Development) for their contributions. The authors thank Gabriela Surdulescu and Dylan Hodgkiss (King’s College London) for sample selection, sample handling, and shipment. The authors are grateful to the DIAGRAM consortium for sharing data (http://diagram-consortium.org/). Finally, the authors wish to express their appreciation to all study participants of the TwinsUK and KORA studies for donating their blood and time.
REFERENCES
- 1.Noble D, Mathur R, Dent T, Meads C, Greenhalgh T. Risk models and scores for type 2 diabetes: systematic review. BMJ 2011;343:d7163. [DOI] [PMC free article] [PubMed] [Google Scholar]
- 2.Galazis N, Iacovou C, Haoula Z, Atiomo W. Metabolomic biomarkers of impaired glucose tolerance and type 2 diabetes mellitus with a potential for risk stratification in women with polycystic ovary syndrome. Eur J Obstet Gynecol Reprod Biol 2012;160:121–130 [DOI] [PubMed] [Google Scholar]
- 3.Gall WE, Beebe K, Lawton KA, et al. Alpha-hydroxybutyrate is an early biomarker of insulin resistance and glucose intolerance in a nondiabetic population. PLoS ONE 2010;5:e10883. [DOI] [PMC free article] [PubMed] [Google Scholar]
- 4.Stancakova A, Civelek M, Saleem NK, et al. Hyperglycemia and a common variant of GCKR are associated with the levels of eight amino acids in 9,369 Finnish men. Diabetes 2012;61:1895–1902 [DOI] [PMC free article] [PubMed] [Google Scholar]
- 5.Suhre K, Meisinger C, Doring A, et al. Metabolic footprint of diabetes: a multiplatform metabolomics study in an epidemiological setting. PLoS ONE 2010;5:e13953. [DOI] [PMC free article] [PubMed] [Google Scholar]
- 6.Floegel A, Stefan N, Yu Z, et al. Identification of serum metabolites associated with risk of type 2 diabetes using a targeted metabolomic approach. Diabetes 2013;62:639–648 [DOI] [PMC free article] [PubMed] [Google Scholar]
- 7.Wang TJ, Larson MG, Vasan RS, et al. Metabolite profiles and the risk of developing diabetes. Nat Med 2011;17:448–453 [DOI] [PMC free article] [PubMed] [Google Scholar]
- 8.Tabak AG, Jokela M, Akbaraly TN, Brunner EJ, Kivimaki M, Witte DR. Trajectories of glycaemia, insulin sensitivity, and insulin secretion before diagnosis of type 2 diabetes: an analysis from the Whitehall II study. Lancet 2009;373:2215–2221 [DOI] [PMC free article] [PubMed] [Google Scholar]
- 9.Rhee EP, Cheng S, Larson MG, et al. Lipid profiling identifies a triacylglycerol signature of insulin resistance and improves diabetes prediction in humans. J Clin Invest 2011;121:1402–1411 [DOI] [PMC free article] [PubMed] [Google Scholar]
- 10.Moayyeri A, Hammond CJ, Valdes AM, Spector TD. Cohort profile: TwinsUK and healthy ageing twin study. Int J Epidemiol 2013;42:76–85 [DOI] [PMC free article] [PubMed] [Google Scholar]
- 11.Menni C, Kastenmuller G, Petersen AK, et al. Metabolomic markers reveal novel pathways of aging and early development in human populations. Int J Epidemiol 2013;42:1111–1119 [DOI] [PMC free article] [PubMed] [Google Scholar]
- 12.Wichmann HE, Gieger C, Illig T. KORA-gen–resource for population genetics, controls and a broad spectrum of disease phenotypes. Gesundheitswesen 2005;67(Suppl. 1):S26–S30 [DOI] [PubMed] [Google Scholar]
- 13.Morris AP, Voight BF, Teslovich TM, et al. Large-scale association analysis provides insights into the genetic architecture and pathophysiology of type 2 diabetes. Nat Genet 2012;44:981–990 [DOI] [PMC free article] [PubMed] [Google Scholar]
- 14.Zhou K, Bellenguez C, Spencer CC, et al. Common variants near ATM are associated with glycemic response to metformin in type 2 diabetes. Nat Genet 2011;43:117–120 [DOI] [PMC free article] [PubMed] [Google Scholar]
- 15.Wang-Sattler R, Yu Z, Herder C, et al. Novel biomarkers for pre-diabetes identified by metabolomics. Mol Syst Biol 2012;8:615. [DOI] [PMC free article] [PubMed] [Google Scholar]
- 16.Crawford SO, Hoogeveen RC, Brancati FL, et al. Association of blood lactate with type 2 diabetes: the Atherosclerosis Risk in Communities Carotid MRI Study. Int J Epidemiol 2010;39:1647–1655 [DOI] [PMC free article] [PubMed] [Google Scholar]
- 17.van Doorn M, Vogels J, Tas A, et al. Evaluation of metabolite profiles as biomarkers for the pharmacological effects of thiazolidinediones in type 2 diabetes mellitus patients and healthy volunteers. Br J Clin Pharmacol 2007;63:562–574 [DOI] [PMC free article] [PubMed] [Google Scholar]
- 18.Zhang X, Wang Y, Hao F, et al. Human serum metabonomic analysis reveals progression axes for glucose intolerance and insulin resistance statuses. J Proteome Res 2009;8:5188–5195 [DOI] [PubMed] [Google Scholar]
- 19.Zhao X, Fritsche J, Wang J, et al. Metabonomic fingerprints of fasting plasma and spot urine reveal human pre-diabetic metabolic traits. Metabolomics 2010;6:362–374 [DOI] [PMC free article] [PubMed] [Google Scholar]
- 20.Fiehn O, Garvey WT, Newman JW, Lok KH, Hoppel CL, Adams SH. Plasma metabolomic profiles reflective of glucose homeostasis in non-diabetic and type 2 diabetic obese African-American women. PLoS ONE 2010;5:e15234. [DOI] [PMC free article] [PubMed] [Google Scholar]
- 21.Newgard CB, An J, Bain JR, et al. A branched-chain amino acid-related metabolic signature that differentiates obese and lean humans and contributes to insulin resistance. Cell Metab 2009;9:311–326 [DOI] [PMC free article] [PubMed] [Google Scholar]
- 22.She P, Reid TM, Bronson SK, et al. Disruption of BCATm in mice leads to increased energy expenditure associated with the activation of a futile protein turnover cycle. Cell Metab 2007;6:181–194 [DOI] [PMC free article] [PubMed] [Google Scholar]
- 23.Lu G, Sun H, She P, et al. Protein phosphatase 2Cm is a critical regulator of branched-chain amino acid catabolism in mice and cultured cells. J Clin Invest 2009;119:1678–1687 [DOI] [PMC free article] [PubMed] [Google Scholar]
- 24.Newgard CB. Interplay between lipids and branched-chain amino acids in development of insulin resistance. Cell Metab 2012;15:606–614 [DOI] [PMC free article] [PubMed] [Google Scholar]
- 25.Wu JH, Lemaitre RN, Manichaikul A, et al. Genome-wide association study identifies novel loci associated with concentrations of four plasma phospholipid fatty acids in the de novo lipogenesis pathway: results from the CHARGE consortium. Circ Cardiovasc Genet 2013;6:171–183 [DOI] [PMC free article] [PubMed] [Google Scholar]


