Abstract
The liver responds to an increase in blood glucose levels in the postprandial state by uptake of glucose and conversion to glycogen. Liver glycogen synthase (GYS2), a key enzyme in glycogen synthesis, is controlled by a complex interplay between the allosteric activator glucose-6-phosphate (G6P) and reversible phosphorylation through glycogen synthase kinase-3 and the glycogen-associated form of protein phosphatase 1. Here, we initially performed mutagenesis analysis and identified a key residue (Arg582) required for activation of GYS2 by G6P. We then used GYS2 Arg582Ala knockin (+/R582A) mice in which G6P-mediated GYS2 activation had been profoundly impaired (60–70%), while sparing regulation through reversible phosphorylation. R582A mutant–expressing hepatocytes showed significantly reduced glycogen synthesis with glucose and insulin or glucokinase activator, which resulted in channeling glucose/G6P toward glycolysis and lipid synthesis. GYS2+/R582A mice were modestly glucose intolerant and displayed significantly reduced glycogen accumulation with feeding or glucose load in vivo. These data show that G6P-mediated activation of GYS2 plays a key role in controlling glycogen synthesis and hepatic glucose-G6P flux control and thus whole-body glucose homeostasis.
The liver plays a central role in maintaining blood glucose homeostasis by uptake of glucose in the postprandial state and conversion to glycogen and triglyceride and by production of glucose in the postabsorptive state by glycogenolysis and gluconeogenesis (1,2). Defects in the mechanisms by which glucose and insulin regulate hepatic glycogen metabolism disrupt blood glucose homeostasis and are highly associated with metabolic disorders such as type 2 diabetes (3) and glycogen storage disease (4,5).
The rate-limiting enzyme for glycogen synthesis is glycogen synthase (GS), which catalyzes the addition of α-1,4–linked glucose units from uridine diphosphate (UDP) glucose to a nascent glycogen chain (5,6). In mammals, there are two GS isoforms: muscle GS (encoded by GYS1), which is abundantly expressed in skeletal and cardiac muscles, and the liver-restricted isoform (encoded by GYS2) (7). Activity of both isoforms is regulated by phosphorylation at multiple sites and allosteric effectors of which glucose-6-phosphate (G6P) is the most important (5,8). G6P functions as an allosteric activator of the phosphorylated enzyme, and even hyperphosphorylated GS can be fully activated by saturating concentrations of G6P in cell-free assays. Dephosphorylation activates GS and also results in significant changes in kinetic properties, decreasing the Km for the substrate UDP glucose and the A0.5 for G6P (9,10). Despite decades of intensive research, the relative importance of these two regulatory mechanisms, particularly the contribution of allosteric regulation to the control of GS and glycogen storage in liver in vivo, is not established. This is mainly due to the complex interplay between multiple phosphorylation sites and allosteric effectors and most notably the lack of robust experimental tools.
A well-defined pathway has been established by which insulin is thought to stimulate GS and the deposition of glycogen in tissues. Activated protein kinase B (PKB) phosphorylates and inhibits GS kinase 3 (GSK3), which is itself a negative regulator of GS through phosphorylation at COOH-terminal residues (11). To determine the role that phospho-dependent regulation of GS by GSK3 plays in controlling glycogen metabolism, we previously generated knockin mice expressing constitutively active mutants of GSK3 in which the PKB phosphorylation sites on GSK3α (S21) and GSK3β (S9) were substituted by Ala (12). In addition, Patel and colleagues (13,14) have recently generated mice in which GSK3α or GSK3β was specifically ablated in liver. Strikingly, all GSK3 knockin and conditional GSK3 knockout animals displayed normal levels of liver glycogen upon feeding.
In liver, elevated intracellular glucose levels have been proposed to stimulate GYS2 by a mechanism involving a liver-specific glycogen-targeting subunit, GL (2). GYS2 is dephosphorylated and activated by protein phosphatase-1 (PP1) complexed with GL. GL also interacts with the activated form of glycogen phosphorylase (GPa), which antagonizes activation of GS through PP1-GL. When blood glucose levels are elevated, glucose binds to hepatic GPa and stabilizes the enzyme in the inactive conformation (GPb). Glycogenolysis is switched off, and inhibition of PP1-GL is blocked, allowing PP1-GL to dephosphorylate and activate GS and promote glycogen deposition in the liver. Kelsall et al. (15) reported that binding between GL and GP could be disrupted by a single point mutation (GLY284→F) and generated a knockin mouse model carrying this mutation to examine the physiological role of this allosteric interaction in hepatic glycogen metabolism in vivo (16). Although GYS2 activity was significantly increased after a short fast, liver glycogen levels in fed GLY284F mice were comparable with those observed in wild-type (WT) controls (15,16).
Based on these studies (12–14,16) and early observations demonstrating a tight linear relationship between intracellular concentrations of G6P and GYS2 activation in hepatocytes (8,17), we hypothesized that allosteric activation of GYS2 by G6P plays a key role in regulating hepatic glycogen synthesis. In the current study, we identified residues essential for G6P-mediated activation of GYS2 and generated a knockin mouse expressing a G6P-insensitive GYS2 mutant. Here, we report genetic evidence that G6P-mediated allosteric activation of GYS2 plays an important role in hepatic glycogen synthesis.
RESEARCH DESIGN AND METHODS
Animal studies were approved by the University of Dundee ethics committee and performed under a U.K. Home Office project license or the Barcelona Science Park’s Animal Experimentation Committee and in accordance with the European Community Council Directive and the National Institute of Health guidelines for the care and use of laboratory animals or the Vanderbilt University Animal Care and Use Committee. C57BL/6J GYS2+/R582A knockin mice were generated by TaconicArtemis. GLY284F/Y284F knockin mice were generated as previously described (16). GYS2 knockout mice [Gys2tm1a(KOMP)Wtsi] were generated by the Sanger Institute Mouse Genetics Project and have been backcrossed to the C57BL/6J strain for more than eight generations. All animals were maintained on a 12/12-h light/dark cycle and had free access to standard chow and water. Animals were 8–12 weeks old at the time of the experiment unless otherwise indicated.
GS assay.
GS activity in muscle and liver lysates was measured by a modification of the method of Thomas et al. (18) with or without saturating G6P and 1.5 mmol/L (muscle) or 5 mmol/L (liver) UDP glucose.
Glucose utilization.
After overnight incubation, mouse hepatocytes were transferred to M199 medium containing 5.5 mmol/L glucose and 20 mmol/L HEPES and rested for 2 h prior to labeling with 25 mmol/L glucose containing 0.2 mCi/mmol [14C(U)]d-glucose in the presence of 10 nmol/L insulin or 10 μmol/L Cpd A for 2 h. [14C]-CO2 was released by acidification of conditioned media and trapped in 1 mol/L benzethonium hydroxide. Cell monolayers were washed and scrapped into ice-cold PBS and lipids extracted according to the method of Bligh and Dyer (19). Extracts were applied to Partisil K6 silica TLC plates and neutral lipids resolved in petroleum ether:diethyl ether:acetic acid (70:30:1). Lipids were stained with iodine vapor and selected species scraped into scintillation vials and eluted with 1:1 ethanol:TritonX-100. Glycogen was recovered from the particulate material remaining after the Bligh and Dyer extraction by digestion in 30% (w/v) KOH and precipitation with 66% ethanol. [14C] incorporation was determined by scintillation counting.
Euglycemic-hyperinsulinemic clamp.
Catheters were implanted into the carotid artery and jugular vein of mice for sampling and infusions, respectively, 5 days before the study as previously described (20). Experimental details are described in the Supplementary Data.
Statistics.
Data are expressed as means ± SE. Statistical analysis was performed using two-way ANOVA or one-way ANOVA using Tukey or Dunn post hoc tests for multiple comparisons where appropriate. Differences between groups were considered statistically significant when P < 0.05.
RESULTS
Identification of G6P-resistant GYS2 mutant(s) by targeted mutagenesis.
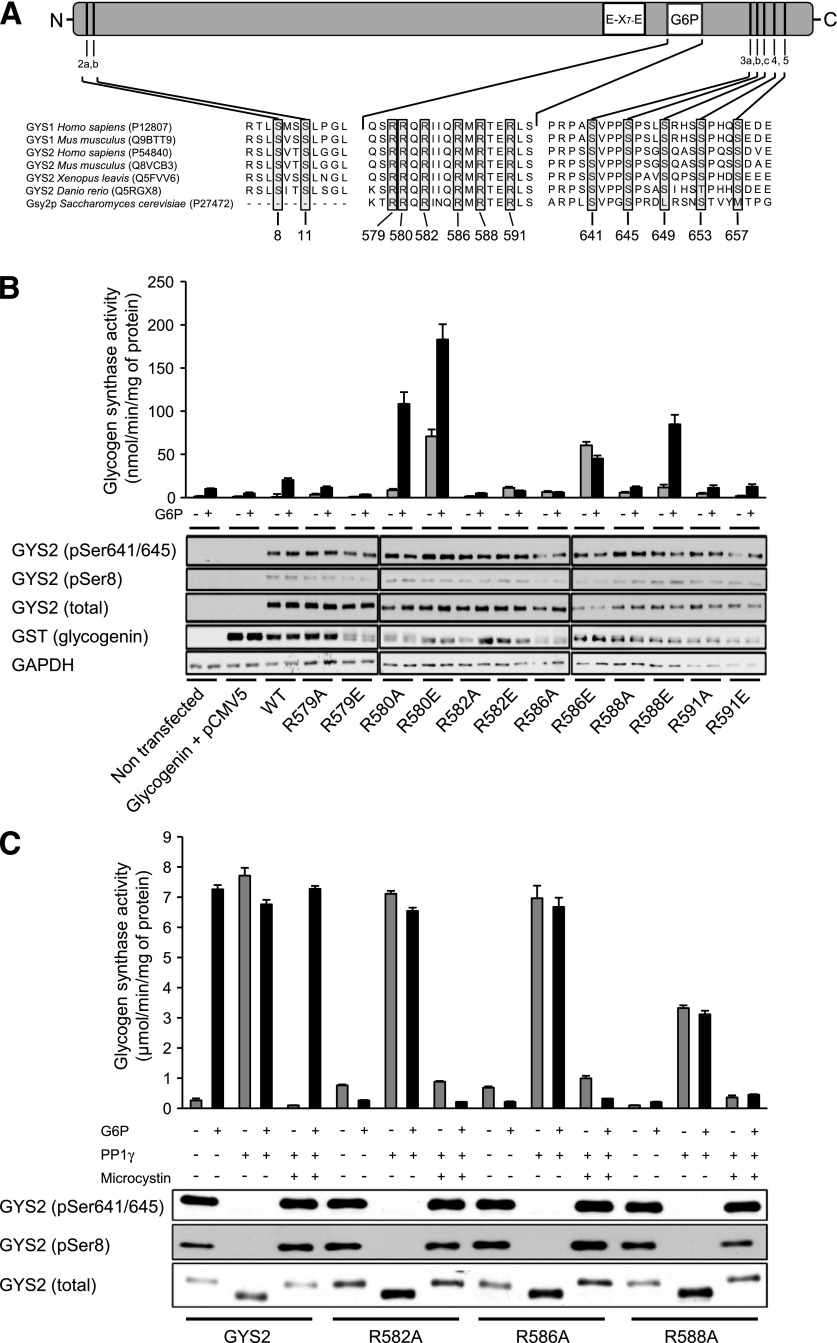
To identify residues essential for the activation of GS by G6P, we generated a series of GYS2 mutants containing Ala substitutions in the basic region identified as critical for G6P sensitivity in the yeast homolog, Gsy2p (Fig. 1A) (22). Human embryonic kidney (HEK) 293 cells were cotransfected with untagged GYS2 constructs and the glycogenesis primer, glycogenin, which enhances soluble expression (23). Immunoblotting confirmed the absence of endogenous GYS2 in these cells and near-equal expression and phosphorylation for all mutants (Fig. 1B). When lysates were assayed for glucosyltransferase activity, addition of saturating G6P to WT GYS2 resulted in ∼30-fold increase in activity. Taking this into account, the activity of R582A, R586A, and R588A was essentially unaffected by G6P, while the remaining mutants either displayed markedly elevated G6P-independent activity or were normally activated by G6P (Fig. 1B).
FIG. 1.
Mutagenesis and biochemical analysis to identify G6P-insensitive GYS2 mutants. A: Domain structure of GYS2 and sequence alignment of the G6P binding site, catalytic domain (E-X7-E, two catalytic glutamic acid residues separated by 7 amino acids), and NH2- and COOH-terminal phosphorylation sites. UniProt accession numbers are indicated in brackets. B: Arg residues located in the G6P-binding region shown in A were mutated individually either Ala or Glu. Constructs expressing WT or mutant GYS2 were cotransfected with GST-tagged glycogenin in HEK293 cells. Cell lysates were immunoblotted with the indicated antibodies or assayed for GS activity ± G6P (10 mmol/L). Results are representative of three independent experiments (n = 2/condition). C: Equal quantities of purified GYS2 mutants were dephosphorylated in vitro using PP1γ. Microcystin LR was used as a negative control. Mock and PP1γ-treated GYS2 mutants were assayed for GS activity ± G6P and immunoblotted to confirm equal loading and dephosphorylation of critical regulatory sites. GAPDH, glyceraldehyde-3-phosphate dehydrogenase.
Ectopically expressed GS in HEK 293 cells is heavily phosphorylated and essentially inactive without G6P (Fig. 1B). To ensure that the G6P-insensitive GYS2 mutants were not catalytically inactive, we dephosphorylated isolated protein in vitro with PP1γ, which renders the enzymes G6P independent. WT and mutant GYS2 were efficiently dephosphorylated by PP1γ (Fig. 1C). As expected, dephosphorylation of WT GYS2 was associated with a robust increase in GS activity without G6P, which was ablated in the presence of the PP1 inhibitor, microcystin. R582A and R586A were similarly activated by dephosphorylation, whereas R588A was activated to ∼50% of WT (Fig. 1C). These results demonstrate that R582 and R586 are essential for allosteric activation of GYS2 by G6P and can be substituted for Ala to generate mutant enzymes that are resistant to G6P yet retain normal expression, phosphorylation, and phospho-dependent activity.
The crystal structure of yeast Gsy2p in complex with G6P has been solved, which revealed that His286, Lys90, His500, Arg583, and Arg587 make important side chain interactions with G6P (24). The latter two residues, Arg583/587, correspond with Arg582/586 in mouse GYS2 and mediate essential interactions with the phosphate group of G6P.
G6P-insensitive GYS2 mutant exhibits markedly lower glycogen accumulation in hepatocytes.
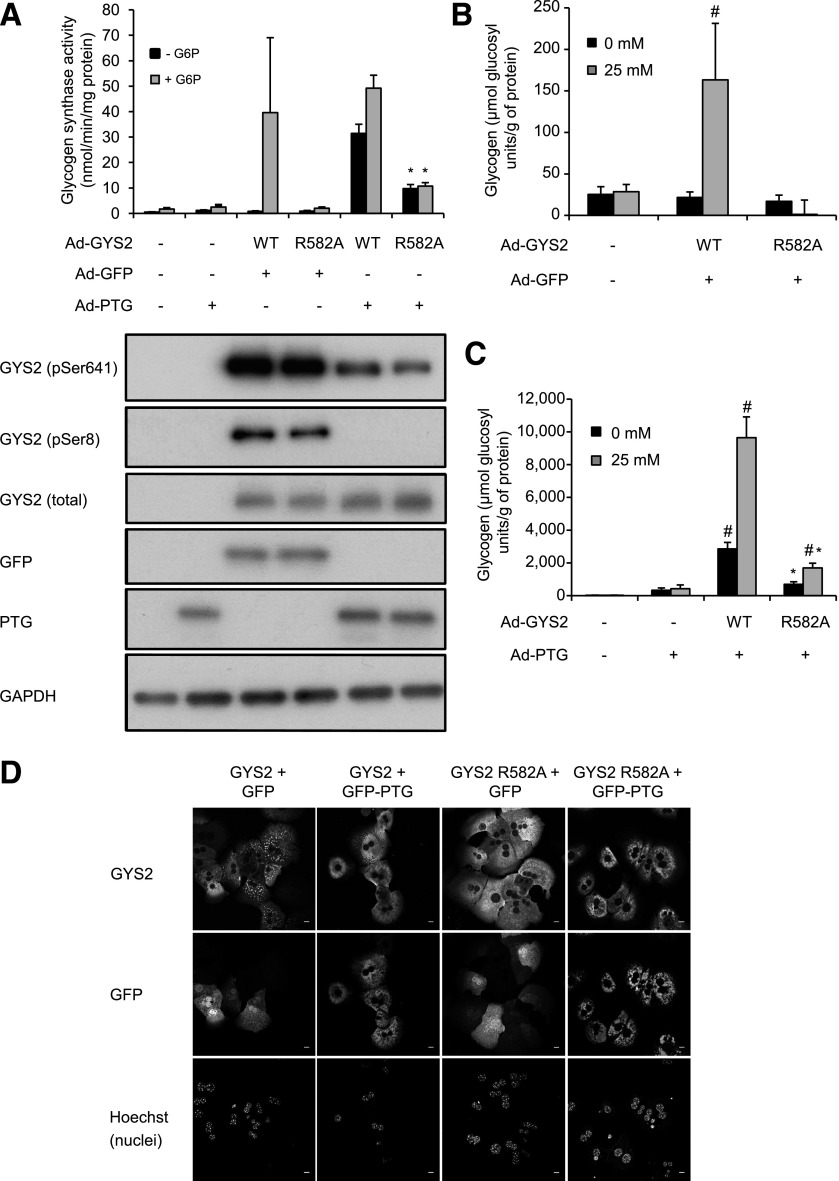
To assess the role of G6P-mediated activation of GYS2 in a cellular context, we introduced WT or R582A GYS2 constructs using adenovirus into primary hepatocytes isolated from GYS2−/− mice. In parallel, GYS2 constructs were coinfected with adenovirus encoding green fluorescent protein (GFP) (negative control) or GFP fused with protein targeting to glycogen (PTG) in order to promote glycogen accumulation by dephosphorylation/activation of GYS2 (25,26). It was anticipated that PTG-driven glycogen accumulation would be unaffected in R582A-expressing hepatocytes. We observed that expression of R582A was lower when the same amount (multiplicity of infection = 8) of adenovirus was used, and thus we used a higher amount (multiplicity of infection = 16) of R582A-encoding adenovirus to have expression similar to that of WT. Both WT and R582A displayed negligible G6P-independent activity due to high basal phosphorylation (Fig. 2A). Glucokinase (GK) expression was comparable between WT- and R582A-expressed hepatocytes (Supplementary Fig. 5). WT activity was robustly increased by G6P, whereas R582A was unaffected (Fig. 2A). PTG coexpression reduced phosphorylation of both WT and R582A, which was associated with enhanced G6P-independent activity. However, G6P-independent activity of R582A only reached ∼30% of WT (Fig. 2A). GYS2-null hepatocytes contained only trace levels of glycogen, which was unaffected by hyperglycemic culture (Fig. 2B). Expression of WT, but not R582A, promoted a modest accumulation of glycogen in high glucose. With coexpression of PTG, there was a profound increase in glycogen content in WT-expressing hepatocytes and also, albeit to a lesser extent, in R582A-expressing cells (Fig. 2C). In addition, the levels of glycogen were associated with the degree of G6P-independent GS activity promoted by dephosphorylation (Fig. 2A).
FIG. 2.
Adenoviral overexpression and dephosphorylation of GYS2 R582A in primary hepatocytes from GYS2 knockout mice. A: Primary hepatocytes were isolated from GYS2−/− mice and coinfected with adenovirus (Ad) expressing GYS2 WT or GYS2 R582A and PTG-GFP or GFP for 2 h followed by media replacement and overnight incubation. Subsequently, cells were incubated with or without 25 mmol/L glucose for 6 h prior to harvesting. Lysates were assayed for GS activity ± G6P (7.1 mmol/L) (n = 2–3 from three independent experiments) and subjected to immunoblotting using the indicated antibodies. Representative immunoblots shown from three independent experiments. *P < 0.05 respective (− or +G6P) GYS2 WT (+PTG) vs. GYS2 R582A (+PTG) (n = 3). B and C: Glycogen levels in primary hepatocytes after coinfection with Ad-GYS2 and Ad-GFP (B) or Ad-PTG (C). #P < 0.05 respective (0 mmol/L or 25 mmol/L glucose) non-GYS2 infection vs. WT or R582A. *P < 0.05 respective (0 mmol/L or 25 mmol/L glucose) WT vs. R582A (n = 4). D: Hepatocytes were seeded on collagen-coated glass coverslips and incubated with 25 mmol/L glucose for 6 h, followed by fixing in 4% paraformaldehyde, and stained for total GYS2 and GFP. Nuclei are stained using Hoechst 33342. Confocal images were taken with a Leica SP2 microscope using a ×63 objective without confocal magnification. Results are representative of three independent experiments (n = 3/condition). The scale bar represents 10 μm. GAPDH, glyceraldehyde-3-phosphate dehydrogenase.
Localization of exogenously expressed GYS2 in GYS2−/− hepatocytes was analyzed by immunofluorescence. WT GYS2 localized to defined structures most likely associated with sites of active glycogen synthesis. In contrast, R582A showed a disperse localization throughout the cytoplasm (Fig. 2D), likely due to the absence of glycogen as previously suggested (27,28). When GYS2−/− hepatocytes were coinfected with PTG, WT GYS2 and PTG colocalized to the same structures. Strikingly, under these conditions R582A was also recruited toward defined structures together with PTG.
Generation and characterization of G6P-insensitive GYS2 knockin mice.
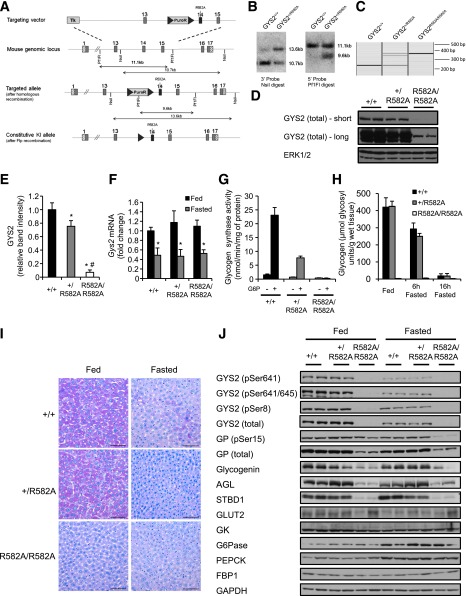
For further characterization of the roles that allosteric activation of GYS2 by G6P plays in hepatic glycogen metabolism and glucose homeostasis in vivo, a knockin mouse (Arg582→Ala) was generated (Fig. 3A–C). GYS2R582A/R582A mice displayed normal growth curves (3–15 weeks of age) in both males and females (Supplementary Fig. 1A).
FIG. 3.
Targeting strategy used to generate GYS2R582A knockin mice, expression and activity of GYS2, liver glycogen levels, and expression of key glycogen-associated and metabolic proteins in GYS2+/+, GYS2+/R582A, and GYS2R582A/R582A mice. A: Diagram showing the endogenous Gys2 allele, the targeting knockin construct, the targeted allele with neomycin selection cassette (NEO) still present, and the targeted allele with NEO removed by Flp recombinase. The gray boxes represent exons (13–16), and the gray triangles represent the flippase recombination target sites. The knockin allele containing the R582A mutation in exon 14 is illustrated as a black rectangle. B: Genomic DNA isolated from targeted embryonic stem cells from the indicated genotypes was digested with NsiI or Pf1FI and subjected to Southern blot analysis with the corresponding DNA probes. C: Genomic DNA isolated from mouse ear biopsies was subjected to PCR analysis. The WT allele produces a 244 bp DNA fragment, while the knockin allele produces a 362 bp fragment. D: Equal amounts of liver lysate from the indicated genotypes were immunoblotted for total GYS2, and representative short and long film exposures are shown. Extracellular signal–related kinase (ERK)1/2 was used as a loading control (n = 4–6/group). E: GYS2 expression in liver was quantified by immunoblotting using a Li-COR Odyssey infrared imaging system and normalized to glyceraldehyde-3-phosphate dehydrogenase (GAPDH). *P < 0.05 GYS2+/+ vs. other genotypes; #P < 0.05 GYS2+/R582A vs. GYS2R582A/R582A (n = 6/group). F: Total mRNA was isolated from liver of ad libitum fed and overnight fasted mice and Gys2 mRNA quantified by qPCR. Data were normalized to Gys2 mRNA levels in ad libitum–fed GYS2+/+ mice. *P < 0.05 fed vs. fasted (n = 6/group). G: GS activity was measured in liver lysates from ad libitum–fed mice ± 10 mmol/L G6P (n = 6/group). H: Glycogen levels were determined in fed (ad libitum) and fasted (6 or 16 h) liver samples (n = 4–8/group). I: Periodic acid Schiff staining of paraffin-embedded liver sections from ad libitum–fed and fasted mice. Sections were counterstained for hematoxylin-eosin (n = 3–6/group). J: Liver lysate from ad libitum–fed and overnight fasted mice was immunoblotted using the indicated antibodies (n = 6). GAPDH was used as a loading control. Representative immunoblots of three independent experiments are shown.
Unexpectedly, immunoblotting of liver extracts revealed that GYS2 expression was markedly reduced in GYS2R582A/R582A and modestly in GYS2+/R582A mice compared with GYS2+/+ by 93% and 27%, respectively (Fig. 3D and E). Gys2 mRNA levels were unaffected, which excludes the possibility of hypomorphism from the R582A knockin allele (Fig. 3F). For assessment of whether reduced GYS2 expression in GYS2+/R582A mice originated from the WT or R582A knockin allele, GS activity in liver extracts from all three genotypes was measured with or without G6P. In GYS2+/R582A mice, G6P-dependent activity was significantly reduced (67%) compared with that of WT, while the GS activity ratio (−/+G6P) was comparable. In GYS2R582A/R582A mice, only residual GS activity was detected. Comparing the magnitude of decrease in GYS2 expression (27%) with that of G6P-dependent GS activity (67%) in GYS2+/R582A relative to GYS2+/+ suggests that the knockin allele was significantly expressed at the protein level in GYS2+/R582A mice (Fig. 3G).
We next measured liver glycogen levels in fed mice and observed that there was no significant difference between GYS2+/+ and GYS2+/R582A mice, while glycogen levels were drastically reduced (96%) in GYS2R582A/R582A mice (Fig. 3H). Periodic acid Schiff staining of liver sections also confirmed similar hepatic glycogen content between GYS2+/+and GYS2+/R582A and the near absence of glycogen in fed GYS2R582A/R582A hepatocytes (Fig. 3I).
It is possible that the near absence of hepatic glycogen in GYS2R582A/R582A mice globally affected expression or stability of glycogen-interacting proteins. Interestingly, immunoblot analysis revealed that key glycosome proteins (29) such as glycogen debranching enzyme (AGL), glycogenin, glycogen phosphorylase (GP), and starch-binding domain–containing protein 1 (STBD1) were reduced in GYS2R582A/R582A mice in both fed and fasted states (Fig. 3J). In contrast, other key metabolic proteins mediating glucose transport (GLUT2), glucose phosphorylation/dephosphorylation (GK/G6Pase), or gluconeogenesis (FBP1 and PEPCK) were detected in similar quantities (Fig. 3J). Thus, the loss of glycogen might have affected the levels of glycogen-bound proteins, while other proteins involved in liver glucose metabolism were unchanged.
Glucose utilization and metabolic adaptations in primary hepatocytes carrying GYS2 R582A mutation.
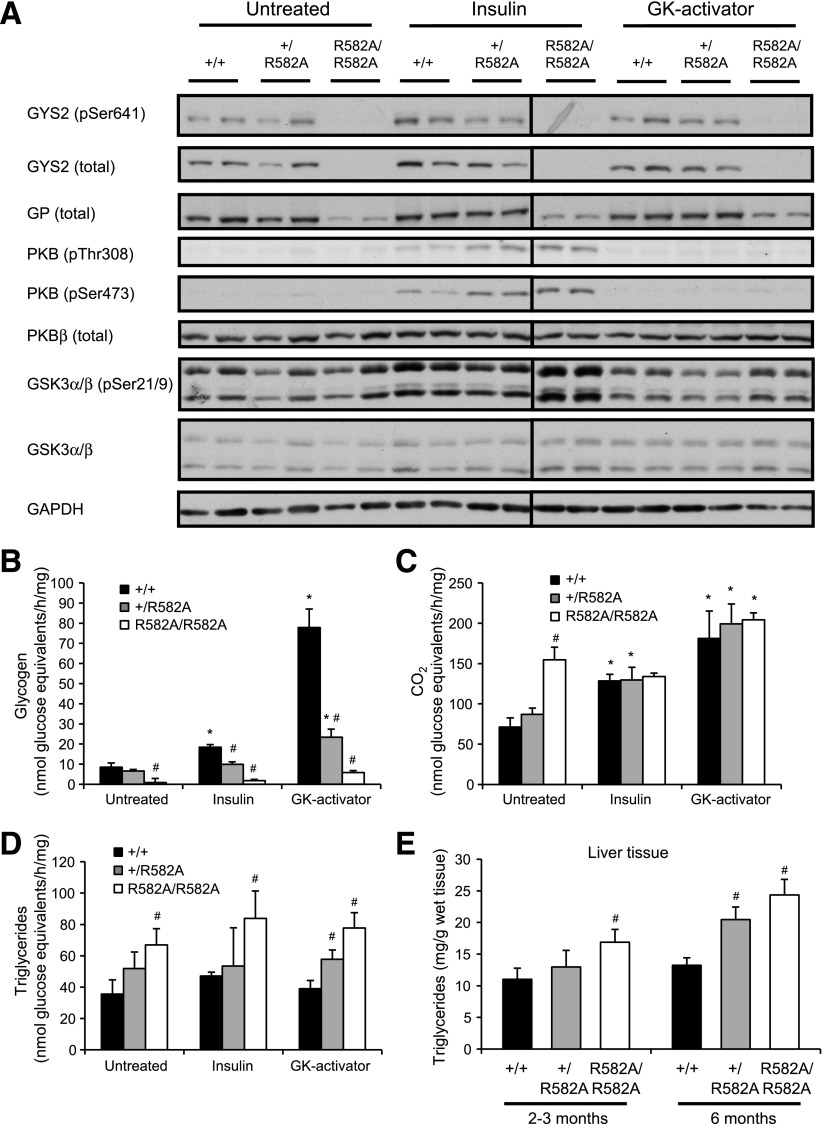
For determination of the physiological consequence of reduced G6P-mediated activation or hepatic GYS2 deficiency on glucose metabolism/flux, glucose utilization by primary hepatocytes was estimated using [14C(U)]glucose labeling with or without insulin or GK-activator (CpdA). CpdA was used to promote phosphorylation of glucose and thereby raise [G6P]i. GYS2 expression was marginally reduced (10–20%) in GYS2+/R582A hepatocytes compared with GYS2+/+ cells, while GYS2 expression in GYS2R582A/R582A hepatocytes was negligible (Fig. 4A). Likewise, GP expression was selectively reduced in GYS2R582A/R582A hepatocytes (Fig. 4A), as observed in liver lysates (Fig. 3J). Insulin, but not CpdA, stimulated phosphorylation of PKB and GSK3α/β in all genotypes to a similar extent. Unstimulated hepatocytes from GYS2+/+ and GYS2+/R582A mice exhibited low levels of [14C(U)]glucose incorporation into glycogen, whereas only trace labeling was detected in GYS2R582A/R582A hepatocytes (Fig. 4B). Glucose oxidation was significantly increased in resting GYS2R582A/R582A hepatocytes as well as [14C] incorporation into triglyceride (Fig. 4C and D). Insulin modestly but significantly increased [14C]glucose incorporation into glycogen in hepatocytes from GYS2+/+ (2.2-fold) and GYS2+/R582A (1.5-fold), but no increase was observed in GYS2R582A/R582A hepatocytes. Treatment of primary hepatocytes with CpdA resulted in a robust increase in [14C]glucose incorporation into glycogen in GYS2+/+ hepatocytes. Although CpdA significantly stimulated glycogen synthesis (3.5-fold) in GYS2+/R582A, absolute rates of synthesis were markedly lower (71%) compared with GYS2+/+ hepatocytes. GYS2R582A/R582A hepatocytes failed to accumulate detectable levels of glycogen even with CpdA (Fig. 4B). Taken together, these results show that primary hepatocytes isolated from GYS2+/R582A mice exhibit a significantly impaired ability to synthesize glycogen, which was more pronounced when [G6P]i was raised by CpdA. Moreover, hypomorphic GYS2R582A/R582A hepatocytes, incapable of accumulating glycogen, showed an altered glucose flux favoring lipogenesis. This was corroborated by significantly elevated liver triglyceride in fed GYS2R582A/R582A mice (Fig. 4E). Young (2–3 months) GYS2R582A/R582A mice showed a significant increase in liver triglyceride levels (16.9 ± 2.0 mg/g tissue) compared with GYS2+/+ (11.0 ± 1.8 mg/g). Older (6 months) GYS2+/R582A (20.5 ± 2.0 mg/g) and GYS2R582A/R582A mice (24.3 ± 2.3 mg/g) had significantly higher levels of triglycerides compared with both young mice of the same genotype and GYS2+/+ (Fig. 4E).
FIG. 4.
Glucose utilization in primary hepatocytes isolated from GYS2+/+, GYS2+/R582A, and GYS2R582A/R582A mice. A–D: Primary hepatocytes were isolated from fasted mice and incubated overnight in low glucose (5.5 mmol/L). Medium was changed to 25 mmol/L glucose containing [14C(U)]glucose, and cells were treated with or without insulin (10 nmol/L) or GK activator (10 μmol/L) for 2 h. [14C]glucose incorporation into CO2, glycogen, and lipid was determined as described in research design and methods. #P < 0.05 GYS2+/+ vs. other genotypes; *P < 0.05 untreated vs. insulin or GK activator (n = 4/group). A: Immunoblots of cell lysates from hepatocytes treated as described above in the absence of tracer. B: [14C]glucose incorporation into glycogen. C: Production of [14C]CO2. D: [14C]glucose incorporation into triglycerides. E: Liver triglyceride levels from ad libitum–fed mice of 2–3 and 6 months of age. #P < 0.05 GYS2+/+ vs. other genotypes (n = 6–10/group). GAPDH, glyceraldehyde-3-phosphate dehydrogenase.
Reduced G6P-dependent GYS2 activation causes impaired hepatic glycogen synthesis after glucose administration or refeeding.
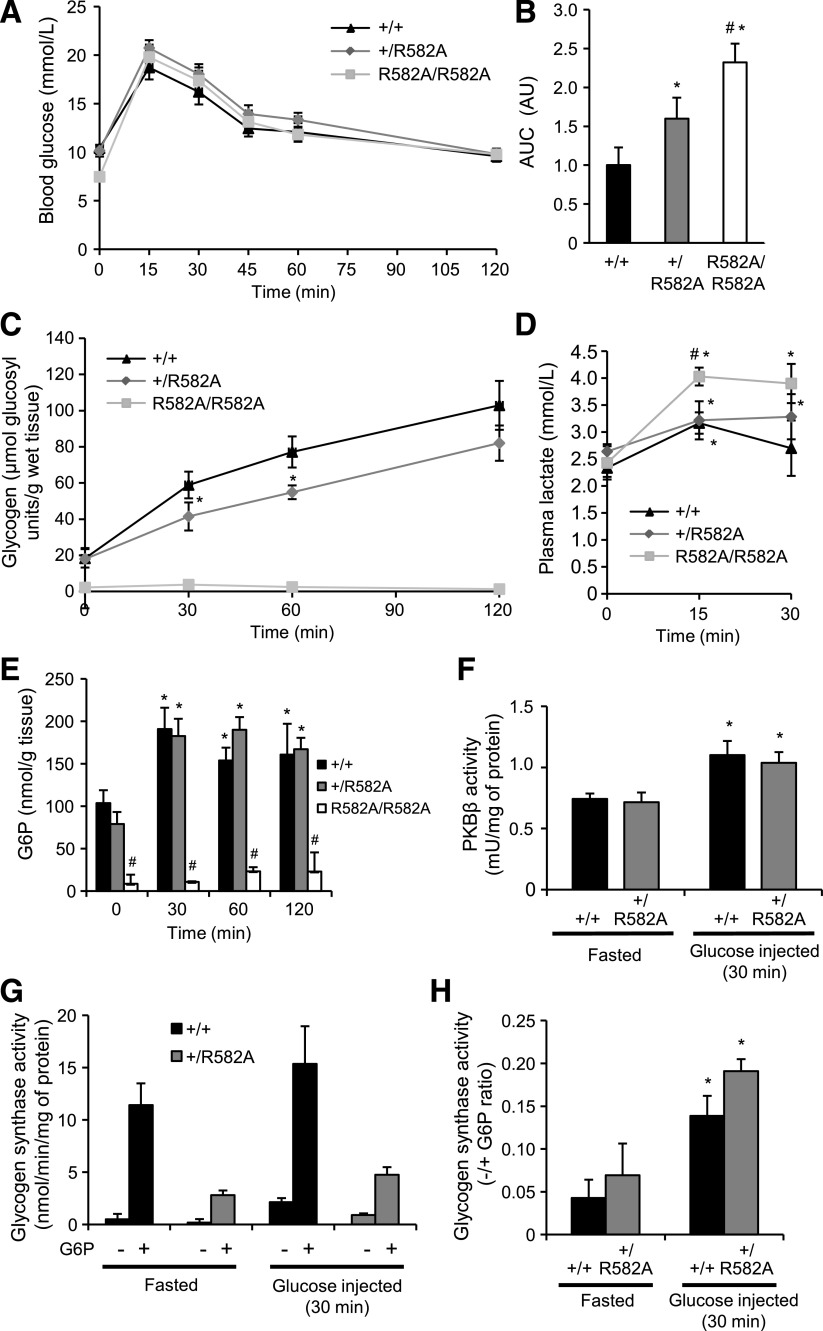
To establish the impact of reduced G6P-dependent activity or deficiency of GYS2 in hepatic glycogen synthesis and glucose handling, we performed a glucose tolerance test and monitored the rate of hepatic glycogen accumulation after glucose injection. Blood glucose and plasma insulin levels were similar in fed or overnight fasted mice among all genotypes (Supplementary Fig. 3). Interestingly, after a short fast (6 h) prior to glucose administration, blood glucose in GYS2R582A/R582A mice was significantly reduced (7.6 mmol/L) compared with GYS2+/+ (10.4 mmol/L) and GYS2+/R582A (10.2 mmol/L) animals (Fig. 5A). Injection of glucose elevated blood glucose to similar absolute levels in all genotypes. However, relative to fasting blood glucose, GYS2R582A/R582A mice displayed a significantly higher fold increase between 15 and 60 min after glucose administration (Fig. 5A). Calculation of area under the curve (AUC) revealed that there was a moderate but significant glucose intolerance observed in GYS2+/R582A and GYS2R582A/R582A animals (Fig. 5B). However, it should be noted that the kinetics of blood glucose profile during GTT are similar among genotypes, and the differences in AUC observed are unlikely to be a consequence of glucose handling; rather, they are likely to be due to differences in basal glucose levels. Nonetheless, for assessment of whether this was associated with impaired hepatic glycogen synthesis, glycogen content was measured at multiple time points over 2 h after glucose injection. Hepatic glycogen was reduced to similar levels after an overnight fast in GYS2+/+ and GYS2+/R582A mice and was essentially absent in GYS2R582A/R582A (Fig. 5C). Postinjection, recovery of liver glycogen was significantly blunted in GYS2+/R582A mice compared with WT, whereas there was no detectable increase in GYS2R582A/R582A animals. Plasma lactate levels were significantly increased in GYS2R582A/R582A animals challenged with glucose (Fig. 5D), most likely due to increased glucose flux to glycolysis. Muscle glycogen levels significantly decreased (∼30%) after an overnight fasting (A.v.W.-M., K.S., unpublished observations), and glucose injection did not cause a significant increase in glycogen content in any of the genotypes up to 2 h postinjection (Supplementary Fig. 6). Hepatic [G6P] was identical in both fasted and glucose challenged GYS2+/+ and GYS2+/R582A mice; however, it was significantly depressed in fasted GYS2R582A/R582A mice and was not changed in response to elevated blood glucose (Fig. 5E). These observed differences were not due to impaired insulin signaling, as PKBβ activity was similarly increased 30 min after glucose challenge in GYS2+/+ and GYS2+/R582A mice (Fig. 5F). Moreover, GYS2 phosphorylation/activity was similar at rest and 30 min post–glucose injection, although G6P-dependent GS activity in GYS2+/R582A mice was significantly lower in both fasted and post–glucose injection states compared with GYS2+/+ mice (Fig. 5G). Collectively, these results demonstrate that impaired hepatic glycogen synthesis in GYS2+/R582A mice is not due to changes in insulin signaling, G6P-independent/phosphorylation-dependent GS activity, or reduced cellular [G6P].
FIG. 5.
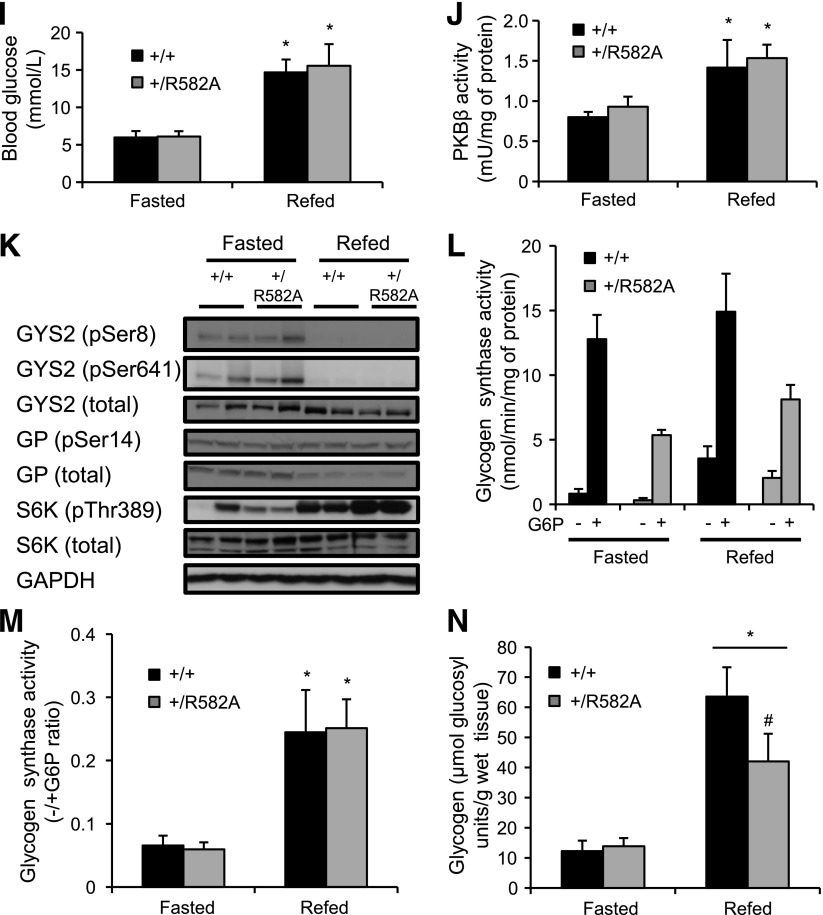
Glycogen accumulation in GYS2+/+, GYS2+/R582A, and GYS2R582A/R582A mice after bolus glucose injection and refeeding. A: Glucose tolerance testing of GYS2+/+, GYS2+/R582A, and GYS2R582A/R582A mice was performed as described in research design and methods (n = 5–7/group). B: AUC for the data in A was calculated using fasting blood glucose levels as baseline. Results are expressed in arbitrary units (AU) and are representative of three independent experiments. *P < 0.05 GYS2+/+ vs. other genotypes; #P < 0.05 GYS2+/R582A vs. GYS2R582A/R582A (n = 5–7/group). C–H: GYS2+/+, GYS2+/R582A, and GYS2R582A/R582A mice were fasted for 16 h, followed by administration of glucose (2 mg/g body wt i.p.). Mice were killed at the indicated time points postinjection and analyzed as follows. C: Liver glycogen levels. *P < 0.05 GYS2+/+ vs. other genotype (n = 3–6/group). D: Plasma lactate levels. *P < 0.05 vs. fasted; #P < 0.05 GYS2+/+ vs. other genotypes (n = 6/group). E: Liver G6P levels. *P < 0.05 vs. fasted; #P < 0.05 GYS2+/+ vs. other genotypes (n = 3–6/group). F: PKBβ was immunoprecipitated from liver lysates and assayed for phosphotransferase activity. *P < 0.05 vs. fasted (n = 6/group). G and H: GS activity was measured in liver lysates ± 10 mmol/L G6P and are presented as total GS activity (G) or the −/+G6P ratio (H). *P < 0.05 vs. fasted (n = 6/group). I–N: GYS2+/R582A and GYS2+/+ mice were fasted overnight followed by 1 h with free access to food (refed) or not (fasted). Mice were killed and analyzed as follows. *P < 0.05 vs. fasted; #P < 0.05 GYS2+/+ vs. other genotypes (n = 5–7/group). I: Blood glucose levels. J: PKBβ kinase activity was measured in liver immunoprecipitates. K: Liver lysates were immunoblotted using the indicated antibodies. Glyceraldehyde-3-phosphate dehydrogenase (GAPDH) was used as a loading control. Results are representative of two independent experiments performed with tissues from four mice. L and M: GS activity was measured in liver lysates ± 10 mmol/L G6P and is presented as total GS activity (L) or as the −/+G6P ratio (M). N: Liver glycogen levels.
To verify the above results in an alternative physiological setting, we measured hepatic glycogen levels in response to refeeding after an overnight fast. Refeeding for 1 h resulted in similar increases in blood glucose levels, hepatic PKBβ activity, and phosphorylation of S6K for GYS2+/R582A and GYS2+/+ (Fig. 5I–K). GYS2 S8 and S641 phosphorylation was robustly reduced in both genotypes, which was associated with an increase in GS activity ratio (Fig. 5K–M). Consistent with the data from the glucose injection experiment (Fig. 5C), hepatic glycogen content in response to refeeding after an overnight fast was significantly lower in GYS2+/R582A compared with GYS2+/+ animals (Fig. 5N).
Normal hepatic glycogen synthesis in heterozygous GYS2+/− knockout mice after glucose administration.
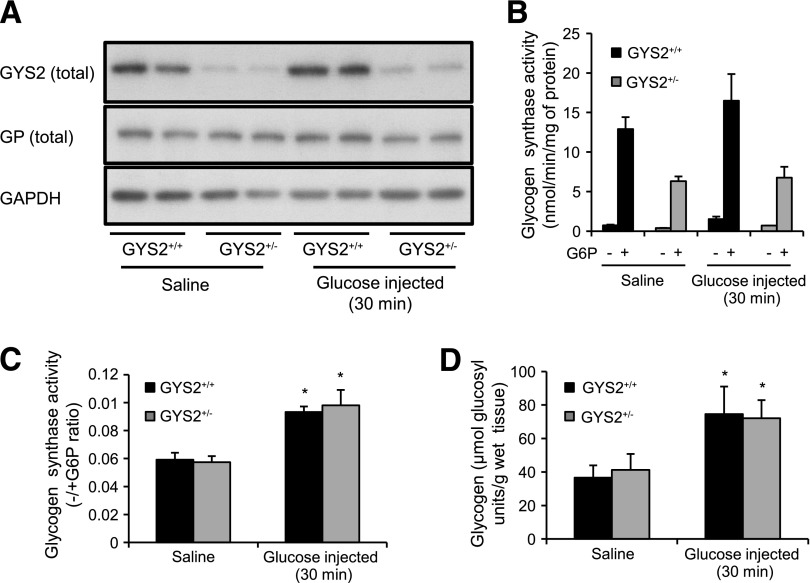
To demonstrate that impaired glycogen resynthesis in fasted GYS2+/R582A mice was due to insensitivity to G6P and not the modest reduction in GYS2 expression (as shown in Fig. 3D and E), we used GYS2+/− knockout mice, which have ∼50% total GYS2 expression/activity (Fig. 6A and B) compared with GYS2+/+. Glucose administration resulted in a similar increase and clearance of blood glucose levels (Supplementary Fig. 8A and B), hepatic PKBβ activity (Supplementary Fig. 8C), and GS activity ratio (Fig. 6C). Liver glycogen levels were indistinguishable between GYS2+/− and control littermate GYS2+/+ animals after an overnight fast and in response to glucose injection (Fig. 6D). These results demonstrate that reducing GYS2 protein expression to as low as 50% is not rate limiting for glycogen synthesis under physiological conditions and therefore support our conclusion that impaired glycogen accumulation in GYS2+/R582A mice is due to reduced G6P-dependent GYS2 activity. However, although the genetic background for both R582A knockin and GYS2+/− mice is the C57BL/6J strain, the results would have been more compelling if these two lines had been crossed and glycogen accumulation was assessed side by side.
FIG. 6.
Glycogen accumulation and GS activity in GYS2+/− mice after bolus glucose injection. A–D: GYS2+/− and GYS2+/+ mice were fasted for 16 h followed by administration of saline or glucose (2 mg/g body wt i.p.). *P < 0.05 GYS2+/+ vs. other genotypes (n = 5–7/group). Mice were killed after 30 min and analyzed as follows. A: Liver lysates were immunoblotted using the indicated antibodies. Glyceraldehyde-3-phosphate dehydrogenase (GAPDH) was used as a loading control. B and C: GS activity was measured in liver lysates ± 10 mmol/L G6P and is presented as total GS activity (B) or as the −/+G6P ratio (C). D: Liver glycogen levels.
Whole-body insulin sensitivity and glucose homeostasis of GYS2 R582A animals.
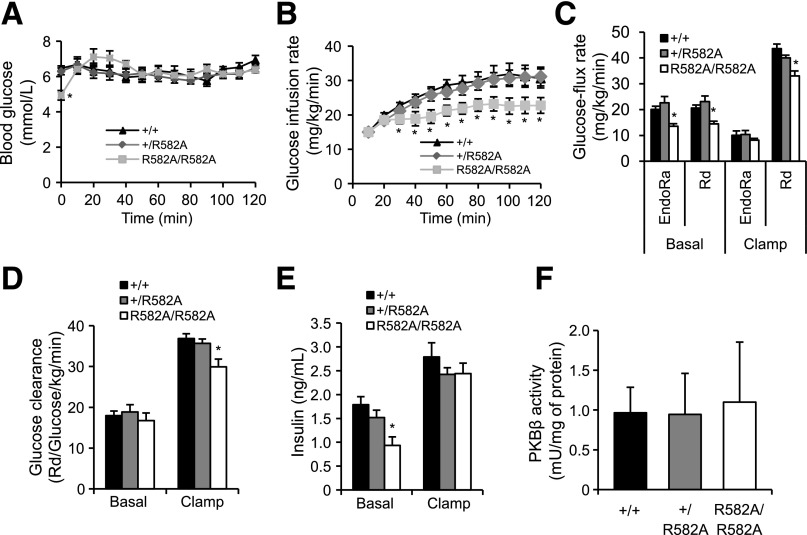
For determination of the impact of impaired hepatic glycogen synthesis and altered glucose flux on whole-body insulin sensitivity, a euglycemic-hyperinsulinemic clamp was performed. Consistent with the data from the glucose tolerance test (Fig. 5A), blood glucose prior to the clamp (6-h fast) was significantly lower in GYS2R582A/R582A mice. Blood glucose levels were clamped at ∼5.5–6.5 mmol/L for all genotypes throughout the clamp period (Fig. 7A). Basal plasma insulin levels were significantly lower in GYS2R582A/R582A compared with GYS2+/+ or GYS2+/R582A mice but normalized during the clamp (Fig. 7E). Notably, glucose infusion rate was robustly reduced in GYS2R582A/R582A mice throughout the clamp period (Fig. 7B), which was associated with a significantly reduced rate of glucose disposal and glucose clearance (Fig. 7C and D). Although endogenous glucose production was reduced in GYS2R582A/R582A mice in the basal state, it was suppressed to a similar extent compared with the other two genotypes during the clamp (Fig. 7C). There was no significant difference in PKBβ activity among genotypes at the cessation of the clamp (Fig. 7F). There were no significant differences in clamp measurements between GYS2+/R582A and GYS2+/+ mice (Fig. 7B–E), which demonstrates that in the euglycemic-hyperinsulinemic condition, GYS2+/R582A mice, which display a partial defect in hepatic glycogen synthesis, have normal whole-body insulin sensitivity. By contrast, insulin sensitivity in GYS2R582A/R582A mice with a complete absence of hepatic glycogen synthesis is impaired, although the impairment is modest, as whole-body Rd was only reduced by ~20% in GYS2R582A/R582A compared with WT mice during the euglycemic-hyperinsulinemic clamp.
FIG. 7.
Euglycemic-hyperinsulinemic clamp in GYS2+/+, GYS2+/R582A, and GYS2R582A/R582A mice. A–F: GYS2+/+, GYS2+/R582A, and GYS2R582A/R582A mice ranging from 14 to 18 weeks old were fasted for 6 h prior to clamp. The clamp was performed by the Vanderbilt Mouse Metabolic Phenotyping Center (Vanderbilt University, Nashville, TN) under conditions described in research design and methods. *P < 0.05 GYS2+/+ vs. other genotypes (n = 7–8/group). A: Blood glucose levels were measured at indicated time points. B: Glucose infusion rates. C: Glucose flux rates as well as glucose clearance (D) were determined using [3-3H]glucose. E: Insulin levels were measured after 6 h of fasting (basal) and during the steady-state period of the clamp. F: Tissue samples were collected after the clamp, and PKBβ kinase activity was measured in immunoprecipitates.
DISCUSSION
In recent years, much of the relevant research has been directed toward elucidating the regulation and role of GSK3 and PP1 in the control of GYS2 and hepatic glycogen synthesis using mouse genetic studies (12–14,16), but the regulation of GYS2 by G6P has not been studied in vivo in a mouse model. GSK3α/βS21A/S21A/S9A/S9A knockin animals display normal glycogen deposition during a euglycemic-hyperinsulinemic clamp and after refeeding (30). Similarly, liver glycogen accumulation in PP1-GLY284F/Y284F mice in response to glucose challenge after overnight fasting is comparable with that in WT animals in vivo (Supplementary Fig. 9). Although the constitutive knockin might have inevitable/secondary adaptive changes that cannot be adequately taken into account, these results raised a possibility of a GSK3- and PP1-GL–independent pathway that might play a role in regulating hepatic glycogen synthesis in response to insulin, feeding, and glucose load.
The importance of G6P flux/cycling in hepatic glycogen synthesis and blood glucose homeostasis is well established, and the immediate response of the liver to insulin or feeding is to redirect G6P derived from gluconeogenesis and blood glucose to glycogen, thus effectively suppressing glucose output (31,32). Consistent with this, several studies have shown that changes in [G6P]i correlate with changes in GYS2 (and also GP) activity and glycogen content in hepatocytes (8,33). However, there is no compelling evidence that G6P has a direct impact on glycogen synthesis through modulating GYS2 activity. To this end, we have used a knockin mouse model (GYS2+/R582A) in which G6P sensitivity has been profoundly impaired (60–70%), while sparing regulation by reversible phosphorylation (Fig. 5H, K, and L), and established that G6P-mediated activation of GYS2 plays a role in hepatic glycogen synthesis in response to feeding or glucose load in vivo (Fig. 5C and N). This was further supported by observations in GYS2-null hepatocytes, where ectopic expression of R582A GYS2 failed to increase glycogen synthesis in the presence of high glucose, which was corrected by PP1-PTG–driven dephosphorylation and activation, albeit to a lesser extent compared with WT (Fig. 2B and C). The exact reason why R582A was not activated (with PTG) to the same level as WT is unclear. Since G6P is thought to regulate the activity of GYS2 not only by allosteric activation of the phosphorylated enzyme but also by making the phosphorylated protein a better substrate for dephosphorylation by PP1 (34), it was speculated that R582A may be less efficiently dephosphorylated by PP1. However, key regulatory phosphorylation sites (S8 and S641) (27) were reduced to the same extent between WT and R582A. Still, S641 phosphorylation was only partially reduced by PTG overexpression, and we cannot eliminate the possibility that total dephosphorylation (Fig. 2C) would render R582A fully active. It is also possible that other uncharacterized posttranslational modifications (e.g., phosphorylation or acetylation [35,36]) had occurred in R582A and affected GYS2 activity in intact hepatocytes. Collectively, it can be concluded that G6P binding to GYS2 has composite effects in controlling glycogen synthesis through allosteric activation and efficient dephosphorylation coupled also with appropriate cellular localization.
The hypomorphic effect in GYS2R582A/R582A mice was unexpected because R582A expressed normally in HEK293 cells and an identical amino acid substitution in muscle GS/GYS1 did not display hypomorphism in GYS1R582A/R582A mice (21). One distinct difference between the two knockin models is the impact on tissue glycogen levels. In GYS2R582A/R582A mice, hepatic glycogen content was reduced >95% in the fed state compared with WT (Fig. 3H), while muscle glycogen in GYS1R582A/R582A mice was only reduced ∼50% compared with WT. Gys2 mRNA expression was normal in GYS2R582A/R582A mice (Fig. 3F), and the large reduction in G6P-saturated GS activity (>60–70%) relative to expression (27%) in GYS2+/R582A mice demonstrates that the mutant allele can be expressed (Fig. 3E and G). The most plausible explanation for the hypomorphism of GYS2R582A/R582A mice is that GYS2 is unstable or suppressed in the near absence of hepatic glycogen in these mice. Indeed, the expression of glycogen-bound proteins examined in GYS2R582A/R582A (e.g., AGL, glycogenin, and GP) (Fig. 3J) and GYS2−/− (Supplementary Fig. 4) mice was robustly reduced, suggesting that glycogen itself may play an important role for their stability.
There is a genetic disorder known as glycogen storage disease 0 (GSD0), caused by loss-of-function mutations in the GYS2 gene, one of few glycogen storage diseases characterized by reduced levels of hepatic glycogen (4). Patients present with postprandial hyperglycemia due to inefficient blood glucose clearance most likely resulting from inability to store glucose as liver glycogen. This results in a shift of glucose-G6P flux into glycolytic and lipogenic pathways leading to hyperlactemia and hyperlipidemia, respectively. GYS2R582A knockin mice recapitulated GSD0 phenotypes at the whole-body level based on observations from glucose tolerance tests (Fig. 5A and B) and hyperinsulinemic-euglycemic clamp (Fig. 7). In addition, at the cellular level, results from [14C]glucose labeling in primary hepatocytes from GYS2+/R582A and GYS2R582A/R582A animals showed a clear shift of glucose-G6P flux toward glycolytic and lipogenic pathways (Fig. 4B–D).
In summary, we have provided genetic evidence that G6P-mediated activation of GYS2 plays some role in controlling glycogen synthesis and glucose-G6P flux control, which affects hepatic glucose, glycogen and lipid metabolism, as well as whole-body glucose homeostasis.
Supplementary Material
ACKNOWLEDGEMNETS
This study was supported by Diabetes UK (to K.S.), British Heart Foundation (to K.S.), and British Medical Research Council (MRC). A.v.W.-M. was supported by an MRC studentship, and K.P. was supported by the Wellcome Trust PhD Programme for Clinicians (093991/Z/10/Z). D.H.W. was supported by National Institutes of Health Grants R37 DK050277 and U24 DK059637. J.J.G. was supported by the Ministry of Science and Innovation, Spain (BFU2011-30554); by the Autonomous Government of Catalonia (2009SGR-1176); by a grant from the Fundación Marcelino Botín; and by CIBERDEM (Instituto de Salud Carlos III).
The authors also thank the pharmaceutical companies supporting the Division of Signal Transduction Therapy (DSTT) Unit (AstraZeneca, Boehringer Ingelheim, GlaxoSmithKline, Merck & Co. Inc., Merck KGaA, and Pfizer) for financial support (to K.S. and P.T.W.C.). No other potential conflicts of interest relevant to this article were reported.
A.v.W.-M. designed the overall experiments, performed the majority of the experiments, analyzed data shown in Figs. 1 and 3–6, and wrote the manuscript. R.W.H. established many of the biochemical/biological assays, performed experiments shown in Supplementary Figs. 4 and 5, helped with data analysis shown in Fig. 3 and Supplementary Fig. 5, and wrote the manuscript. M.G.-R. performed experiments and analyzed data shown in Fig. 2 and contributed to and edited the draft of the manuscript. L.K. performed experiments and analyzed data shown in Fig. 7 and contributed to and edited the draft of the manuscript. I.L.-S. performed experiments and analyzed data shown in Fig. 6 and Supplementary Figs. 4 and 8 and contributed to and edited the draft of the manuscript. L.L. performed experiments and analyzed data shown in Fig. 7 and contributed to and edited the draft of the manuscript. K.P. performed hepatocyte isolation and contributed to and edited the draft of the manuscript. M.W.P. performed molecular cloning used in experiments shown in Fig. 1 and contributed to and edited the draft of the manuscript. C.M.-P. generated recombinant viruses shown in Fig. 2 and contributed to and edited the draft of the manuscript. M.V. contributed to the characterization of the GYS2 knockin animals and contributed to and edited the draft of the manuscript. J.C. coordinated the experiments and contributed to and edited the draft of the manuscript. P.T.W.C. provided PP1-GL knockin mice and contributed to and edited the draft of the manuscript. D.H.W. designed and supervised the experiments and contributed to and edited the draft of the manuscript. J.J.G. supervised the experiments and contributed to and edited the draft of the manuscript. K.S. designed the overall experiments and wrote the manuscript. K.S. is the guarantor of this work and, as such, had full access to all the data in the study and takes responsibility for the integrity of the data and the accuracy of the data analysis.
The authors thank Maaike Oosterveer (University Medical Center Groningen) for useful comments and technical support and Janet Patterson-Kane (University of Glasgow) for histology; David Stapleton (University of Melbourne), Bernard Thorens (University of Lausanne), and Mark Magnuson and Masakazu Shiota (Vanderbilt University) for antibodies; and Gail Fraser, Lucie Delattre, Sitheswaran Nainamalai, and Anna Adrover for technical support. The authors also thank the DNA sequence and antibody purification teams (DSTT, University of Dundee) coordinated by Hilary McLauchlan and James Hastie.
Footnotes
This article contains Supplementary Data online at http://diabetes.diabetesjournals.org/lookup/suppl/doi:10.2337/db13-0880/-/DC1.
K.S. is currently affiliated with Quartier de l'innovation, Campus Ecole Polytechnique Fédérale de Lausanne, Nestlé Institute of Health Sciences SA, Lausanne, Switzerland.
REFERENCES
- 1.Wasserman DH. Four grams of glucose. Am J Physiol Endocrinol Metab 2009;296:E11–E21 [DOI] [PMC free article] [PubMed] [Google Scholar]
- 2.Agius L. Physiological control of liver glycogen metabolism: lessons from novel glycogen phosphorylase inhibitors. Mini Rev Med Chem 2010;10:1175–1187 [DOI] [PubMed] [Google Scholar]
- 3.Shulman GI. Cellular mechanisms of insulin resistance. J Clin Invest 2000;106:171–176 [DOI] [PMC free article] [PubMed] [Google Scholar]
- 4.Weinstein DA, Correia CE, Saunders AC, Wolfsdorf JI. Hepatic glycogen synthase deficiency: an infrequently recognized cause of ketotic hypoglycemia. Mol Genet Metab 2006;87:284–288 [DOI] [PMC free article] [PubMed] [Google Scholar]
- 5.Roach PJ, Depaoli-Roach AA, Hurley TD, Tagliabracci VS. Glycogen and its metabolism: some new developments and old themes. Biochem J 2012;441:763–787 [DOI] [PMC free article] [PubMed] [Google Scholar]
- 6.Ferrer JC, Favre C, Gomis RR, et al. Control of glycogen deposition. FEBS Lett 2003;546:127–132 [DOI] [PubMed] [Google Scholar]
- 7.Irimia JM, Meyer CM, Peper CL, et al. Impaired glucose tolerance and predisposition to the fasted state in liver glycogen synthase knock-out mice. J Biol Chem 2010;285:12851–12861 [DOI] [PMC free article] [PubMed] [Google Scholar]
- 8.Villar-Palasí C, Guinovart JJ. The role of glucose 6-phosphate in the control of glycogen synthase. FASEB J 1997;11:544–558 [PubMed] [Google Scholar]
- 9.Jensen J, Lai YC. Regulation of muscle glycogen synthase phosphorylation and kinetic properties by insulin, exercise, adrenaline and role in insulin resistance. Arch Physiol Biochem 2009;115:13–21 [DOI] [PubMed] [Google Scholar]
- 10.Friedman DL, Larner J. Studies on Udpg-alpha-Glucan transglucosylase. Iii. Interconversion of two forms of muscle Udpg-alpha-Glucan transglucosylase by a phosphorylation-dephosphorylation reaction sequence. Biochemistry 1963;2:669–675 [DOI] [PubMed] [Google Scholar]
- 11.Frame S, Cohen P. GSK3 takes centre stage more than 20 years after its discovery. Biochem J 2001;359:1–16 [DOI] [PMC free article] [PubMed] [Google Scholar]
- 12.McManus EJ, Sakamoto K, Armit LJ, et al. Role that phosphorylation of GSK3 plays in insulin and Wnt signalling defined by knockin analysis. EMBO J 2005;24:1571–1583 [DOI] [PMC free article] [PubMed] [Google Scholar]
- 13.Patel S, Macaulay K, Woodgett JR. Tissue-specific analysis of glycogen synthase kinase-3α (GSK-3α) in glucose metabolism: effect of strain variation. PLoS ONE 2011;6:e15845. [DOI] [PMC free article] [PubMed] [Google Scholar]
- 14.Patel S, Doble BW, MacAulay K, Sinclair EM, Drucker DJ, Woodgett JR. Tissue-specific role of glycogen synthase kinase 3beta in glucose homeostasis and insulin action. Mol Cell Biol 2008;28:6314–6328 [DOI] [PMC free article] [PubMed] [Google Scholar]
- 15.Kelsall IR, Munro S, Hallyburton I, Treadway JL, Cohen PT. The hepatic PP1 glycogen-targeting subunit interaction with phosphorylase a can be blocked by C-terminal tyrosine deletion or an indole drug. FEBS Lett 2007;581:4749–4753 [DOI] [PubMed] [Google Scholar]
- 16.Kelsall IR, Rosenzweig D, Cohen PT. Disruption of the allosteric phosphorylase a regulation of the hepatic glycogen-targeted protein phosphatase 1 improves glucose tolerance in vivo. Cell Signal 2009;21:1123–1134 [DOI] [PubMed] [Google Scholar]
- 17.Ciudad CJ, Carabaza A, Guinovart JJ. Glucose 6-phosphate plays a central role in the activation of glycogen synthase by glucose in hepatocytes. Biochem Biophys Res Commun 1986;141:1195–1200 [DOI] [PubMed] [Google Scholar]
- 18.Thomas JA, Schlender KK, Larner J. A rapid filter paper assay for UDPglucose-glycogen glucosyltransferase, including an improved biosynthesis of UDP-14C-glucose. Anal Biochem 1968;25:486–499 [DOI] [PubMed] [Google Scholar]
- 19.Bligh EG, Dyer WJ. A rapid method of total lipid extraction and purification. Can J Biochem Physiol 1959;37:911–917 [DOI] [PubMed] [Google Scholar]
- 20.Berglund ED, Li CY, Poffenberger G, et al. Glucose metabolism in vivo in four commonly used inbred mouse strains. Diabetes 2008;57:1790–1799 [DOI] [PMC free article] [PubMed] [Google Scholar]
- 21.Bouskila M, Hunter RW, Ibrahim AF, et al. Allosteric regulation of glycogen synthase controls glycogen synthesis in muscle. Cell Metab 2010;12:456–466 [DOI] [PubMed] [Google Scholar]
- 22.Hanashiro I, Roach PJ. Mutations of muscle glycogen synthase that disable activation by glucose 6-phosphate. Arch Biochem Biophys 2002;397:286–292 [DOI] [PubMed] [Google Scholar]
- 23.Skurat AV, Cao Y, Roach PJ. Glucose control of rabbit skeletal muscle glycogenin expressed in COS cells. J Biol Chem 1993;268:14701–14707 [PubMed] [Google Scholar]
- 24.Baskaran S, Roach PJ, DePaoli-Roach AA, Hurley TD. Structural basis for glucose-6-phosphate activation of glycogen synthase. Proc Natl Acad Sci USA 2010;107:17563–17568 [DOI] [PMC free article] [PubMed] [Google Scholar]
- 25.Printen JA, Brady MJ, Saltiel AR. PTG, a protein phosphatase 1-binding protein with a role in glycogen metabolism. Science 1997;275:1475–1478 [DOI] [PubMed] [Google Scholar]
- 26.Berman HK, O’Doherty RM, Anderson P, Newgard CB. Overexpression of protein targeting to glycogen (PTG) in rat hepatocytes causes profound activation of glycogen synthesis independent of normal hormone- and substrate-mediated regulatory mechanisms. J Biol Chem 1998;273:26421–26425 [DOI] [PubMed] [Google Scholar]
- 27.Ros S, García-Rocha M, Domínguez J, Ferrer JC, Guinovart JJ. Control of liver glycogen synthase activity and intracellular distribution by phosphorylation. J Biol Chem 2009;284:6370–6378 [DOI] [PubMed] [Google Scholar]
- 28.García-Rocha M, Roca A, De La Iglesia N, et al. Intracellular distribution of glycogen synthase and glycogen in primary cultured rat hepatocytes. Biochem J 2001;357:17–24 [DOI] [PMC free article] [PubMed] [Google Scholar]
- 29.Stapleton D, Nelson C, Parsawar K, et al. Analysis of hepatic glycogen-associated proteins. Proteomics 2010;10:2320–2329 [DOI] [PMC free article] [PubMed] [Google Scholar]
- 30.Wan M, Leavens KF, Hunter RW, et al. A noncanonical, GSK3-independent pathway controls postprandial hepatic glycogen deposition. Cell Metab 2013;18:99–105 [DOI] [PMC free article] [PubMed] [Google Scholar]
- 31.Shulman GI, Rothman DL, Smith D, et al. Mechanism of liver glycogen repletion in vivo by nuclear magnetic resonance spectroscopy. J Clin Invest 1985;76:1229–1236 [DOI] [PMC free article] [PubMed] [Google Scholar]
- 32.Edgerton DS, Ramnanan CJ, Grueter CA, et al. Effects of insulin on the metabolic control of hepatic gluconeogenesis in vivo. Diabetes 2009;58:2766–2775 [DOI] [PMC free article] [PubMed] [Google Scholar]
- 33.Carabaza A, Ciudad CJ, Baqué S, Guinovart JJ. Glucose has to be phosphorylated to activate glycogen synthase, but not to inactivate glycogen phosphorylase in hepatocytes. FEBS Lett 1992;296:211–214 [DOI] [PubMed] [Google Scholar]
- 34.Gomis RR, Favre C, García-Rocha M, Fernández-Novell JM, Ferrer JC, Guinovart JJ. Glucose 6-phosphate produced by gluconeogenesis and by glucokinase is equally effective in activating hepatic glycogen synthase. J Biol Chem 2003;278:9740–9746 [DOI] [PubMed] [Google Scholar]
- 35.Huttlin EL, Jedrychowski MP, Elias JE, et al. A tissue-specific atlas of mouse protein phosphorylation and expression. Cell 2010;143:1174–1189 [DOI] [PMC free article] [PubMed] [Google Scholar]
- 36.Zhao S, Xu W, Jiang W, et al. Regulation of cellular metabolism by protein lysine acetylation. Science 2010;327:1000–1004 [DOI] [PMC free article] [PubMed] [Google Scholar]
Associated Data
This section collects any data citations, data availability statements, or supplementary materials included in this article.


