

Abstract
Bile acids (BAs) exert pleiotropic metabolic effects, and physicochemical properties of different BAs affect their function. In rodents, insulin regulates BA composition, in part by regulating the BA 12α-hydroxylase CYP8B1. However, it is unclear whether a similar effect occurs in humans. To address this question, we examined the relationship between clamp-measured insulin sensitivity and plasma BA composition in a cohort of 200 healthy subjects and 35 type 2 diabetic (T2D) patients. In healthy subjects, insulin resistance (IR) was associated with increased 12α-hydroxylated BAs (cholic acid, deoxycholic acid, and their conjugated forms). Furthermore, ratios of 12α-hydroxylated/non–12α-hydroxylated BAs were associated with key features of IR, including higher insulin, proinsulin, glucose, glucagon, and triglyceride (TG) levels and lower HDL cholesterol. In T2D patients, BAs were nearly twofold elevated, and more hydrophobic, compared with healthy subjects, although we did not observe disproportionate increases in 12α-hydroxylated BAs. In multivariate analysis of the whole dataset, controlling for sex, age, BMI, and glucose tolerance status, higher 12α-hydroxy/non–12α-hydroxy BA ratios were associated with lower insulin sensitivity and higher plasma TGs. These findings suggest a role for 12α-hydroxylated BAs in metabolic abnormalities in the natural history of T2D and raise the possibility of developing insulin-sensitizing therapeutics based on manipulations of BA composition.
Bile acids (BAs) regulate multiple aspects of metabolism (1). The oldest known roles for BAs are in cholesterol homeostasis: BAs promote absorption of dietary cholesterol, solubilize biliary cholesterol for excretion, and are themselves the major product of liver cholesterol catabolism. More recently, BAs have been recognized as signaling molecules, repressing their own synthesis as well as that of triglyceride (TG) in the liver and promoting incretin secretion in the gut. Many of these actions occur through activation of BA receptors such as the nuclear receptor FXR and the G protein–coupled receptor TGR5 (1). In addition, BAs can act as mediators of the unfolded protein response (2).
Given the variety of metabolic pathways modulated by BAs, pharmacological manipulation of these molecules has become of interest for obesity and diabetes. Pharmacological use of exogenous BAs is limited by their narrow therapeutic window due to the toxicity of selected secondary BAs and the effect of chenodeoxycholic acid (CDCA) to increase LDL cholesterol (LDL-C) (3). Nonetheless, ursodeoxycholic acid (UDCA) has been gainfully used for dissolution of cholesterol gallstones or treatment of primary biliary cirrhosis (4,5). BA sequestrants are effectively used to reduce LDL-C and improve glycemic control in type 2 diabetes (T2D) (6). FXR and TGR5 agonists have also been developed, although their use has been limited by efficacy (for TGR5 agonists) or side effects (increased LDL-C and pruritus, for FXR agonists) (3,7). There has also been a surge of interest in the effects of bariatric surgery on endogenous BAs, and whether BA signaling can account for some of its insulin-sensitizing effects (8,9).
The primary products of the BA synthetic pathway in humans are CDCA and cholic acid (CA). They in turn are modified by gut microbiota to yield lithocholic acid (LCA) and deoxycholic acid (DCA), two secondary BAs, respectively, as well as other secondary and tertiary BAs (Fig. 1). Conversion of CDCA to CA in the liver requires 12α-hydroxylation by the 12α-hydroxylase, encoded by Cyp8b1. Individual BAs differ in their physicochemical properties, such that individual BAs or subsets of BAs can affect downstream metabolic pathways differentially (1,10). For example, whereas CDCA is a potent agonist of FXR, with a Km in the micromolar range, DCA and LCA have been suggested as partial antagonists of FXR (11).
FIG. 1.

Reminder of BA pathway. The enzyme 12α-hydroxylase (CYP8B1) is responsible for the conversion of CDCA into CA. GCA, glycocholic acid; GCDCA, glycochenodeoxycholic acid.
We have recently shown that in rodents, insulin inhibits the production of 12α-hydroxy BAs by suppressing transcription of Cyp8b1 (12). Conversely, the insulin resistance (IR) characteristic of T2D would be expected to increase levels of 12α-hydroxylated BAs, as has indeed been observed in multiple mouse models of diabetes (13–17). However, in determining the consequences of this shift in BA composition in human diabetes, one should be mindful of important differences in BA metabolism between mammalian species. Unlike in humans, in rodents, CDCA can be 6-hydroxylated, leading to the formation of hydrophilic muricholic acids that are unable to promote dietary cholesterol absorption (18) or agonize FXR (19,20). It is therefore unclear how mechanisms of BA action identified in mice would apply to human diabetes and IR.
The goal of this work was to critically test the hypothesis that there exists a correlation between insulin sensitivity and BA 12α-hydroxylation in humans. To this end, we measured 13 BA species in plasma collected after an overnight fast from 200 healthy individuals with normal glucose tolerance and a range of insulin sensitivities, as assessed by hyperinsulinemic-euglycemic clamps, and from 35 patients with T2D. Secondly, we sought to characterize the relationship between BA subtypes, BA levels, and metabolic parameters.
RESEARCH DESIGN AND METHODS
Study population.
The study population included 200 nondiabetic subjects (103 women and 97 men) and 35 patients with T2D (18 women and 17 men). The nondiabetic subjects were part of the Relationship between Insulin Sensitivity and Cardiovascular Risk (RISC) study (www.egir.org), which recruited apparently healthy Caucasians in 19 centers in 14 European countries between June 2002 and July 2004 (21). Study participants were between 30 and 60 years of age, and blood pressure (<140/<90 mmHg), plasma cholesterol (<7.8 mmol/L), TGs (<4.6 mmol/L), and fasting and 2-h plasma glucose (<7.0 and 11.1 mmol/L) were within established limits. Exclusion criteria were the presence of overt cardiovascular disease, chronic systemic diseases (hypertension, diabetes, dyslipidemia, inflammatory, and neoplastic diseases), class III obesity, and carotid stenosis >40% or calcified carotid plaques and drug treatment for hypertension, diabetes, dyslipidemia, or obesity or steroid use. The 200 individuals in the current study were selected to cover the entire 8–10-fold range of insulin sensitivity of the original cohort (21). The T2D group was recruited at our Clinical Research Center; their mean diabetes duration was 9 years, their mean HbA1c was 7.9 ± 1.6%, and they were on stable treatment with metformin ± sulfonylureas (nine patients were also receiving insulin). The protocol was approved by the institutional ethics committee of the University of Pisa.
Study procedures.
All study subjects received a euglycemic insulin clamp (using an insulin infusion rate of 240 pmol ⋅ min−1 per m2 of body surface area), performed as previously described (22). Insulin sensitivity was calculated as the insulin-mediated whole-body glucose disposal during the final 40 min of the 2-h clamp normalized to the fat-free mass (M) divided by the steady-state plasma insulin concentration during the same time interval (M/I, in units of µmol ⋅ min−1 ⋅ kgffm−1 ⋅ nM−1) (23). In the RISC subjects, insulin secretion was derived from mathematical modeling of the plasma glucose and C-peptide response to an oral glucose tolerance test with the use of C-peptide deconvolution (24). A fatty liver index (FLI) was calculated as previously described (25). Plasma lipid profile was determined by standard methods, plasma hormone concentrations (insulin, proinsulin, glucagon, and adiponectin) were measured by radioimmunoassay, and circulating metabolites were determined by a metabolomics platform (26).
BA measurements.
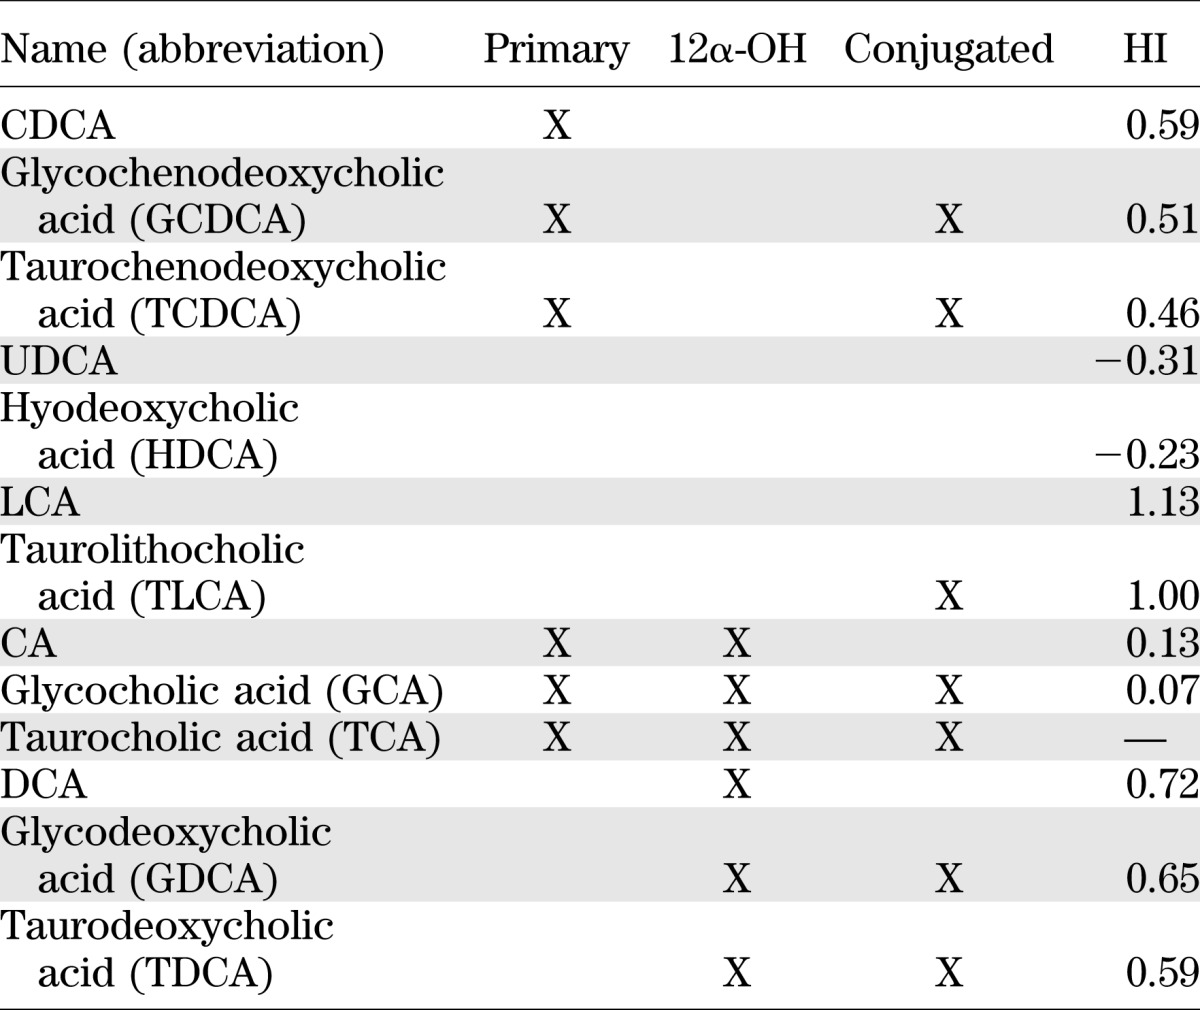
Aliquots (0.1 mL) of plasma collected after an overnight fast were spiked with internal standard (10 μL cholate-d4, 25 μmol/L), mixed with 1 mL ice-cold acetonitrile, vortexed, and centrifuged for 10 min at 11,000g. Supernatant was dried under nitrogen at 45°C and resuspended in 100 μL 55/45 (volume for volume) MeOH/H2O, containing 5 mmol/L ammonium formate. Ten microliters was injected into LC/MS (Waters Quattro Micro with Waters 2795 Alliance HPLC). Quantitative standard curves were used, and deuterated internal standards were used to measure recovery. Subgrouping and hydrophobicity of the measured BAs are listed in Table 1. Hydrophobicity index (HI) was calculated using the published method (27).
TABLE 1.
Subgrouping and HI of the measured BAs
Statistical analysis.
Data are given as mean ± SD or median and (interquartile range) for normally or nonnormally distributed variables, respectively. Group differences were analyzed by Kruskal-Wallis or Mann-Whitney test, as appropriate. Principal component analysis was carried out on correlations using a Varimax method for orthogonal factor rotation. Multivariate and partial regression analyses were performed by standard methods. A P value ≤0.05 was considered statistically significant. All statistical analyses were performed using JMP7.0.
RESULTS
Healthy subjects.
The anthropometric and metabolic characteristics of our cohort of nondiabetic subjects are summarized in Table 2. Upon subdividing the group into quartiles of clamp-derived insulin sensitivity (M/I), insulin-resistant subjects had a similar age as insulin-sensitive individuals but were heavier and more hyperinsulinemic. Among BAs, CDCA and its conjugated forms were the most abundant species, accounting for 43 ± 15% of the total BA pool, followed by DCA and its conjugates (29 ± 11% of the pool). Circulating BAs comprised roughly equal parts of primary versus secondary, conjugated versus unconjugated, and 12α-hydroxylated versus non–12α-hydroxylated BAs. The HI averaged 0.47. Across quartiles of M/I, more insulin-resistant individuals tended to have slightly higher total plasma BAs (Table 2).
TABLE 2.
Serum BA concentrations in healthy subjects (all, n = 200, and by quartile of insulin sensitivity, Q1–Q4) and in patients with T2D (n = 35)
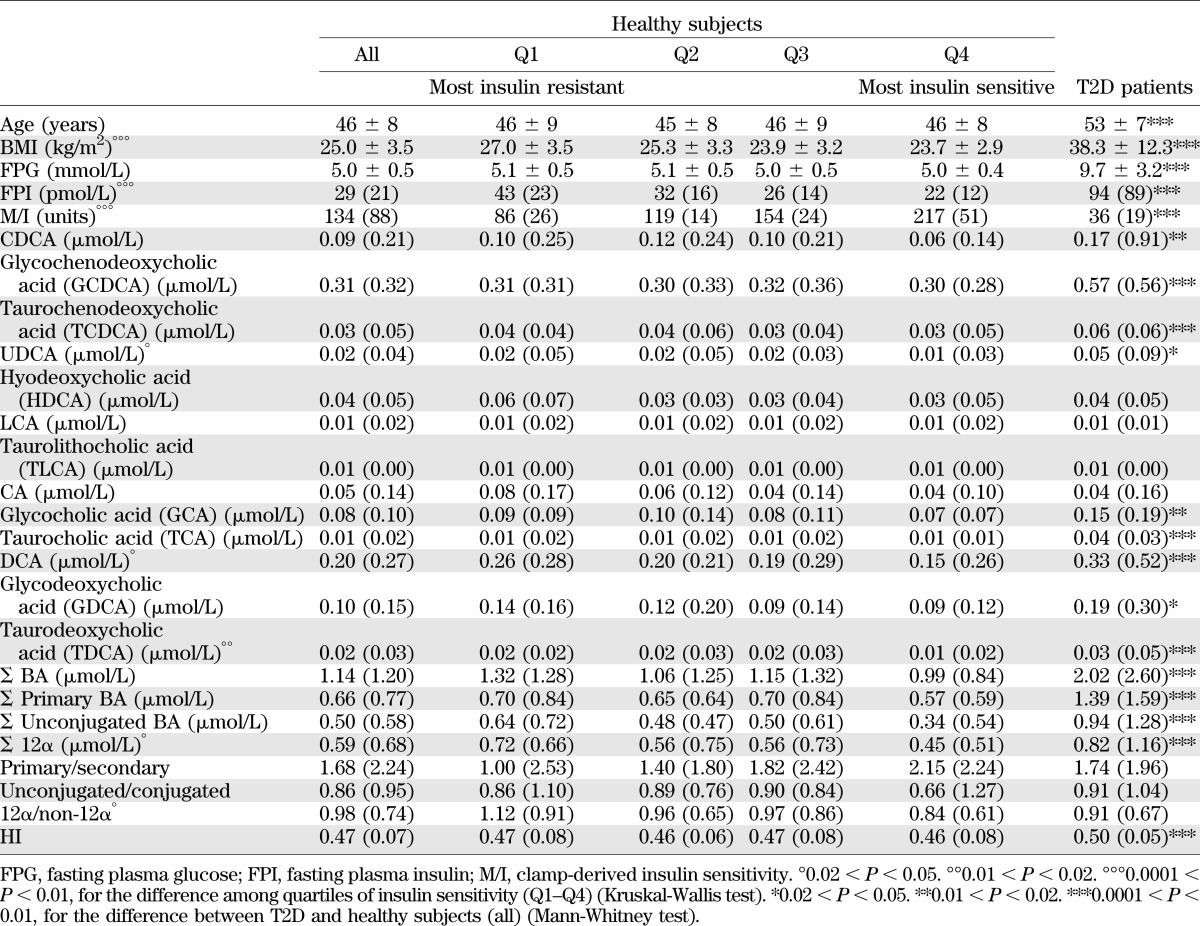
Based on our findings in experimental animals, we predicted that IR would increase the ratio of 12α-hydroxylated to non–12α-hydroxylated BAs; we therefore analyzed these subcategories. We found that the sum of 12α-hydroxylated species (CA, DCA, and their conjugates) increased significantly with IR, whereas non–12α-hydroxylated species, as a category, were unaltered. The increase of 12α-hydroxylated BAs was not accounted for by any individual species, as five out of six 12α-hydroxylated species showed the same upward trend. Conversely, there were no significant associations of insulin sensitivity with the balance of unconjugated versus conjugated BAs or of secondary versus primary BAs, although the increase of DCA caused trends in these two categories (Table 2). An important factor in determining BA bioactivity is their relative hydrophobicity, which predicts their ability to traverse membranes, bind FXR, and promote lipid and cholesterol absorption in the intestine. Thus, we also examined the hydrophobicity of the BA pool by calculating the estimated HI of the BA pool of each subject (27). We found no significant alteration in hydrophobicity across quartiles of insulin sensitivity (Table 2).
If variations of BA pool composition were a component of the IR syndrome, one would expect to see associations with other metabolic parameters linked to this condition. We used principal components analysis to dissect out relationships between BAs and other metabolic parameters in healthy subjects (Supplementary Table 1). The ratio of 12α-hydroxy/non–12α-hydroxy BAs had its highest loading on a factor characterized, in addition to a lower M/I, by higher BMI, waist-to-hip ratio, and mean blood pressure; increased fasting and postglucose insulin secretion; increased lipolysis; higher glucose, glucagon, and proinsulin; higher TGs; lower HDL cholesterol (HDL-C); and higher γGT, ALAT, and FLI (Fig. 2). Thus, an increase in this ratio was associated with canonical features of IR. In addition, a higher ratio was also associated with changes in blood amino acids (raised glutamate and reduced glycine) and with increased circulating levels of α-hydroxybutyrate, a recently identified amino acid metabolite and marker of metabolic overload and incident diabetes (26).
FIG. 2.

Identification of three factors underlying the correlation pattern of the entire dataset of 200 nondiabetic subjects. The size of the bars (x-axis) is the loading of each individual trait on each of three BA-related characteristics. The 12α-hydroxy/non–12α-hydroxy ratio has the highest positive loading score on the first factor (red); total BA concentration has the lowest score on the second axis (green); and the HI has the highest loading on the third factor (yellow). Results are from a principal component analysis with varimax rotation. ISR, insulin secretion rate; MBP, mean blood pressure; mean I, mean insulin; WHR, waist-to-hip ratio. Fatty liver index is the surrogate index of hepatic steatosis based on an algorithm using BMI, waist circumference, TGs, and γGT validated against liver ultrasound (25).
Total plasma BA levels had their highest (negative) loading on the second independent factor characterized by increased levels of the major fatty acids (oleate, palmitate, and stearate), acylcarnitines, β-hydroxybutyrate, and α-hydroxybutyrate (Fig. 2). Thus, low total BA levels are associated with changes in amino acid and fatty acid utilization and ketogenesis but not closely with parameters of glucose metabolism or insulin sensitivity. The third factor in this analysis, characterized by high levels of acyl-glycerophosphocholines and transaminases, was associated with a high loading of the HI.
Finally, in order to get a quantitative estimate of the impact of a high 12α-hydroxy/non–12α-hydroxy ratio, we compared the upper and lower quartiles of the ratio. Individuals in the upper quartile (a fourfold increased ratio, associated with significant increments in total BA levels and in the ratio of unconjugated/conjugated and secondary/primary species) (Fig. 3) showed no difference in BMI compared with the lowest quartile, but had higher insulin, free fatty acids, TGs, and FLI and lower M value, HDL-C, and adiponectin (Fig. 4). Overall, these data show that increased BA 12α-hydroxylation is associated with the full complement of metabolic features of IR, independently of BMI.
FIG. 3.

Comparison of BA characteristics between subjects in the top (red bars) and bottom quartile (blue bars) of the distribution of the 12α-hydroxy/non–12α-hydroxy ratio in 200 nondiabetic subjects. Bar plots are median and interquartile range for the variables listed on the left-hand side. ***0.01 ≥ P ≥ 0.001, by Kruskal-Wallis test. GCDCA, glycochenodeoxycholic acid; GDCA, glycodeoxycholic acid.
FIG. 4.

Comparison of metabolic variables between subjects in the top (red bars) and bottom quartile (blue bars) of the distribution of the 12α-hydroxy/non–12α-hydroxy ratio in 200 nondiabetic subjects. Bar plots are median and interquartile range for the variables listed on the left-hand side. *0.05 ≥ P > 0.02; **0.02 ≥ P > 0.01, by Kruskal-Wallis test. FFA, free fatty acid; M/I, clamp-derived insulin sensitivity (in units of µmol ⋅ min−1 ⋅ kgffm−1 ⋅ nM−1).
Diabetic patients.
T2D patients in our cohort were older and heavier than healthy controls and showed fasting hyperglycemia and hyperinsulinemia, and severe insulin resistance. These patients were on treatment with antidiabetic medications, a potential confounding factor. In this group, there was a twofold increase in total plasma BAs (Table 2 and Fig. 5), as well as increases of 9 out of the 13 individual BAs measured. However, we found no disproportionate alterations in BA subtypes, such as 12α-hydroxylated versus non–12α-hydroxylated, unconjugated versus conjugated, or secondary versus primary BAs. To correct for potential confounders introduced by differences in BMI, we reanalyzed the data by comparing T2D patients to a subgroup of BMI-matched healthy subjects. However, we still found no disproportionate increase in 12α-hydroxylated BAs (data not shown). In contrast, the HI was significantly higher in the T2D groups than in the healthy control subjects regardless of covariate adjustment (Table 2).
FIG. 5.

Stacked bar plot of plasma levels of the major BAs in 200 nondiabetic subjects (by quartile of insulin sensitivity [Q1–Q4]) and in 35 patients with T2D. 12α-Hydroxylated species are colored in shades of teal; non–12α-hydroxylated species are colored in shades of purple. GCA, glycocholic acid; GCDCA, glycochenodeoxycholic acid; GDCA, glycodeoxycholic acid; HDCA, hyodeoxycholic acid; TCA, taurocholic acid; TCDCA, taurochenodeoxycholic acid; TDCA, taurodeoxycholic acid.
Finally, we examined the relationship between insulin sensitivity and BA 12α-hydroxylation in the whole dataset, including healthy subjects and T2D patients. In multivariate analysis controlling for sex, age, BMI, and glucose tolerance status, we found that higher ratios of 12α-hydroxy/non–12α-hydroxy BAs, but not total BAs, primary versus secondary, or conjugated versus unconjugated BAs, were associated with lower insulin sensitivity (Fig. 6A) and higher plasma TG levels (Fig. 6B). As plasma TGs were twice as high in T2D patients as in controls (1.59 [0.81] vs. 0.85 [0.56] mmol/L, P < 0.0001), we tested whether the HI might be related to the hypertriglyceridemia. In a multivariate regression model adjusting for sex, age, and BMI but also for fasting plasma glucose concentrations and the 12α-hydroxyl/non–12α-hydroxyl BA, a higher HI was positively related to higher plasma TG levels (Fig. 6C).
FIG. 6.

Relationship between the 12α-hydroxy/non–12α-hydroxy ratio and insulin sensitivity (A) and plasma TGs (B), and between the HI and plasma TGs (C). All three graphs plot the residuals after adjustment for sex, age, BMI, and glucose tolerance status (diabetic vs. nondiabetic).
DISCUSSION
In this work, we show that in nondiabetic subjects, plasma 12α-hydroxylated BAs are disproportionately increased in association with IR. This finding provides evidence that BA composition is altered within the normal range of insulin sensitivity, and is consistent with insulin-dependent regulation of the 12α-hydroxylase CYP8B1. Our prior work has shown that Cyp8b1 is a target gene of transcription factor FoxO1, whose ability to promote Cyp8b1 transcription is inhibited by insulin via Akt-dependent phosphorylation and nuclear exclusion of FoxO1 (12). These findings dovetail with earlier studies of BA composition, as increased 12α-hydroxylated BAs have been observed in mice lacking hepatic insulin receptors and rodent models of diabetes (13–17). Because FoxO is expected to be more active in IR, owing to decreased Akt-mediated nuclear exclusion, the finding that FoxO1 activates Cyp8b1 reveals a plausible mechanism for upregulation of 12α-hydroxylated BA synthesis in these models.
Surprisingly, a preferential increase in 12α-hydroxylated BAs did not emerge from sampling T2D patients, as we did not find disproportionate increases in these molecules relative to non–12α-hydroxylated BAs despite the marked IR (Table 2). These findings suggest that plasma BA levels and composition are affected by other aspects of T2D in addition to IR. We also note limitations of our study that may confound these results. First, the 35 diabetic patients in our study were taking antidiabetic medications, which may affect BA synthesis and turnover through liver insulin sensitization or other indirect effects. Second, our measurements used fasting rather than postprandial plasma, which may mask some of the differences. A previous study of 16 T2D patients showed increased synthesis of CA and input rate of DCA as compared with BMI-matched controls, causing an increase in postprandial plasma DCA levels and an apparent increase in the 12α-hydroxy/non–12α-hydroxy ratio, but no difference in total plasma BAs (28). In a recent metabolomics screen of 40 subjects with self-reported diabetes (29), DCA, but not CA, was detectable in a higher number of diabetic subjects as compared with a group of 60 control nondiabetic subjects (consistent with the higher levels we observed) (Table 2), but total BAs were not measured; thus a relative preponderance of 12α-hydroxylated species was not reported (29). In addition to medications and postprandial versus fasting plasma, other differences in our study population may account for differences in our findings, such as time since diabetes diagnosis, metabolic control, recruiting period, and geographic location. Moreover, an increased synthesis of 12α-hydroxylated BAs may not be reflected in steady-state plasma levels, because plasma levels are determined by multiple factors, including rate of reabsorption in the small intestine and rate of reuptake in the liver sinusoids. Tracer studies will be required to address these possibilities. On the other hand, evidence from genetically obese T2D ob/ob mice is consistent with the increase in total plasma BAs that we observed; in these mice, the hyperglycemia epigenetically augments expression of Cyp7a1, the rate-limiting enzyme of BA synthesis, whereby BA synthesis and serum BA concentrations are increased (17). FoxO1 has also been implicated in promoting expression of Cyp7a1, although the direction of this effect is debated and may be different between mice and humans (30,31).
Mechanistically, it bears emphasizing that FoxO1 is regulated by both insulin and glucose, and that the lack of a preferential increase in 12α-hydroxylated BAs seen in our study could be explained by hyperglycemia-induced FoxO degradation, and thus inability to fully activate CYP8B1 (32,33).
Of interest is the finding that the HI was significantly higher in T2D patients as compared with nondiabetic subjects, due to the higher circulating levels of DCA and its conjugated forms, relative to CA, CDCA, and their conjugates (Table 2). More hydrophobic BA species are more toxic, especially to the liver (34,35). Hydrophobic BAs are also better able to cross, and are more disruptive to, cell membranes (35,36); are more likely to activate additional BA-sensitive signaling pathways such as protein kinase C, extracellular signal–related kinase 1/2, PXR, and VDR (7,34,37); and are more efficient in absorption of dietary lipids (18). The observed association of the HI with raised transaminases and circulating phospholipid concentrations (Fig. 2) plausibly tracks with this notion. The independent relationship of the HI to TGs is also of interest, although we are unaware of mechanistic data linking BA hydrophobicity to fasting TG levels.
In healthy subjects, we show that an increased ratio of 12α-hydroxy/non–12α-hydroxy BAs is associated with classic features of IR. These include metabolic functions known to be influenced by BAs, including insulin secretion, TG levels, and HDL-C turnover (1,38,39). In comparison, changes in total BA levels were more closely related to changes in fatty acid utilization and ketogenesis. The implications of these findings are that changes in BA types may be an important feature in the pathophysiology of IR, and that the effects of these changes may be dissociable from the effects of altering total BA levels. In addition, the identification of altered 12α-hydroxy BA levels in euglycemic/insulin-resistant individuals may be exploited as a biomarker of hepatic insulin sensitivity and CVD risk.
Mechanistic studies will be required to identify whether and how BA composition affects metabolic abnormalities that arise in IR. However, we speculate that changes in endogenous ligands for BA receptors affect a wide range of BA-regulated pathways. It has been shown that in HepG2 cells, a variety of different BA species can effectively repress Cyp7a1, the rate-limiting step of BA synthesis (40); thus, this pathway is likely to be sensitive to total BA levels. On the other hand, BA species differ considerably in their ability to activate transcription of Bsep, the bile salt export pump, and CDCA is the best activator, through its potent activation of FXR (40). Interestingly, DCA, the most abundant plasma 12α-hydroxylated BA, which we found to be increased in IR, has been shown to interfere with the ability of CDCA to cause recruitment of coactivator SRC-1 to FXR (20). Is it possible that the increases in DCA during IR cause a decline in activation of some FXR pathways? Interventional studies will be required to address this important question.
In addition to alterations in FXR ligands during IR, there may be effects directly on FXR mRNA (Nr1h4), which has been shown to be regulated by glucose and insulin. In three rodent models of hyperglycemia, streptozotocin-induced diabetic rats, diabetic Zucker rats, and liver insulin receptor knockout mice, liver FXR expression is reduced (14,41). Insulin treatment normalizes this defect in streptozotocin-treated rats (41). It is possible that a hyperglycemia-induced reduction in liver FXR mRNA may contribute to metabolic outcomes during diabetes, such as a release of FXR-mediated repression of Cyp7a1 and subsequent increase in BA synthesis (41). Finally, evidence now suggests a role for β-cell FXR in insulin secretion; perhaps changes in FXR ligands or mRNA expression during IR impair glucose-stimulated insulin secretion (38,39,42).
Overall, these findings support a model whereby insulin regulates the production of endogenous 12α-hydroxy BAs that subsequently affect metabolism in multiple ways. The relationship between these metabolites and other phenotypes of IR warrants further investigation. It is conceivable that BA composition could be a target for new therapeutics in IR.
Supplementary Material
ACKNOWLEDGMENTS
This work was supported in part by Columbia Clinical and Translational Science Award Grant UL1-TR-000040 (National Center for Advancing Translational Sciences/National Institutes of Health [NIH]), DK-63608 (NIH), the Schaefer Scholar Award, a Core Usage Funding Award from Columbia University College of Physicians and Surgeons, and K99-HL-111206 (NIH).
E.F. has served as a speaker and consultant for Boehringer Ingelheim, Merck, Sanofi, Eli Lilly and Company, Johnson & Johnson, Astellas, Daiichi Sankyo, Bristol-Myers-Squibb/AstraZeneca, and Novartis. No other potential conflicts of interest relevant to this article were reported.
R.A.H. conceived of this study, designed and implemented experiments, analyzed data, and wrote the manuscript. B.A. and S.C. performed the in vivo studies, contributed to discussions, and edited the manuscript. D.A. contributed to discussions and edited the manuscript. E.F. is the principal investigator of the RISC study, designed experiments, analyzed data, and wrote the manuscript. R.A.H. and E.F. are the guarantors of this work and, as such, had full access to all the data in the study and take responsibility for the integrity of the data and the accuracy of the data analysis.
This work was presented at the 73rd Scientific Sessions of the American Diabetes Association, Chicago, Illinois, 21–25 June 2013.
The authors wish to express their gratitude to the investigators of the RISC study, who originally carried out the phenotyping of the nondiabetic subjects.
Footnotes
This article contains Supplementary Data online at http://diabetes.diabetesjournals.org/lookup/suppl/doi:10.2337/db13-0639/-/DC1.
See accompanying commentary, p. 3987.
REFERENCES
- 1.Lefebvre P, Cariou B, Lien F, Kuipers F, Staels B. Role of bile acids and bile acid receptors in metabolic regulation. Physiol Rev 2009;89:147–191 [DOI] [PubMed] [Google Scholar]
- 2.Gregor MF, Hotamisligil GS. Thematic review series: adipocyte biology. Adipocyte stress: the endoplasmic reticulum and metabolic disease. J Lipid Res 2007;48:1905–1914 [DOI] [PubMed] [Google Scholar]
- 3.Porez G, Prawitt J, Gross B, Staels B. Bile acid receptors as targets for the treatment of dyslipidemia and cardiovascular disease. J Lipid Res 2012;53:1723–1737 [DOI] [PMC free article] [PubMed] [Google Scholar]
- 4.Paumgartner G, Beuers U. Ursodeoxycholic acid in cholestatic liver disease: mechanisms of action and therapeutic use revisited. Hepatology 2002;36:525–531 [DOI] [PubMed] [Google Scholar]
- 5.Hofmann AF. The continuing importance of bile acids in liver and intestinal disease. Arch Intern Med 1999;159:2647–2658 [DOI] [PubMed] [Google Scholar]
- 6.Out C, Groen AK, Brufau G. Bile acid sequestrants: more than simple resins. Curr Opin Lipidol 2012;23:43–55 [DOI] [PubMed] [Google Scholar]
- 7.Thomas C, Pellicciari R, Pruzanski M, Auwerx J, Schoonjans K. Targeting bile-acid signalling for metabolic diseases. Nat Rev Drug Discov 2008;7:678–693 [DOI] [PubMed] [Google Scholar]
- 8.Patti ME, Houten SM, Bianco AC, et al. Serum bile acids are higher in humans with prior gastric bypass: potential contribution to improved glucose and lipid metabolism. Obesity (Silver Spring) 2009;17:1671–1677 [DOI] [PMC free article] [PubMed] [Google Scholar]
- 9.Kohli R, Kirby M, Setchell KD, et al. Intestinal adaptation after ileal interposition surgery increases bile acid recycling and protects against obesity-related comorbidities. Am J Physiol Gastrointest Liver Physiol 2010;299:G652–G660 [DOI] [PMC free article] [PubMed] [Google Scholar]
- 10.Hofmann AF, Roda A. Physicochemical properties of bile acids and their relationship to biological properties: an overview of the problem. J Lipid Res 1984;25:1477–1489 [PubMed] [Google Scholar]
- 11.Modica S, Gadaleta RM, Moschetta A. Deciphering the nuclear bile acid receptor FXR paradigm. Nucl Recept Signal 2010;8:e005. [DOI] [PMC free article] [PubMed] [Google Scholar]
- 12.Haeusler RA, Pratt-Hyatt M, Welch CL, Klaassen CD, Accili D. Impaired generation of 12-hydroxylated bile acids links hepatic insulin signaling with dyslipidemia. Cell Metab 2012;15:65–74 [DOI] [PMC free article] [PubMed] [Google Scholar]
- 13.Akiyoshi T, Uchida K, Takase H, Nomura Y, Takeuchi N. Cholesterol gallstones in alloxan-diabetic mice. J Lipid Res 1986;27:915–924 [PubMed] [Google Scholar]
- 14.Biddinger SB, Haas JT, Yu BB, et al. Hepatic insulin resistance directly promotes formation of cholesterol gallstones. Nat Med 2008;14:778–782 [DOI] [PMC free article] [PubMed] [Google Scholar]
- 15.Uchida K, Makino S, Akiyoshi T. Altered bile acid metabolism in nonobese, spontaneously diabetic (NOD) mice. Diabetes 1985;34:79–83 [DOI] [PubMed] [Google Scholar]
- 16.Uchida K, Satoh T, Takase H, et al. Altered bile acid metabolism related to atherosclerosis in alloxan diabetic rats. J Atheroscler Thromb 1996;3:52–58 [DOI] [PubMed] [Google Scholar]
- 17.Li T, Francl JM, Boehme S, et al. Glucose and insulin induction of bile acid synthesis: mechanisms and implication in diabetes and obesity. J Biol Chem 2012;287:1861–1873 [DOI] [PMC free article] [PubMed] [Google Scholar]
- 18.Wang DQ, Tazuma S, Cohen DE, Carey MC. Feeding natural hydrophilic bile acids inhibits intestinal cholesterol absorption: studies in the gallstone-susceptible mouse. Am J Physiol Gastrointest Liver Physiol 2003;285:G494–G502 [DOI] [PubMed] [Google Scholar]
- 19.Makishima M, Okamoto AY, Repa JJ, et al. Identification of a nuclear receptor for bile acids. Science 1999;284:1362–1365 [DOI] [PubMed] [Google Scholar]
- 20.Parks DJ, Blanchard SG, Bledsoe RK, et al. Bile acids: natural ligands for an orphan nuclear receptor. Science 1999;284:1365–1368 [DOI] [PubMed] [Google Scholar]
- 21.Hills SA, Balkau B, Coppack SW, et al. EGIR-RISC Study Group The EGIR-RISC Study (the European Group for the Study of Insulin Resistance: Relationship between Insulin Sensitivity and Cardiovascular disease risk): I. Methodology and objectives. Diabetologia 2004;47:566–570 [DOI] [PubMed] [Google Scholar]
- 22.Rebelos E, Muscelli E, Natali A, et al. RISC Study Investigators Body weight, not insulin sensitivity or secretion, may predict spontaneous weight changes in nondiabetic and prediabetic subjects: the RISC study. Diabetes 2011;60:1938–1945 [DOI] [PMC free article] [PubMed] [Google Scholar]
- 23.Ferrannini E, Mari A. How to measure insulin sensitivity. J Hypertens 1998;16:895–906 [DOI] [PubMed] [Google Scholar]
- 24.Mari A, Tura A, Natali A, et al. RISC Investigators Influence of hyperinsulinemia and insulin resistance on in vivo β-cell function: their role in human β-cell dysfunction. Diabetes 2011;60:3141–3147 [DOI] [PMC free article] [PubMed] [Google Scholar]
- 25.Gastaldelli A, Kozakova M, Højlund K, et al. RISC Investigators Fatty liver is associated with insulin resistance, risk of coronary heart disease, and early atherosclerosis in a large European population. Hepatology 2009;49:1537–1544 [DOI] [PubMed] [Google Scholar]
- 26.Ferrannini E, Natali A, Camastra S, et al. Early metabolic markers of the development of dysglycemia and type 2 diabetes and their physiological significance. Diabetes 2013;62:1730–1737 [DOI] [PMC free article] [PubMed] [Google Scholar]
- 27.Heuman DM. Quantitative estimation of the hydrophilic-hydrophobic balance of mixed bile salt solutions. J Lipid Res 1989;30:719–730 [PubMed] [Google Scholar]
- 28.Brufau G, Stellaard F, Prado K, et al. Improved glycemic control with colesevelam treatment in patients with type 2 diabetes is not directly associated with changes in bile acid metabolism. Hepatology 2010;52:1455–1464 [DOI] [PubMed] [Google Scholar]
- 29.Suhre K, Meisinger C, Döring A, et al. Metabolic footprint of diabetes: a multiplatform metabolomics study in an epidemiological setting. PLoS ONE 2010;5:e13953. [DOI] [PMC free article] [PubMed] [Google Scholar]
- 30.Chiang JY. Bile acids: regulation of synthesis. J Lipid Res 2009;50:1955–1966 [DOI] [PMC free article] [PubMed] [Google Scholar]
- 31.Shin DJ, Osborne TF. FGF15/FGFR4 integrates growth factor signaling with hepatic bile acid metabolism and insulin action. J Biol Chem 2009;284:11110–11120 [DOI] [PMC free article] [PubMed] [Google Scholar]
- 32.Haeusler RA, Han S, Accili D. Hepatic FoxO1 ablation exacerbates lipid abnormalities during hyperglycemia. J Biol Chem 2010;285:26861–26868 [DOI] [PMC free article] [PubMed] [Google Scholar]
- 33.Kitamura YI, Kitamura T, Kruse JP, et al. FoxO1 protects against pancreatic beta cell failure through NeuroD and MafA induction. Cell Metab 2005;2:153–163 [DOI] [PubMed] [Google Scholar]
- 34.Hylemon PB, Zhou H, Pandak WM, Ren S, Gil G, Dent P. Bile acids as regulatory molecules. J Lipid Res 2009;50:1509–1520 [DOI] [PMC free article] [PubMed] [Google Scholar]
- 35.Billington D, Evans CE, Godfrey PP, Coleman R. Effects of bile salts on the plasma membranes of isolated rat hepatocytes. Biochem J 1980;188:321–327 [DOI] [PMC free article] [PubMed] [Google Scholar]
- 36.Vyvoda OS, Coleman R, Holdsworth G. Effects of different bile salts upon the composition and morphology of a liver plasma membrane preparation. Deoxycholate is more membrane damaging than cholate and its conjugates. Biochim Biophys Acta 1977;465:68–76 [DOI] [PubMed] [Google Scholar]
- 37.Akare S, Martinez JD. Bile acid induces hydrophobicity-dependent membrane alterations. Biochim Biophys Acta 2005;1735:59–67 [DOI] [PubMed]
- 38.Düfer M, Hörth K, Wagner R, et al. Bile acids acutely stimulate insulin secretion of mouse β-cells via farnesoid X receptor activation and K(ATP) channel inhibition. Diabetes 2012;61:1479–1489 [DOI] [PMC free article] [PubMed] [Google Scholar]
- 39.Renga B, Mencarelli A, Vavassori P, Brancaleone V, Fiorucci S. The bile acid sensor FXR regulates insulin transcription and secretion. Biochim Biophys Acta 2010;1802:363–372 [DOI] [PubMed]
- 40.Lew JL, Zhao A, Yu J, et al. The farnesoid X receptor controls gene expression in a ligand- and promoter-selective fashion. J Biol Chem 2004;279:8856–8861 [DOI] [PubMed] [Google Scholar]
- 41.Duran-Sandoval D, Mautino G, Martin G, et al. Glucose regulates the expression of the farnesoid X receptor in liver. Diabetes 2004;53:890–898 [DOI] [PubMed] [Google Scholar]
- 42.Seyer P, Vallois D, Poitry-Yamate C, et al. Hepatic glucose sensing is required to preserve β cell glucose competence. J Clin Invest 2013;123:1662–1676 [DOI] [PMC free article] [PubMed] [Google Scholar]
Associated Data
This section collects any data citations, data availability statements, or supplementary materials included in this article.