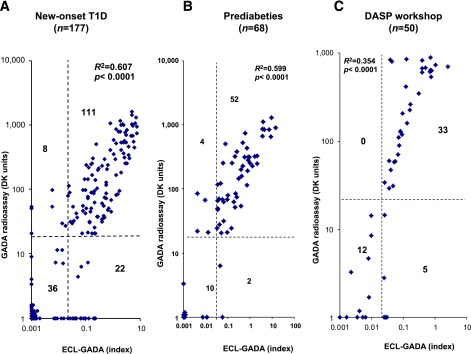
FIG. 1.

GADA levels from ECL-GADA assay compared with the standard NIDDK harmonized GADA radioassay. The dashed lines represent the assay cutoffs. The two assays were correlated (P < 0.0001) for all three groups, with both assays set at 99% specificity. A: Newly diagnosed children with T1D (n = 177) at the Barbara Davis Center. B: Prediabetic DAISY participants (n = 68). C: Newly diagnosed DASP workshop participants (n = 50).
