

Abstract
Oxidative stress has been associated with insulin resistance and type 2 diabetes. However, it is not clear whether oxidative damage is a cause or a consequence of the metabolic abnormalities present in diabetic subjects. The goal of this study was to determine whether inducing oxidative damage through genetic ablation of superoxide dismutase 1 (SOD1) leads to abnormalities in glucose homeostasis. We studied SOD1-null mice and wild-type (WT) littermates. Glucose tolerance was evaluated with intraperitoneal glucose tolerance tests. Peripheral and hepatic insulin sensitivity was quantitated with the euglycemic-hyperinsulinemic clamp. β-Cell function was determined with the hyperglycemic clamp and morphometric analysis of pancreatic islets. Genetic ablation of SOD1 caused glucose intolerance, which was associated with reduced in vivo β-cell insulin secretion and decreased β-cell volume. Peripheral and hepatic insulin sensitivity were not significantly altered in SOD1-null mice. High-fat diet caused glucose intolerance in WT mice but did not further worsen the glucose intolerance observed in standard chow–fed SOD1-null mice. Our findings suggest that oxidative stress per se does not play a major role in the pathogenesis of insulin resistance and demonstrate that oxidative stress caused by SOD1 ablation leads to glucose intolerance secondary to β-cell dysfunction.
Markers of oxidative stress are elevated in insulin resistant (obese and type 2 diabetic [T2D]) subjects. For example, the concentrations of isoprostanes, one of the best characterized markers of oxidative damage, are elevated in plasma and urine of subjects with T2D (1). Deficiencies in antioxidant defenses also have been described in diabetes, including lower levels of ascorbate, glutathione, and superoxide dismutase (SOD) (2). Lower concentrations of reduced glutathione have been documented in neutrophils and monocytes, while reduced concentrations of ascorbate have been found in both diabetic plasma and mononuclear cells (2). Collectively, these data suggest that oxidative stress may play a role in the pathogenesis of insulin resistance and diabetes.
Despite substantial information indicating that insulin resistant states are associated with increased oxidative damage (3–5), it remains unclear whether these changes are the cause or consequence of the unbalanced metabolic state. To examine whether increased oxidative stress leads to impaired glucose homeostasis, we studied mice that are null for SOD1, the gene that encodes for the antioxidant enzyme copper zinc SOD. This enzyme, which mainly is located in the cytosol, converts superoxide to H2O2 and O2. We hypothesized that the oxidative damage caused by the absence of SOD1 would impair glucose tolerance and insulin sensitivity.
RESEARCH DESIGN AND METHODS
We studied male SOD1-null mice between the ages of 3 and 4 months. These mice were generated by Dr. Charles Epstein's laboratory at the University of California, San Francisco, and have previously been described (6). Our group has characterized this animal model extensively and demonstrated that these mice have no detectable copper zinc SOD activity in skeletal muscle, whereas the activities of manganese (Mn) SOD, glutathione peroxidase 1 (GPX1), and catalase are unchanged (7). These mice have elevated F2 isoprostanes levels in muscle and plasma and oxidative damage to proteins, lipids, and DNA (7).
Maintenance of mice.
Animals were housed in an animal room maintained at 23°C with a 12-h light/12-h dark cycle and fed standard laboratory chow and water ad libitum. All procedures were approved by the Institutional Animal Care and Use Committee of the University of Texas Health Science Center, San Antonio.
Intraperitoneal glucose tolerance test.
Fasted SOD1-null mice (n = 12) and wild-type (WT) littermates (n = 11) were injected with dextrose (2 g/kg i.p.). Glucose level was measured in tail blood at times 0, 30, 60, and 120 min using an automatic glucose meter (Roche Diagnostics, Indianapolis, IN).
Euglycemic-hyperinsulinemic clamp studies.
Insulin clamp studies were performed on seven SOD1-null and seven WT mice. Three to five days prior to the insulin clamp, a catheter was inserted into the right atrium of the heart through the jugular vein as previously described (8). A 90-min euglycemic-hyperinsulinemic (18 mU/kg ⋅ min) clamp was performed in fasted mice as previously described (8).
Hyperglycemic clamp.
Six SOD1-null and 6 WT mice had a catheter inserted into the right atrium and 3–5 days later underwent a hyperglycemic clamp to evaluate β-cell function. At time 0, a glucose bolus (0.75 g/kg) was injected through the catheter, tail blood glucose concentration was measured every 5–10 min, and a variable infusion of 20% glucose was administered to maintain plasma glucose concentrations at ∼300 mg/dL. Blood samples were collected from the tail at times 0, 5, 10, 15, 20, 30, 50, 70, and 90 min for the measurement of plasma insulin concentration (Crystal Chem, Downers Grove, IL).
Histology and immunohistochemistry.
Five SOD1-null and six WT mice were killed with an overdose (150 mg/kg) of pentobarbital, and pancreatic tissues were collected. The tissue was fixed in 10% neutral-buffered formalin and paraffin embedded. Five-micrometer-thick sections were stained with hematoxylin-eosin. For immunohistochemistry, 3-µm-thick sections, after endogenous peroxidase activity inhibition, were incubated with the primary antibody (anti-insulin mouse, clone AE9D6; Biogenex Laboratories, San Ramon, CA) at 4°C for 18–20 h, followed by the avidin-biotin complex procedure (9). Immunoreactions were developed using 0.03% 3,3′diaminobenzidine tetrahydrochloride. Morphometric analysis was performed using the Computer Assisted Stereology Toolbox (CAST) 2.0 system from Olympus (Ballerup, Denmark) and using the stereology fundaments on pancreatic sections randomly collected from the pancreas (10). The operator was blinded to the genotype status of the mice. Each field was selected randomly using the CAST meander sampling. We analyzed ~168 fields per section, and in each field point counting of total pancreatic tissue and islets was performed at the magnification of ×100 in order to calculate the relative β-cell volume. Relative β-cell volumes were calculated using the following formulas: 1) relative β-cell volume/pancreas: (IP/TP) × 100, where IP is points that hit β-cells in the insulin stain and TP is total pancreas points, and 2) relative β-cell volume/islet: (II/TPI) × 100, where II is points that hit insulin positive cells and TPI is total points that hit the islet. Total pancreatic point counts averaged 4,497 per slice per mouse.
Glucose-stimulated insulin secretion.
SOD1-null and WT mice were anesthetized with pentobarbital and pancreatic islets isolated using a modification of the method of Gotoh et al. (11). Briefly, pancreas ducts were infused with collagenase (rodent LiberaseTM; Roche, Indianapolis, IN), followed by Histopaque (Sigma, St. Louis, MO) gradient separation and handpicking to ensure high purity. To measure insulin secretion, two replicate experiments were done for each animal with six animals tested individually per group. Insulin secretion was measured in static conditions by sequential incubation in basal, stimulatory glucose and isobutylmethylxanthine (IBMX). After overnight culture, islets were washed twice with Krebs-Ringer bicarbonate buffer containing16 mmol/L HEPES and 0.1% BSA, pH 7.4 (KRB-HEPES) and preincubated for 1 h in 1 mL KRB-HEPES in 24-well dishes at 37°C with 5% CO2 with 2.8 mmol/L glucose as previously described (12). Media was then changed and, after an additional hour in KRB-HEPES 2.8 mmol/L glucose, islets were removed for determination of basal insulin release and then incubated with 16.8 mmol/L glucose for 1 h. This was followed by a third incubation with 16.8 mmol/L glucose plus IBMX (1 mmol/L). Islets were washed twice with KRB-HEPES 2.8 mmol/L glucose every time secretion media was changed. Supernatants were frozen until assayed in duplicate with an insulin rat (enzyme immunoassay) kit (ALPCO, Salem, NH). Islets were collected and sonicated for a total of 30 s and stored at −20°C until assayed for DNA and insulin content.
High-fat feeding protocol.
At ~4 months of age, a second cohort of WT and SOD1-null mice was assigned to a standard diet or a high-fat defined diet (45% kcal from fat, D12451; Test Diets) for 12 weeks (n = 4 per group). These mice then were subjected to glucose tolerance tests (1.5 g dextrose/kg i.p.) and body composition measurement by Quantitative Magnetic Resonance imaging using an EchoMRI 3-in-1 composition analyzer (Echo Medical Systems, Houston, TX).
Mitochondrial H2O2 release.
Mitochondria were purified from freshly collected whole hind-limb skeletal muscle as previously described (13). H2O2 production by muscle mitochondria was measured using the Amplex red (Molecular Probes, Eugene OR)–horseradish peroxidase method, as previously described (14). Amplex red reagent was made in reactive oxygen species (ROS) buffer (125 mmol/L KCl, 10 mmol/L HEPES, 5 mmol/L MgCl2, and 2 mmol/L K2HPO4, pH 7.44) with 77.8 μmol/L Amplex-Red, 1 unit/mL horseradish peroxidase, and 37.5 units/mL SOD (to convert all superoxide into H2O2). All assays were performed in black 96-well plates at 37°C, and fluorescence was measured using a Fluoroskan Ascent type 374 multiwell plate reader (Labsystems, Helsinki, Finland) reading at an excitation wavelength of 545 nm and an emission wavelength of 590 nm. Each assay used one reaction well containing buffer only and another containing buffer with mitochondria to estimate the mitochondria H2O2 release without substrate. Mitochondria complex substrates/inhibitors were added at the following concentrations: glutamate/malate (5 mmol/L), succinate (10 mmol/L), and rotenone (1 μmol/L).
Measurement of ATP production.
ATP production by isolated mitochondria was measured using a luminometric assay (ATP Bioluminescence Assay CLS II; Roche) as previously described (15).
Measurement of F2-isoprostanes and 4-hydroxynonenal–modified proteins.
F2-isoprostanes and 4-hydroxynonenal (4-HNE) are accurate indicators of lipid peroxidation. Muscle F2-isoprostane content was performed by chromatography–mass spectrometry as previously described by our group (16). Protein-bound 4-HNE was determined by immunoblotting of 75 µg skeletal muscle protein separated by SDS-PAGE and incubated with primary anti–4-HNE antibody from Abcam (Cambridge, Mass).
Neuroglycopenia induction.
WT and SOD1-null mice (n = 4 per group) received an injection of 2-deoxyglucose (2DG) (500 mg/kg i.p.) (17). Plasma glucose (Roche glucose meter) and glucagon (ELISA kit; ALPCO) concentration were measured before and 30 min after 2DG administration. 2DG, by competitive inhibition of glucose utilization, produces a state of intracellular neuroglycopenia with resultant activation of the autonomic nervous system (17), followed by glucagon release and hyperglycemia.
Antioxidant enzyme activity assays.
SOD and GPX activity were measured using assay kits for each from Trevigen (Gaithersburg, MD). Muscle (quadriceps) and fat (epigonadal) were homogenized in provided 1X assay buffer with the addition of protease inhibitors. For each assay, 40 µg protein from each tissue homogenate was used, and all samples were assayed in duplicate. Enzyme activity was calculated based on the manufacturer’s directions.
Immunoblotting.
Muscle (quadriceps) tissue was homogenized in a modified radioimmunoprecipitation assay homogenization buffer with the addition of protease and phosphatase inhibitors. Protein (70 µg) of each sample was separated by SDS-PAGE and transferred to polyvinyledine fluoride for immunoblotting. Phospho-Akt (Ser473) and total Akt antibodies were from Cell Signaling (Danvers, MA).
Statistical analysis.
Data are expressed as means ± SE. Statistical evaluation was performed by Student two-tailed t test or two-way ANOVA followed by the Fisher post hoc test for multiple comparisons. P < 0.05 was considered statistically significant. Statistical analysis was performed using SigmaStat software.
RESULTS
General characteristics of SOD1-null mice.
Consistent with our previous findings (7), the body weight of SOD1-null mice was significantly reduced (18.7 ± 2.55 g in SOD1-null vs. 24.8 ± 0.62 g in WT; P < 0.05). The fasting plasma insulin concentrations tended to be lower in SOD1-null mice vs. WT (150 ± 3.42 vs. 277 ± 37.4 µUI/mL; P = 0.05). Fasting glucose was not significantly different between WT and SOD1-null mice (159 ± 9.64 vs. 119 ± 15.9 mg/dL; P = NS).
Glucose tolerance.
As shown in Fig. 1, ablation of SOD1 caused a significant impairment in glucose tolerance. The blood glucose concentration was significantly elevated at 30 and 60 min after glucose administration.
FIG. 1.

Glucose tolerance in SOD1-null mice. Blood glucose concentration was measured after the administration of intraperitoneal glucose in WT and SOD1-null mice. Data are means ± SE. *P < 0.05. KO, knockout.
Insulin sensitivity.
We conducted euglycemic-hyperinsulinemic clamps to examine the effect of SOD1 ablation on peripheral and hepatic insulin sensitivity. There was a tendency (P = 0.13) for a 20% reduction in insulin-stimulated Rd in SOD1-null mice (Fig. 2A). Basal endogenous (primarily hepatic) glucose production (EGP) and insulin suppression of EGP were similar in both groups (Fig. 2B).
FIG. 2.

Insulin-stimulated whole-body glucose disposal determined with the euglycemic-hyperinsulinemic clamp technique (A). EGP rate (B). Data are means ± SE. KO, knockout.
Insulin secretion in vivo.
Blood glucose concentrations were rapidly increased and maintained at ∼300 mg/dL during the hyperglycemic clamp. The plasma insulin concentration during the first phase and second phase of insulin secretion was significantly reduced in SOD1-null vs. WT mice (Fig. 3).
FIG. 3.

Insulin secretion in vivo during a hyperglycemic clamp. Data are means ± SE. *P < 0.05. KO, knockout.
Morphometric analysis of islets.
Morphometric examination was performed in five SOD1 null and six WT mice (Fig. 4). β-Cell volume accounted for 0.98 ± 0.17% of the pancreatic area in WT and 0.73 ± 0.18% in SOD1-null mice (P = 0.2) (Fig. 5A). The volume of the islets occupied by β-cells was lower in SOD1-null vs. WT mice (64 ± 3.3 vs. 78 ± 3.0% of islet volume, respectively; P < 0.05) (Fig. 5B). Furthermore, SOD1-null mice showed a reduced average islet size of 8,490 ± 685.5 µm2 compared with 9,235 ± 1,541 µm2 in WT animals, although this difference did not reach statistical significance (Fig. 5C).
FIG. 4.

Representative microscopic images of insulin, glucagon, and somatostatin immunostaining of pancreatic islets. KO, knockout.
FIG. 5.

Morphometric analysis of pancreatic islets. β-Cell volume expressed as the percentage of the pancreas (A), percentage of the islets (B), and islet size (C). Data are means ± SE. *P < 0.05. KO, knockout.
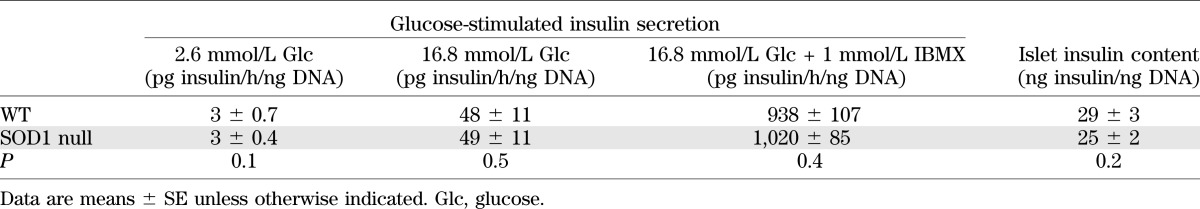
Glucose-stimulated insulin secretion assay.
As shown in Table 1, β-cells from SOD1 null mice were able to normally secrete insulin in response to hyperglycemia in vitro.
TABLE 1.
In vitro glucose-stimulated insulin secretion and islet insulin content
2DG challenge.
Plasma glucagon and glucose concentrations before and after 2DG administration were similar between WT and SOD1 groups (Supplementary Figs. 1A and B).
Effects of high-fat feeding.
The high-fat diet increased adipose tissue mass in both groups of mice, though to a smaller degree in SOD1-null mice (Fig. 6A). Consistent with a prior study from our own group (7), deletion of SOD1 caused a decrease in lean mass, and this decline was evident in animals fed standard and high-fat diets (Fig. 6A). Similar to the first cohort examined (Fig. 1), SOD1 mice on normal chow from the second cohort had impaired glucose tolerance (Figs. 6B and C) and decreased plasma insulin concentration (Fig. 6D). As expected, the high-fat diet caused glucose intolerance in WT mice. Notably, in SOD1-null mice the high-fat diet did not further worsen the glucose intolerance observed in standard chow–fed animals (Figs. 6B and C).
FIG. 6.

A: Average fat and lean mass for mice in the indicated diet group; *P < 0.05 between genotypes for indicated diet. B: Glucose tolerance curve in low-fat (LF) and high-fat (HF)-fed mice. C: Area under the curve calculated from glucose tolerance tests; *P < 0.05 vs. WT on low-fat diet. D: Plasma insulin concentration; *P < 0.05 vs. WT mice from corresponding diet assignment. Data are means ± SE. KO, knockout.
As expected, muscle from SOD1-null mice on the standard diet had increased mitochondrial H2O2 emissions (Fig. 7A) and oxidative stress, as evidenced by elevated muscle F2-ispoprostane content (Fig. 7B) and 4-HNE (Fig. 7C). High-fat diet increased oxidative damage in WT mice but did not alter mitochondrial H2O2 emissions (Figs. 7A–C). Interestingly, the high-fat diet did not further alter ROS production or markers of oxidative stress in the SOD1-null mice. No alterations in mitochondrial ATP production were observed in muscle from SOD1-null mice placed on the standard and high-fat diets (Supplementary Fig. 2). As predicted, total SOD activity was significantly reduced in muscle and adipose tissue of SOD1-null mice (Supplementary Fig. 3). Interestingly, muscle in SOD1-null mice had almost no total SOD activity, whereas adipose tissue retained approximately one-third of total SOD activity. This suggests that the greatest contribution to total SOD activity in muscle is provided by SOD1. GPX activity was not affected by the lack of SOD1. In addition, high-fat feeding did not significantly alter SOD in either WT or SOD1-null mice or alter GPX activity in either genotype. These data demonstrate that the lack of SOD1 does not lead to compensatory effects on the other antioxidant enzymes and suggest that increased oxidative stress with high-fat feeding is not due directly to reduced antioxidant defense.
FIG. 7.

A: H2O2 production of isolated skeletal muscle mitochondria with different (or no) mitochondrial substrates; *P < 0.05 between genotypes for indicated diet. B: F2-isoprostanes content in muscle; *P < 0.05 vs. WT from corresponding diet. C: 4-HNE adducts in muscle; *P < 0.05 vs. WT on low-fat diet. Data are means ± SE. AU, arbitrary units; Glut/Mal, glutamate/malate; HF, high fat; KO, knockout; LF, low fat; Succ/Rot, succinate/rotenone.
DISCUSSION
Consistent with our hypothesis, deletion of SOD1 resulted in glucose intolerance. This suggests that oxidative damage plays a role in the glucose metabolic abnormalities in T2D subjects. Surprisingly, the glucose intolerance seen in SOD1-null mice was not the result of significantly reduced insulin sensitivity in periphery (muscle) tissues or the liver. This prompted us to examine whether abnormalities in β-cell function could explain the glucose intolerance. Indeed, the results from the hyperglycemic clamp demonstrated a significantly blunted insulin secretion response, a defect that was in part explained by a reduction in β-cell volume.
The effect of oxidative stress on insulin sensitivity and peripheral (muscle) glucose disposal is controversial (18–20). Elevations in plasma glucose and free fatty acids are thought to increase ROS levels (18,21), which in turn activate inflammation signaling pathways such as mitogen-activated protein kinases (22) and nuclear factor-κB (23). The activation of these inflammation cascades is thought to cause insulin resistance, which accounts for >80% of peripheral Rd (24). However, a beneficial effect of oxidative stress on muscle glucose disposal also has been reported and attributed to the activation of the phosphatidylinositol 3-kinase signaling pathway (19,20).
We hypothesized that SOD1-null mice would be significantly insulin resistant compared with WT animals due to excess ROS production and decreased lean body mass (7). Nonetheless, we did not observe a significant reduction in peripheral insulin sensitivity in SOD1-null mice, although it is possible that the study might have been underpowered to detect subtle alterations in peripheral insulin action. In addition, we did not see significant differences in Akt phosphorylation (Supplementary Fig. 4). The minimal effect caused by SOD1 ablation on insulin sensitivity was unexpected, considering that oxidative stress has been implicated in the pathogenesis of insulin resistance and diabetes (18,21). On the other hand, an important role for ROS in the maintenance of normal muscle function is now increasingly being recognized. For example, muscle contraction increases ROS production, an effect that might play a role in the adaptations to exercise training (25). Consistent with this, increased activity of GPX activity leads to the development of insulin resistance in mice (26) due to a reduction in H2O2 and resultant inhibition of protein tyrosine phosphatases (27).
One might speculate that SOD1 ablation per se is not sufficient to cause a pathologic state in peripheral tissues. Yet, our group has demonstrated that SOD1-null mice fed a standard diet exhibit sarcopenia and reduced physical performance (7), presumably resulting from “pathologic” oxidative stress. We also fed the SOD1-null mice a diet with a high fat content to examine whether potential alterations in glucose metabolism would become apparent by high-fat feeding. Interestingly, the glucose intolerance caused by the high-fat diet was not significantly worsened by deletion of SOD1. The lack of additive effect of SOD1 ablation and high-fat feeding on glucose intolerance suggests that oxidative stress could be an important mechanism by which high-fat feeding causes glucose intolerance.
The present results demonstrate that SOD1-null mice manifest defects in both the first and second phases of insulin secretion. Accordingly, several studies have shown that pancreatic β-cells are a target of oxidative stress in T2D (28–30). A reduced expression of antioxidant enzymes in β-cells, including catalase and GPX1, predisposes these cells to ROS damage (31,32). Multiple pathogenic factors may contribute to the impairment of insulin secretion in vivo in SOD1-null mice. SOD1 regulates the expression of pancreatic and duodenal homeobox (Pdx1), a transcription factor necessary for pancreatic development and β-cell maturation, and stimulates the expression of multiple pancreatic genes, including insulin, GLUT2, and glucokinase 5 (33). Reduction of SOD1 decreases H3 acetylation and H3K4 methylation of the Pdx1 promoter region, resulting in decreased Pdx1 mRNA and protein levels (34). In addition, lack of SOD1 causes a decrease in FOXA2 mRNA protein, which binds to the promoter/enhancer region of the Pdx1 gene and augments its expression in vivo (34). Thus, changes induced by knocking out SOD1 can impair insulin secretion that already is compromised by the decrease in β-cell volume and low expression of Pdx1.
In the current study, we demonstrate impaired insulin secretion in vivo. Yet, we did not observe any difference in glucose-stimulated insulin secretion in vitro. This may indicate that the environment in which the β-cells reside, rather than an intrinsic β-cell defect, is responsible for the impairment in insulin secretion. Because SOD1-null mice also display neuropathologic changes (35), we evaluated autonomic input to the pancreatic islets in vivo by measuring glucagon release (and consequent hyperglycemia) after 2DG-induced neuroglycopenia. Nonetheless, the response was similar in WT and SOD1-null mice. Because removal of the islets from the body and in vitro perfusion could result in a “wash out” of the toxic effect of ROS, it is possible that deletion of SOD1 alters the levels of one or more systemic factors that impair in vivo insulin release. Future studies will be aimed at identifying and characterizing potential systemic factors that impair β-cell function in this animal model of elevated oxidative stress.
In conclusion, our results demonstrate that the absence of SOD1 is associated with the development of impaired glucose tolerance that results from impaired β-cell function and reduced β-cell volume. Insulin-stimulated glucose disposal is minimally affected by genetic ablation of SOD1.
Supplementary Material
ACKNOWLEDGMENTS
A.G. was supported by grants from Fondazione Don Gnocchi, Università Cattolica del Sacro Cuore (Fondi Ateneo Linea D.3.2 Sindrome Metabolica), and the Italian Ministry of Education, University and Research (PRIN 2010JS3PMZ_011). G.W. was supported by the National Institutes of Health (R01DK66056 and DK93909 and P30DK36836 [Joslin Diabetes Research Center]), JDRF, and Diabetes Research and Wellness Foundation. H.V.R. was supported by grant P01AG020591 from the National Institute on Aging. N.M. was supported by a Paul B. Beeson Award from the National Institute on Aging (K23AG030979) and the American Federation for Aging Research and grants from the National Institute of Diabetes and Digestive and Kidney Diseases (RO1DK089229 and R01DK089229) and the American Diabetes Association.
No potential conflicts of interest relevant to this article were reported.
G.M. and A.B.S. drafted the manuscript and carried out the experiments. C.A.-M., M.L., B.B., R.G.-M., R.L.R., S.M.R., and H.V.R. carried out the experiments. A.G., G.W., and R.A.D. revised data. N.M. drafted the manuscript, revised data, conceived the study, and participated in its design and coordination. N.M. is the guarantor of this work and, as such, had full access to all the data in the study and takes responsibility for the integrity of the data and the accuracy of the data analysis.
Parts of this study were presented in abstract form at the European Association for the Study of Diabetes 44th Annual Meeting, Rome, Italy, 7–11 September 2008.
Footnotes
This article contains Supplementary Data online at http://diabetes.diabetesjournals.org/lookup/suppl/doi:10.2337/db13-0314/-/DC1.
REFERENCES
- 1.Morrow JD. Quantification of isoprostanes as indices of oxidant stress and the risk of atherosclerosis in humans. Arterioscler Thromb Vasc Biol 2005;25:279–286 [DOI] [PubMed] [Google Scholar]
- 2.Oranje WA, Wolffenbuttel BH. Lipid peroxidation and atherosclerosis in type II diabetes. J Lab Clin Med 1999;134:19–32 [DOI] [PubMed] [Google Scholar]
- 3.Park K, Gross M, Lee DH, et al. Oxidative stress and insulin resistance: the coronary artery risk development in young adults study. Diabetes Care 2009;32:1302–1307 [DOI] [PMC free article] [PubMed] [Google Scholar]
- 4.Ogihara T, Asano T, Katagiri H, et al. Oxidative stress induces insulin resistance by activating the nuclear factor-κB pathway and disrupting normal subcellular distribution of phosphatidylinositol 3-kinase. Diabetologia 2004;47:794–805 [DOI] [PubMed] [Google Scholar]
- 5.Styskal J, Van Remmen H, Richardson A, Salmon AB. Oxidative stress and diabetes: what can we learn about insulin resistance from antioxidant mutant mouse models? Free Radic Biol Med 2012;52:46–58 [DOI] [PMC free article] [PubMed] [Google Scholar]
- 6.Elchuri S, Oberley TD, Qi W, et al. CuZnSOD deficiency leads to persistent and widespread oxidative damage and hepatocarcinogenesis later in life. Oncogene 2005;24:367–380 [DOI] [PubMed]
- 7.Muller FL, Song W, Liu Y, et al. Absence of CuZn superoxide dismutase leads to elevated oxidative stress and acceleration of age-dependent skeletal muscle atrophy. Free Radic Biol Med 2006;40:1993–2004 [DOI] [PubMed]
- 8.Liang H, Balas B, Tantiwong P, et al. Whole body overexpression of PGC-1α has opposite effects on hepatic and muscle insulin sensitivity. Am J Physiol Endocrinol Metab 2009;296:E945–E954 [DOI] [PMC free article] [PubMed] [Google Scholar]
- 9.Bratthauer GL. The avidin-biotin complex (ABC) method and other avidin-biotin binding methods. Methods Mol Biol 2010;588:257–270 [DOI] [PubMed] [Google Scholar]
- 10.Mandarim-de-Lacerda CA. Stereological tools in biomedical research. An Acad Bras Cienc 2003;75:469–486 [DOI] [PubMed] [Google Scholar]
- 11.Gotoh M, Maki T, Satomi S, et al. Reproducible high yield of rat islets by stationary in vitro digestion following pancreatic ductal or portal venous collagenase injection. Transplantation 1987;43:725–730 [DOI] [PubMed] [Google Scholar]
- 12.Schuppin GT, Bonner-Weir S, Montana E, Kaiser N, Weir GC. Replication of adult pancreatic-beta cells cultured on bovine corneal endothelial cell extracellular matrix. In Vitro Cell Dev Biol Anim 1993;29A:339–344 [DOI] [PubMed] [Google Scholar]
- 13.Bhattacharya A, Lustgarten M, Shi Y, et al. Increased mitochondrial matrix-directed superoxide production by fatty acid hydroperoxides in skeletal muscle mitochondria. Free Radic Biol Med 2011;50:592–601 [DOI] [PMC free article] [PubMed] [Google Scholar]
- 14.Zhou M, Diwu Z, Panchuk-Voloshina N, Haugland RP: A stable nonfluorescent derivative of resorufin for the fluorometric determination of trace hydrogen peroxide: applications in detecting the activity of phagocyte NADPH oxidase and other oxidases. Anal Biochem. 1997;253:162–168 [DOI] [PubMed]
- 15.Ghosh S, Lertwattanarak R, Lefort N, et al. Reduction in reactive oxygen species production by mitochondria from elderly subjects with normal and impaired glucose tolerance. Diabetes 2011;60:2051–2060 [DOI] [PMC free article] [PubMed] [Google Scholar]
- 16.Ward WF, Qi W, Van Remmen H, Zackert WE, Roberts LJ, 2nd, Richardson A. Effects of age and caloric restriction on lipid peroxidation: measurement of oxidative stress by F2-isoprostane levels. J Gerontol A Biol Sci Med Sci 2005;60:847–851 [DOI] [PubMed] [Google Scholar]
- 17.Asplin CM, Werner PL, Halter JB, Hollander PM, Palmer JP. Autonomic nervous system control of glucagon secretion during neuroglucopenia. Endocrinology 1983;112:1585–1589 [DOI] [PubMed] [Google Scholar]
- 18.Evans JL, Maddux BA, Goldfine ID. The molecular basis for oxidative stress-induced insulin resistance. Antioxid Redox Signal 2005;7:1040–1052 [DOI] [PubMed] [Google Scholar]
- 19.Kozlovsky N, Rudich A, Potashnik R, Bashan N. Reactive oxygen species activate glucose transport in L6 myotubes. Free Radic Biol Med 1997;23:859–869 [DOI] [PubMed] [Google Scholar]
- 20.Higaki Y, Mikami T, Fujii N, et al. Oxidative stress stimulates skeletal muscle glucose uptake through a phosphatidylinositol 3-kinase-dependent pathway. Am J Physiol Endocrinol Metab 2008;294:E889–E897 [DOI] [PMC free article] [PubMed] [Google Scholar]
- 21.Folli F, Corradi D, Fanti P, et al. The role of oxidative stress in the pathogenesis of type 2 diabetes mellitus micro- and macrovascular complications: avenues for a mechanistic-based therapeutic approach. Curr Diabetes Rev 2011;7:313–324 [DOI] [PubMed]
- 22.Kim EK, Choi EJ. Pathological roles of MAPK signaling pathways in human diseases. Biochim Biophys Acta 2010;1802:396–405 [DOI] [PubMed] [Google Scholar]
- 23.Sigala I, Zacharatos P, Toumpanakis D, et al. MAPKs and NF-κB differentially regulate cytokine expression in the diaphragm in response to resistive breathing: the role of oxidative stress. Am J Physiol Regul Integr Comp Physiol 2011;300:R1152–R1162 [DOI] [PubMed] [Google Scholar]
- 24.Ferrannini E, Simonson DC, Katz LD, et al. The disposal of an oral glucose load in patients with non-insulin-dependent diabetes. Metabolism 1988;37:79–85 [DOI] [PubMed] [Google Scholar]
- 25.Abruzzo PM, Esposito F, Marchionni C, et al. Moderate exercise training induces ROS-related adaptations to skeletal muscles. Int J Sports Med 2013;34:676–687 [DOI] [PubMed] [Google Scholar]
- 26.McClung JP, Roneker CA, Mu W, et al. Development of insulin resistance and obesity in mice overexpressing cellular glutathione peroxidase. Proc Natl Acad Sci U S A 2004;101:8852–8857 [DOI] [PMC free article] [PubMed]
- 27.Goldstein BJ, Mahadev K, Wu X. Redox paradox: insulin action is facilitated by insulin-stimulated reactive oxygen species with multiple potential signaling targets. Diabetes 2005;54:311–321 [DOI] [PMC free article] [PubMed] [Google Scholar]
- 28.Kaneto H, Fujii J, Myint T, et al. Reducing sugars trigger oxidative modification and apoptosis in pancreatic beta-cells by provoking oxidative stress through the glycation reaction. Biochem J 1996; 320:855–863 [DOI] [PMC free article] [PubMed]
- 29.Kaneto H, Kajimoto Y, Miyagawa J, et al. Beneficial effects of antioxidants in diabetes: possible protection of pancreatic beta-cells against glucose toxicity. Diabetes 1999;48:2398–2406 [DOI] [PubMed] [Google Scholar]
- 30.Ihara Y, Toyokuni S, Uchida K, et al. Hyperglycemia causes oxidative stress in pancreatic beta-cells of GK rats, a model of type 2 diabetes. Diabetes 1999;48:927–932 [DOI] [PubMed] [Google Scholar]
- 31.Tiedge M, Lortz S, Drinkgern J, Lenzen S. Relation between antioxidant enzyme gene expression and antioxidative defense status of insulin-producing cells. Diabetes 1997;46:1733–1742 [DOI] [PubMed] [Google Scholar]
- 32.Tanaka Y, Tran PO, Harmon J, Robertson RP. A role for glutathione peroxidase in protecting pancreatic beta cells against oxidative stress in a model of glucose toxicity. Proc Natl Acad Sci U S A 2002;99:12363–12368 [DOI] [PMC free article] [PubMed]
- 33.Babu DA, Deering TG, Mirmira RG. A feat of metabolic proportions: Pdx1 orchestrates islet development and function in the maintenance of glucose homeostasis. Mol Genet Metab 2007;92:43–55 [DOI] [PMC free article] [PubMed] [Google Scholar]
- 34.Wang X, Vatamaniuk MZ, Roneker CA, et al. Knockouts of SOD1 and GPX1 exert different impacts on murine islet function and pancreatic integrity. Antioxid Redox Signal 2011;14:391–401 [DOI] [PMC free article] [PubMed]
- 35.Hamilton RT, Bhattacharya A, Walsh ME, et al. Elevated protein carbonylation, and misfolding in sciatic nerve from db/db and Sod1(-/-) mice: plausible link between oxidative stress and demyelination. PLoS ONE 2013;8:e65725. [DOI] [PMC free article] [PubMed] [Google Scholar]
Associated Data
This section collects any data citations, data availability statements, or supplementary materials included in this article.