

Background: Understanding how Q226E and V280M produce tonic activation may reveal how glycine receptors activate.
Results: Q226E generates an attraction between the first and second transmembrane domains. V280M separates the first and third transmembrane domains.
Conclusion: We propose either movement can initiate activation.
Significance: Comparison with x-ray structures of bacterial Cys loop receptors suggests these activation mechanisms apply broadly across the receptor family.
Keywords: Cys Loop Receptors, Glycine Receptors, Patch Clamp, Receptor Structure-Function, Site-directed Mutagenesis
Abstract
Pentameric ligand-gated ion channels (pLGICs) mediate numerous physiological processes and are therapeutic targets for a wide range of clinical indications. Elucidating the structural differences between their closed and open states may help in designing improved drugs that bias receptors toward the desired conformational state. We recently showed that two new hyperekplexia mutations, Q226E and V280M, induced spontaneous activity in α1 glycine receptors. Gln-226, located near the top of transmembrane (TM) 1, is closely apposed to Arg-271 at the top of TM2 in the neighboring subunit. Using mutant cycle analysis, we inferred that Q226E induces activation via an enhanced electrostatic attraction to Arg-271. This would tilt the top of TM2 toward TM1 and hence away from the pore axis to open the channel. We also concluded that the increased side chain volume of V280M, in the TM2-TM3 loop, exerts a steric repulsion against Ile-225 at the top of TM1 in the neighboring subunit. We infer that this steric repulsion would tilt the top of TM3 radially outwards against the stationary TM1 and thus provide space for TM2 to relax away from the pore axis to create an open channel. Because the transmembrane domain movements inferred from this functional analysis are consistent with the structural differences evident in the x-ray atomic structures of closed and open state bacterial pLGICs, we propyose that the model of pLGIC activation as outlined here may be broadly applicable across the eukaryotic pLGIC receptor family.
Introduction
Glycine receptors (GlyRs),2 which belong to the family of pentameric ligand-gated ion channel (pLGIC) receptors, mediate inhibitory neurotransmission in the spinal cord, brainstem, and retina (1, 2). In humans, four α GlyR subunits (α1–α4) and a single β subunit are known (3). GlyRs express as α homomers or as αβ heteromers. However, synaptic GlyRs are thought to exist predominantly as αβ heteromers because the β subunit is required for synaptic clustering via the cytoplasmic scaffolding protein, gephyrin (4, 5). Each GlyR subunit contains an extracellular domain (ECD) harboring a ligand-binding site and a transmembrane domain (TMD) formed by four membrane-spanning α-helices (termed TM1–TM4) that are connected by flexible loops (6–9). The TM2 domains line the central ion-conducting pore with the other domains arranged concentrically around it, providing an interface between the hydrophilic pore and the hydrophobic membrane.
Several pLGIC receptors, notably the nicotinic acetylcholine receptor and the GABAA receptor (GABAAR), have long been important therapeutic targets, and the GlyR has recently emerged as a potential target for indications including inflammatory pain sensitization (10–12), opioid-induced breathing depression (13), tinnitus (14), and temporal lobe epilepsy (15). It is important to resolve the mechanisms by which the structure of pLGIC receptors changes between the closed and open states to design new drugs that bias the receptor toward the desired conformation.
Human hereditary hyperekplexia (or startle disease) is most commonly caused by missense or nonsense mutations that disrupt the function of the α1 GlyR subunit (16, 17). Analysis of the effects of hyperekplexia mutations have provided several important insights into GlyR structure and function (2). We recently characterized two new hyperekplexia mutations, Q226E and V280M, that each resulted in spontaneous activity in both α1 homomeric and α1β heteromeric GlyRs.3 Gln-226 is located near the top of TM1, whereas Val-280 is located in the extracellular TM2-TM3 loop. Both sites are thus located near the ECD-TMD interface where agonist-induced conformational changes are transduced, via the movement of TM2 α-helices, into channel opening (6–9). In this study, we employed a variety of functional approaches to elucidate the molecular mechanisms by which the Q226E and V280M mutations induce spontaneous channel openings with the aim of characterizing TMD movements underlying channel activation.
EXPERIMENTAL PROCEDURES
Molecular Biology
Mutations were introduced into the human α1 GlyR using the QuikChange site-directed mutagenesis kit (Stratagene) and confirmed by direct sequencing of the entire transgene-coding region.
Cell Culture
HEK AD293 cells were cultured in Dulbecco's modified Eagle's medium supplemented with 10% fetal bovine serum, 30 units/ml penicillin, and 30 μg/ml streptomycin; transiently transfected via the calcium-phosphate method with wild type and mutated cDNAs; and used in experiments 2–3 days after transfection.
Fluorescence-based Imaging
Experiments were performed on HEK AD293 cells, and the α1 GlyR and the YFP-I152L plasmid DNA were co-transfected in equal amounts. When the transfection was terminated 16 h later by rinsing with fresh culture medium, cells were plated into the wells of a 384-well plate. Within the following 24–32 h, the cell culture medium was replaced by an extracellular control solution (140 mm NaCl, 5 mm KCl, 2 mm CaCl2, 1 mm MgCl2, 10 mm HEPES, and 10 mm glucose, pH 7.4). Cells were imaged using YFP-I152L fluorescence quench as an indicator of the anion influx rate (19). Fluorescence images of each well were obtained twice: once before and once after the application of a sodium iodide solution (140 mm NaI, 5 mm KCl, 2 mm CaCl2, 1 mm MgCl2, 10 mm HEPES, and 10 mm glucose, pH 7.4) containing defined concentrations of glycine. Mean percentage quench values represent data averaged from three experiments carried out on different plates. Each experimental value was an average of the percentage quench of all fluorescent cells in three wells on the same plate, with each well containing >200 cells.
Electrophysiology
Glycine-gated currents were measured in HEK AD293 cells transfected as described above by whole cell patch clamp electrophysiology at −40 mV. Alternatively, single-channel currents were recorded from outside-out excised patches. During experiments, cells were continually superfused with the extracellular control solution as detailed above. Patch pipettes were pulled to a tip resistance of 1–4 mΩ (whole cell) or 6–12 mΩ (outside-out) when filled with a standard internal solution (145 mm CsCl, 2 mm CaCl2, 2 mm MgCl2, 10 mm HEPES, 10 mm EGTA, pH 7.4). Using an Axon MultiClamp 700B amplifier (Molecular Devices), whole cell currents were filtered at 1 kHz and digitized at 2 kHz, whereas single-channel currents were filtered at 2 kHz and digitized at 5 kHz. Voltage clamp fluorometry experiments were performed as previously described (20). Briefly, oocytes were removed from the ovaries of Xenopus laevis frogs, incubated in OR-2 (82.5 mm NaCl, 2 mm KCl, 1 mm MgCl2, 5 mm HEPES, pH 7.4) containing 1.5 mg/ml collagenase for 2 h at room temperature on a shaker, and injected with 10 ng of RNA generated form wild type or mutated human α1 GlyR. All constructs contained the functionally silent C41A mutation (21). The oocytes were cultured for 2–3 days at 18 °C in ND96 (96 mm NaCl, 2 mm KCl, 1 mm MgCl2, 1.8 mm CaCl2, 5 mm HEPES, pH 7.4) containing 275 mg/liter sodium pyruvate, 110 mg/liter theophylline, and 0.1% (v/v) gentamicin. For labeling, the oocytes were incubated with 10 μm sulforhodamine methanethiosulfonate (MTSR) diluted in ND96 for 1 min on ice. 3 mm KCl was used as internal solution, and recordings were performed at −40 mV.
Statistical Analysis
EC50, nH, and Imax or Fmax values for glycine-induced activation of current and fluorescence were obtained using the Hill equation fitted with a nonlinear least squares algorithm (SigmaPlot 12.0). All results are expressed as means ± S.E. of three or more independent experiments, and statistical analysis was performed using one-way ANOVA followed by post hoc test or Student's paired t test, as appropriate, with significance at p < 0.05.
Western Blotting
HEK AD293 cells transfected as described above were lysed 2 days after transfection with a sample buffer containing 2% sodium dodecyl sulfate (w/v), 10% glycerol (v/v), and 0.1 m Tris, pH 6.8. To break potential disulfide bonds, whole cell lysates were treated with 100 mm DTT. After SDS-PAGE and Western blotting, proteins were detected with rabbit anti-GlyR α1 primary antibody (Millipore; 1:3,000) and subsequently with a goat anti-rabbit horseradish peroxidase-conjugated secondary antibody (Santa Cruz Biotechnology; 1:50,000). All experiments were replicated at least three times.
RESULTS
Identification of Residues Interacting with Gln-226 and Val-280
The crystal structure of the Caenorhabditis elegans α glutamate-gated chloride channel receptor (GluClR) has recently been determined in the open state (22). Because it shares a 34% amino acid sequence identity with the α1 GlyR, it provides the highest homology structural template available for identifying candidate residues that may interact with Gln-226 and Val-280. The α GluClR residues Gln-219 and Asn-264 (which correspond to Gln-226 and Arg-271 in the α1 GlyR) are closely apposed across the subunit interface, where their α carbon (Cα) atoms are separated by a distance of 8.3 Å (Fig. 1A). Residues corresponding to both Gln-226 and Arg-271 are highly conserved in GABAARs and GlyRs (Fig. 1C), and their close apposition suggests that an energetic interaction, possibly an H-bond, may exist between them in the open state. The GluClR structure reveals that residues Leu-218 and Ile-273 (which correspond to Ile-225 and Val-280 in the α1 GlyR) are also apposed across the subunit interface, with Cα-Cα separation of 8.9 Å (Fig. 1B). These residues are also highly conserved in anionic pLGICs (Fig. 1C), with their chemical properties suggesting the existence of a hydrophobic interaction between them.
FIGURE 1.

Location of residues hypothesized to interact with the α1 GlyR residues, Gln-226 and Val-280. A, model of the C. elegans α GluClR (Protein Data Bank code 3RIF) showing two neighboring subunits (colored light and dark gray, respectively), with residues homologous to α1 GlyR Gln-226 and Arg-271 colored light and dark purple, respectively. The lower panel shows the view toward the membrane from the extracellular space with the ECD removed. B, same structure and orientations as in A, but with residues homologous to α1 GlyR Ile-225 and Val-280 colored light and dark blue, respectively. C, multiple sequence alignment of the TMD regions indicated pLGIC receptors with Gln-226 and Val-280 and their interacting residues colored as in A and B. D, model structures of ELIC (left; Protein Data Bank code 2VLO) and GLIC (right; Protein Data Bank code 3EAM) showing two neighboring subunits (colored light and dark gray, respectively) viewed toward the membrane from the extracellular space with the ECD removed. As in A and B, residues homologous to α1 GlyR Gln-226, Arg-271, Ile-225, and Val-280 are colored light and dark purple and light and dark blue, respectively.
To determine whether the relative orientations of these residue pairs are altered as the channel opens, we compared the distances between their respective Cα atoms in ELIC and GLIC, which are bacterial pLGICs crystallized in closed and open state conformations, respectively (23–25). The locations of the ELIC and GLIC residues corresponding to Ile-225, Gln-226, Arg-271, and Val-280 in the α1 GlyR are shown in Fig. 1D. In ELIC, the Cα-Cα separation of residues corresponding to Gln-226 and Arg-271 is 10.0 Å. In GLIC, this distance is reduced to 7.5 Å, similar to GluClR (8.3 Å), suggesting that Gln-226 and Arg-271 move closer together as the channel opens. On the other hand, the Cα-Cα separation of residues corresponding to Ile-225 and Val-280 is 7.6 Å in ELIC, 9.0 Å in GLIC, and 8.9 Å in GluClR, suggesting that their respective domains move apart when the channel opens. Because agonist binding signals are transmitted to the gate via movements applied to the external end of the TM α-helices (8, 9), we propose that the TMD reorientations as depicted in Fig. 1D may be responsible for initiating channel opening. This in turn prompts us to hypothesize that the Q226E mutation induces spontaneous activity via an increased electrostatic attraction to Arg-271, thus stabilizing the domains in a closely apposed conformation that would mimic the open state. We further hypothesize that the increased side chain volume of the V280M hyperekplexia mutation produces spontaneous activity by sterically repelling Ile-225 and thus also mimicking the open state conformational change.
Evidence for a Direct Interaction between Gln-226 and Arg-271
To test whether Gln-226 and Arg-271 physically interact, the following three mutations were made: Q226R, R271Q, and Q226R/R271Q. The R271Q mutation, which occurs naturally in human hyperekplexia, is known to drastically reduce both glycine sensitivity and single-channel conductance (26–29). If the Q226R mutation rescues the effects of R271Q by restoring side chain complementarity, we would propose that a physical interaction exists between the two residues. To assess the functional properties of these mutants, HEK AD293 cells were transfected with each construct in turn, and glycine dose-response relationships were quantitated by whole cell patch clamp electrophysiology. Fig. 2A shows sample dose-response recordings for the wild type and the three mutated constructs, and in Fig. 2B the normalized mean current amplitudes are plotted against the applied glycine concentration for each construct. The mean glycine EC50 values are presented in Fig. 2C, and all averaged curve fit parameters are summarized in Table 1. The glycine EC50 values for receptors incorporating Q226R or Q226R/R271Q were near 1.5 mm, whereas the EC50 value for R271Q GlyRs was near 12 mm, as previously shown (27). These results indicate that Q226R partially compensates for the reduced glycine sensitivity of R271Q. Further, GlyRs incorporating R271Q exhibited dramatically reduced maximal current amplitudes that were also compensated by the Q226R mutation (Fig. 2D and Table 1). Because the R271Q mutation reduces the dominant single-channel conductance state from ∼90 to 15 pS (26, 28), single-channel recordings of Q226R and Q226R/R271Q receptors were performed to evaluate whether the Q226R mutation can also compensate for the reduced conductance. Single-channel current-voltage relationships for receptors containing Q226R or Q226R/R271Q mutations revealed unitary conductances similar to those of α1 wild type GlyRs (Fig. 2, E and F). Because there was no significant difference in the single-channel conductance of receptors containing the wild type, Q226R or Q226R/R271Q subunits, we conclude that an arginine at Gln-226 can compensate for the drastically reduced conductance of the R271Q receptor. This compensation of both the glycine sensitivity and the single-channel conductance strongly suggests that these two residues lie in close proximity. To calculate the coupling energy between them, mutant cycle analysis was performed as described previously (30, 31) using the equation,
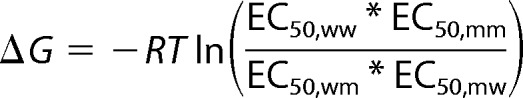 |
where ΔG is the coupling energy, R is the universal gas constant, T is temperature (K), EC50,ww is the wild type EC50 value, EC50,mm is the double mutant EC50 value, and EC50,mw and EC50,wm are the two single mutant EC50 values. This equation predicts the coupling energy between Gln-226 and Arg-271 to be 13.2 kJ mol−1. If the Asn-264 residue in the GluClR structure was substituted by an arginine, the distance between the polar oxygen group of Gln-219 and the positively charged nitrogen group of Arg-264 would be 7 Å. In comparison with interactions as assayed in other proteins (32), a coupling energy of 13.2 kJ mol−1 for residues lying 7 Å apart is high, indicating a strong attractive interaction between Gln-226 and Arg-271.
FIGURE 2.

Electrophysiological characterization of Q226R, R271Q, and Q226R/R271Q mutant α1 GlyRs. A, examples of currents activated by the indicated glycine concentrations for each receptor type. In this and subsequent figures, thin horizontal bars indicate the duration of glycine applications and numbers represent glycine concentration in μm. B, averaged normalized glycine dose-response relationships for the four receptors. C, mean glycine EC50 values. ***, p < 0.001 relative to α1 GlyR via one-way ANOVA followed by Dunnett's post hoc test. D, mean maximal glycine-mediated current amplitudes. **, p < 0.01 relative to α1 GlyR via one-way ANOVA followed by Dunnett's post hoc test. E, averaged single-channel current-voltage relationships for the indicated receptors recorded in outside-out patches. The wild type, Q226R, and Q226R/R271Q GlyRs exhibited mean single-channel conductance values of 92 ± 4 pS (n = 3), 99 ± 4 pS (n = 6), and 98 ± 3 pS (n = 6), respectively. These values were not significantly different from each other using one-way ANOVA followed by Tukey's post hoc test. The R271Q current-voltage relationship, shown previously to be 15 pS (26, 28), is indicated as a dashed line. F, sample single-channel activations in wild type, Q226R, and Q226R/R271Q GlyRs recorded at −80 mV. Channel openings are downward, with dashed lines denoting the main open conductance level. Channel amplitude histograms are also displayed. In this analysis we only included sections of recording in which the channel exhibited a stable transition from one conductance level to another. We did not include sections of record containing unresolved channel openings. Because the histograms reveal an absence of stable openings at subconductance levels, we infer that the brief openings of reduced magnitude were mostly unresolved larger amplitude events curtailed by filtering.
TABLE 1.
Properties of wild type and indicated mutant α1 GlyRs using whole cell patch clamp electrophysiology
| Whole cell patch clamp electrophysiology |
||||
|---|---|---|---|---|
| EC50 | nH | Imax | n | |
| μm | nA | |||
| α1a | 64 ± 8 | 3.8 ± 0.3 | 19 ± 3 | 10 |
| α1-Q226R | 1705 ± 334 | 1.3 ± 0.2d | 15 ± 5 | 6 |
| α1-R271Q | 12100 ± 4592b | 1.2 ± 0.1d | 2 ± 1c | 6 |
| α1-Q226R/R271Q | 1547 ± 145 | 2.1 ± 0.2b | 13 ± 2 | 6 |
| α1-Q226C | 5944 ± 2065c | 1.1 ± 0.1d | 16 ± 3 | 7 |
| α1-R271C | 8635 ± 2329b | 1.0 ± 0.1d | 3 ± 1c | 6 |
| α1-Q226C/R271C | 1657 ± 206 | 0.9 ± 0.0d | 5 ± 1c | 6 |
| α1-I225C | 54 ± 13 | 1.1 ± 0.1b | 27 ± 5 | 3 |
| α1-V280C | 26 ± 8 | 1.6 ± 0.5c | 18 ± 4 | 3 |
| α1-I225C/V280C | 496 ± 41d | 0.7 ± 0.1d | 1.4 ± 0.9c | 4 |
| Before DTT | ||||
| α1-K276C | 3047 ± 843d | 0.9 ± 0.0d | 1.0 ± 0.1c | 4 |
| α1-Q226E/K276C | 565 ± 30 | 1.6 ± 0.1d | 3 ± 1c | 5 |
| α1-K276C/V280M | 90 ± 10 | 1.7 ± 0.2d | 9 ± 2 | 5 |
| After DTT | ||||
| α1-K276C | 4530 ± 1362d | 1.1 ± 0.1d | 7 ± 3d | 5 |
| α1-Q226E/K276C | 525 ± 77 | 1.8 ± 0.2d | 1.0 ± 0.1c | 5 |
| α1-K276C/V280M | 144 ± 20 | 1.1 ± 0.1d | 9 ± 2 | 5 |
a Results for the wild type α1 GlyR were reproduced from Ref. 18.
b p < 0.001 relative to wild type α1 GlyR via one-way ANOVA followed by Dunnett's post hoc test.
c p < 0.01 relative to wild type α1 GlyR via one-way ANOVA followed by Dunnett's post hoc test.
d p < 0.0001 relative to wild type α1 GlyR via one-way ANOVA followed by Dunnett's post hoc test.
e p < 0.05 relative to wild type α1 GlyR via one-way ANOVA followed by Dunnett's post hoc test.
We next generated the Q226C, R271C, and Q226C/R271C mutant GlyRs to determine whether Gln-226 and Arg-271 lie sufficiently close together for disulfide trap to occur. Two cysteine residues can form a disulfide bridge if their Cα-Cα separation distance is not more than 6.5 Å (33). Although the Cα-Cα separation of 8.3 Å (based on the GluClR structure) is too large for cross-linking to occur, random thermal motions or glycine-mediated gating motions may be of sufficient magnitude for disulfide trap to occur. Of course, the mean Cα-Cα separation in α1 GlyRs may also be reduced. The first step was to quantitate the glycine EC50 values of the Q226C, R271C, and Q226C/R271C receptors. As shown in Fig. 3 (A and B) and summarized in Table 1, the glycine EC50 values of all three mutated receptors were increased relative to the wild type receptor. Interestingly, the glycine sensitivity for Q226C/R271C receptors was less reduced than for receptors containing the single mutations Q226C or R271C. Using the above equation, the coupling energy between the respective residues was calculated to be 15.3 kJ mol−1, confirming the strong energetic interaction as reported above.
FIGURE 3.

Electrophysiological and biochemical characterization of Q226C, R271C, and Q226C/R271C mutant α1 GlyRs. A, averaged normalized glycine dose-response relationships for the four receptors. B, mean glycine EC50 values. **, p < 0.01; ***, p < 0.001 relative to α1 GlyR via one-way ANOVA followed by Dunnett's post hoc test. C, examples of current traces activated by EC50 glycine (1.5 mm) in Q226C/R271C GlyRs. The first two traces in each row were recorded from a naïve cell. Subsequent traces were recorded following 1-min applications of 2 mm DTT or 0.3% H2O2 (together with EC50 glycine for the lower trace) as indicated. Averaged results are presented in the text. D, Western blot of wild type, Q226C, R271C, and Q226C/R271C mutant α1 GlyRs in the absence and presence of 100 mm DTT as indicated. A protein preparation from untransfected cells is included as a control. The numbers on the left represent size in kDa. Similar results were obtained in blots performed on three separate protein preparations.
To probe for disulfide bond formation, we investigated the effects of an oxidizing and a reducing agent on the double mutant Q226C/R271C receptor. First, an EC50 (1.5 mm) glycine concentration was applied several times to establish a stable base line. Cells were then perfused with 2 mm DTT for 1 min followed by two glycine EC50 applications separated by 30 s. Following that, 0.3% H2O2 was applied for 1 min also followed by two glycine EC50 applications. A sample experiment is shown in Fig. 3C (upper trace). Although the initial DTT application significantly increased current to 116 ± 5% of control (n = 6 cells; p < 0.05 by paired t test), neither a subsequent H2O2 application (111 ± 8%) nor a second DTT application (114 ± 9%) exerted a significant effect on current magnitude. Because we propose that Gln-226 and Arg-271 are closer in the open state, the effect of oxidizing and reducing agents on the current amplitude was also tested in the presence of EC50 glycine. Therefore the oxidizing agent H2O2 was applied together with an EC50 glycine to simulate the open state in which cross-linking might occur. However, as shown in Fig. 3C (lower trace), no significant effect relative to the initial control current was observed after the application of DTT (91 ± 6%, n = 5 cells) and H2O2 containing EC50 glycine (93 ± 5%), as well as after a second application of DTT (101 ± 13%). From this, we conclude that either no cross-links were formed or that the applied agents could not access a preformed disulfide bond. We thus employed Western blotting to probe directly for dimer formation. Surprisingly, both the Q226C and R271C single mutant GlyRs formed subunit dimers that were reduced by DTT (Fig. 3D). The double mutant Q226C/R271C GlyR formed not only dimers but also tetrameric or pentameric aggregates that were relatively resistant to reduction by DTT. As discussed in detail below, these data do not provide unequivocal evidence for dimer formation in assembled Q226C/R271C GlyRs.
Evidence for a Direct Interaction between Val-280 and Ile-225
The V280M mutant GlyR also exhibits a high level of spontaneous channel activity.3 Because valine and methionine are both hydrophobic but methionine is larger, we hypothesized that the spontaneous activity arises from a steric repulsion between Val-280 and Ile-225 of the adjacent subunit (Fig. 1). To test whether the level of spontaneous activity is dependent on the volume of the side chain, we mutated Val-280 in turn to the hydrophobic amino acids, alanine, leucine, and tryptophan. The side chain volume in water per residue is 78.9 Å3 for valine, 103.2 Å3 for methionine, 28.9 Å3 for alanine, 107.0 Å3 for leucine, and 167.3 Å3 for tryptophan. HEK AD293 cells were transfected with each mutant construct in turn, and a yellow fluorescent protein anion influx assay (19) was employed to quantify the relative magnitudes of spontaneous anion influx in each mutated receptor. The fluorescence assay was necessary because the high level of spontaneous activity in V280L and V280W mutant GlyRs meant that it was difficult to achieve stable electrophysiological recordings. In these experiments, cells were bathed initially in NaCl solution, and the percentage reduction in quench was quantitated upon replacement of the control NaCl solution with NaI solution plus or minus glycine. Because YFP-I152L is quenched by iodide but not by chloride ions (19), potent quench by iodide in the absence of glycine indicates spontaneously active channels. In Fig. 4A, the fluorescence quench was plotted against the applied glycine concentration. For wild type receptors, the glycine EC50 and the maximal fluorescence quench values (expressed as a percentage of control fluorescence) were 16.9 ± 3.0 μm and 48 ± 1%, respectively, whereas the corresponding values for V280A receptors were 5.6 ± 1.7 μm and 40 ± 1%, respectively. The V280A GlyR showed no evidence of spontaneous activity, and the glycine sensitivity of these receptors was similar to that previously demonstrated using electrophysiology (34). We thus infer that a small hydrophobic substitution at position 280 does not induce spontaneous activity. In contrast, receptors incorporating V280M, V280L, or V280W mutations exhibited a strong quench upon the addition of glycine-free NaI solution with a magnitude that was proportional to side chain volume (Fig. 4B). We hence conclude that the level of spontaneous activity is proportional to side chain volume at position 280.
FIGURE 4.
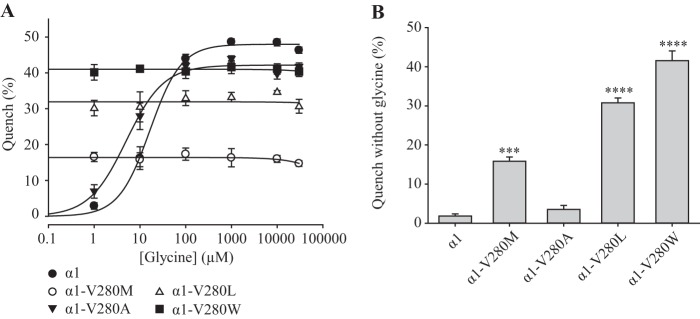
Functional characterization of α1 GlyRs incorporating mutations at Val-280. A, glycine dependence of fluorescent quench for the wild type, V280M, V280A, V280L, and V280W mutant GlyRs using the YFP-I152L anion influx assay. The percentage quench is equal to (1 − final fluorescence/control fluorescence) × 100%. All displayed data points represent the average quench from three experiments with three wells each and >200 cells/well. B, mean percentage quench in the absence of glycine for the indicated receptors. ***, p < 0.001; ****, p < 0.0001 relative to α1 GlyR via one-way ANOVA followed by Dunnett's post hoc test.
To test whether Ile-225 and Val-280 interact, we generated the single mutant I225C and V280C receptors and the double-mutant I225C/V280C receptor. Using whole cell patch clamp electrophysiology, we found that the glycine sensitivity of receptors incorporating I225C or V280C mutations was modestly increased (Fig. 5, A–C, and Table 1). In contrast, the glycine sensitivity of I225C/V280C receptors was significantly reduced, resulting in a coupling energy of −7.7 kJ mol−1 between the two side chains. Because the Cα-Cα separation of residues corresponding to Ile-225 and Val-280 is 9 Å in the GluClR structure, this energy value can be considered as very high relative to the coupling energy for other residue pairs (32).
FIGURE 5.

Electrophysiological characterization of I225C, V280C and I225C/V280C mutant α1 GlyRs. A, examples of currents activated by indicated glycine concentrations for each receptor type. B, averaged normalized glycine dose-response relationships for wild type and indicated mutant receptors. C, mean glycine EC50 values. ****, p < 0.0001 relative to α1 GlyR via one-way ANOVA followed by Dunnett's post hoc test. D, sample trace for V280C mutant α1 GlyRs showing the maximal glycine-induced current amplitude and the inhibition of the leak current by 100 μm picrotoxin. E, magnitude of picrotoxin-inhibited current expressed as a percentage to the maximal glycine-gated current amplitude. *, p < 0.05; ***, p < 0.001 relative to α1 GlyR via one-way ANOVA followed by Dunnett's post hoc test. PTX, picrotoxin.
To determine whether any of the cysteine mutant GlyRs exhibited spontaneous channel activity, we quantitated the relative magnitudes of the current inhibited by 100 μm picrotoxin as a percentage of the current activated by saturating (10 mm) glycine in the same cell. A sample experiment for the V280C mutant GlyR, revealing a large spontaneous current, is shown in Fig. 5D. The results averaged for the I225C, V280C, and I225C/V280C mutant GlyRs are summarized in Fig. 5E. We propose that the large leak current in the V280C mutant GlyR can be explained by the disruption of a hydrophobic bond that helps to maintain the close separation between these residues in the closed state.
We next investigated the possibility of disulfide bond formation between I225C and V280C. We applied DTT and H2O2 as previously described while monitoring the magnitude of 100 μm glycine-gated currents. The mean current magnitude changes expressed as percentages of the original control current magnitude were as follows: after first DTT application, 106 ± 16%; after subsequent H2O2 application, 94 ± 27%; and after second DTT application, 97 ± 31%. All results were averaged from the same six cells and revealed no significant differences in current magnitude (p > 0.05 by paired t test). A Western blot also showed no evidence for dimer formation. We thus infer that I225C and V280C interact energetically but do not form a disulfide bond (data not shown).
Effects of Q226E and V280M on TM2-TM3 Loop Conformation
Glycine-induced conformational changes are transmitted from the glycine-binding site to the gate via conformational changes in the TM2-TM3 domain (8, 9, 34). To determine the effect of Q226E and V280M mutations on TM2-TM3 conformation and vice versa, we next employed K276C receptors. Lys-276 is located in the TM2-TM3 loop, and it has previously been shown that cysteines introduced at the position corresponding to Lys-276 in GABAAR β2 subunits are able to efficiently cross-link neighboring β2 subunits in α1β2 GABAARs (35). Our first approach involved determining whether K276C residues could also cross-link in α1 GlyRs and, if so, whether these cross-links could be disrupted by the Q226E or V280M mutations. We thus generated the K276C single mutant GlyR and the Q226E/K276C and K276C/V280M double mutant GlyRs. These constructs were transfected into HEK AD293 cells, and whole cell glycine dose-response relationships were determined. For receptors containing K276C, the glycine sensitivity was dramatically reduced (Fig. 6A and Table 1) as previously described (21). In contrast, for receptors containing Q226E/K276C or K276C/V280M, the sensitivity to glycine was only modestly reduced to 500 and 90 μm, respectively. Glycine dose-response recordings were also performed after the application of 2 mm DTT for 1 min; however, no significant changes in the glycine sensitivity were detected (Fig. 6A and Table 1). Interestingly, the current amplitude for K276C receptors was significantly increased after the application of DTT (Table 1). We also probed the three receptors for spontaneous channel activity using the method as described above (Fig. 5, D and E). No inhibitory effect of picrotoxin was observed in Q226E/K276C GlyRs (n = 4 cells). In contrast, picrotoxin inhibited 2.5 ± 0.6% (n = 4 cells) of the saturating glycine-activatable current in K276C/V280M GlyRs.
FIGURE 6.

Effects of Q226E and V280M on GlyR dimerization via K276C cross-links. A, averaged normalized glycine dose-response relationships for wild type and indicated mutant receptors before and after the application of 2 mm DTT. B, sample current recordings of K276C, Q226E/K276C, and K276C/V280M GlyRs activated by EC50 glycine (3,000, 500, and 90 μm, respectively). The first two traces were recorded from a naïve cell. Subsequent traces were recorded following 1-min applications of 2 mm DTT or 0.3% H2O2 as indicated. C, normalized glycine EC50 current amplitudes of K276C, Q226E/K276C, and K276C/V280M GlyRs before and after the application of DTT and H2O2. The normalized currents are represented as percentages. p values were calculated relative to the control current with a paired t test. *, p < 0.05. D, Western blot of wild type, Q226C, R271C, and Q226C/R271C mutant α1 GlyRs in the absence and presence of 100 mm DTT as indicated. A protein preparation from untransfected cells is included as a control. The numbers on the left represent size in kDa. Similar results were obtained in blots performed on three separate protein preparations.
To probe for disulfide bond formation, 2 mm DTT and 0.3% H2O2 were applied alternately for 1 min each, as described above, whereas the magnitude of currents activated by EC50 glycine (3,000 μm for K276C, 500 μm for Q226E/K276C, and 90 μm for K276C/V280M) was monitored. In K276C mutant GlyRs, DTT significantly increased current magnitude, whereas H2O2 rapidly and irreversibly reduced current magnitude (Fig. 6, B and C), consistent with the formation and breakage of cross-links between adjacent subunits. However, the Q226E/K276C and K276C/V280M receptors showed no significant response to either DTT or H2O2 treatment, suggesting either that cross-link formation did not occur or that cross-links had preformed spontaneously and could not be reduced by DTT.
To resolve between these possibilities, we performed a Western blot analysis on the wild type and all three mutated constructs (Fig. 6D). Compared with α1 wild type receptors that did not form dimers, all mutant receptors exhibited a similar incidence of dimer formation that was reversed by DTT. Our results are consistent with a model whereby the reduction of cross-links in K276C GlyRs enhances TM2-TM3 loop flexibility and leads to more efficacious glycine-induced activation. In contrast, cross-link reduction does not enhance glycine-induced current magnitudes in either of the double mutant GlyRs. We infer that the Q226E and V280M mutations position the TM α-helices into a conformation that is already highly conductive to efficacious glycine-induced activation. In such a scenario, breakage of the disulfide bonds would exert no additional enhancement of glycine efficacy and thus exert no effect on glycine-gated current magnitudes.
The effects of Q226E and V280M mutations on conformational changes near Arg-271 were quantitated using voltage clamp fluorometry (36). In this technique, a sulfhydryl-tagged fluorophore (often a rhodamine derivative) is covalently attached to a cysteine introduced into a receptor domain of interest. Because rhodamine fluorescence exhibits an increase in quantum efficiency as the hydrophobicity of its environment is increased, glycine-induced changes in fluorescence intensity can be interpreted as local conformational changes. These experiments were carried out in Xenopus oocytes because the detection of small glycine-induced fluorescence changes is not routinely possible in HEK AD293 cell-expressed receptors.
Previously, we reported that MTSR, when covalently attached to R271C in TM2 of the homomeric α1 GlyR, exhibited an increase in fluorescence intensity upon glycine binding (20). Because the glycine concentration-response relationships for current and fluorescence were overlapping, we concluded that conformational changes at the channel gate (as reported by the current response) were tightly coupled with conformational changes near Arg-271 (as reported by the fluorescence response). Because we sought to investigate the effect of the Q226E and V280M mutations on these glycine-induced fluorescence changes, we compared current and fluorescence responses in the R271C single mutant GlyR and the Q226E/R271C and R271C/V280M double mutant GlyRs. Averaged glycine current dose-response relationships for unlabeled and MTSR-labeled R271C mutant GlyRs are shown in Fig. 7A, with mean glycine EC50, nH, and Imax/Fmax values summarized in Table 2. As previously demonstrated, the glycine fluorescence dose-response in the MTSR-labeled GlyR overlapped with the current dose-response.
FIGURE 7.

Effects of Q226E and V280M on conformational changes near TM2 as determined by voltage clamp fluorometry. A–C, averaged normalized glycine dose-response relationships for both current (black triangles) and fluorescence (red triangles) at MTSR-labeled R271C, Q226E/R271C, and R271C/V280M GlyRs using voltage clamp fluorometry. Current dose-response relationships for unlabeled receptors are also shown (black circles). Mean parameters of best fit to individual dose-response relations are presented in Table 2. D, examples of simultaneous current (black) and fluorescence (red) recordings from oocytes expressing labeled R271C GlyRs (upper traces) and R271C/V280M GlyRs (lower traces).
TABLE 2.
Properties of wild type and indicated mutant α1 GlyRs using voltage clamp fluorometry
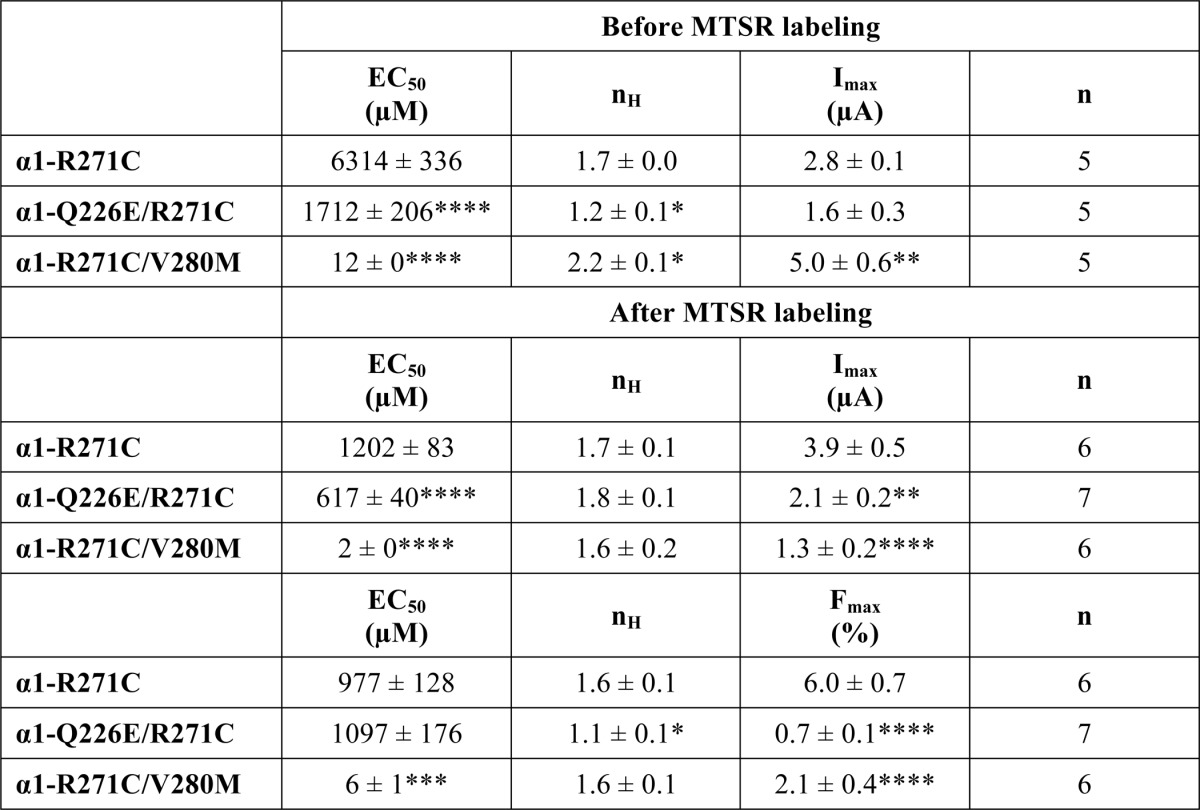
*, p < 0.05; **, p < 0.01; ***, p < 0.001; ****, p < 0.0001 relative to R271C mutant α1 GlyR via one-way ANOVA followed by Dunnett's post hoc test.
This experimental approach was repeated on Q226E/R271C and R271C/V280M mutant GlyRs. The glycine EC50 for unlabeled Q226E/R271C GlyRs was near 1,700 μm (Fig. 7B and Table 2). In MTSR-labeled Q226E/R271C GlyRs, the current EC50 was near 600 μm, and the fluorescence EC50 was significantly higher at ∼1,000 μm. For R271C/V280M receptors, the glycine EC50 was dramatically reduced because of the presence of V280M. The glycine EC50 for unlabeled receptors was 12 μm, and for MTSR-labeled receptors, the current EC50 was 2 μm, and the fluorescence EC50 was significantly higher at 6 μm (Fig. 6C and Table 2). These results indicate that the hyperekplexia mutations uncouple conformational changes at the channel gate from conformational changes occurring near to Arg-271.
Finally, the effect of the pore blocker picrotoxin was tested on all three receptors to confirm whether spontaneous activity was present in the double mutant GlyRs. For R271C/V280M GlyRs, the application of 100 μm picrotoxin blocked a leak current that corresponded to 68 ± 21% of the saturating (30 mm) glycine-activatable current. However, no significant change in base-line current was detected for receptors containing R271C or Q226E/R271C GlyRs (n = 4 for each receptor). For all three receptors, no change in fluorescence was detected upon the application of picrotoxin, suggesting that the environment of residue Arg-271 does not change when picrotoxin blocks the pore.
DISCUSSION
The Interaction between Gln-226 and Arg-271
Because the Cα-Cα separation of Gln-226 and Arg-271 is predicted to reduce from 10 to ∼8 Å as the channel opens (Fig. 1), we hypothesized that the spontaneous activity induced by Q226E was due to an enhanced electrostatic attraction to Arg-271. To test this, we introduced a positive charge at Gln-226 via the Q226R mutation. Separately, we also eliminated the positive charge at Arg-271 via the R271Q mutation. Both mutations dramatically reduced glycine sensitivity, consistent with our hypothesis. However, the double Q226R/R271Q mutant GlyR largely restored glycine sensitivity, with mutant cycle analysis demonstrating a strong energetic attraction between the two residues. This result provides strong support for our hypothesis.
The positive charge at Arg-271 enhances the GlyR single-channel conductance via a direct electrostatic interaction with the permeating anions (18), thus explaining why the R271Q human hyperekplexia mutation drastically reduces single-channel conductance (26, 28). This reduction in conductance was entirely reversed by inserting the positive charge at Gln-226 in the Q226R/R271Q double mutant GlyR (Fig. 2, E and F). Although this does not provide evidence for an energetic interaction between Gln-226 and Arg-271, it does suggest that the two residues are located in sufficiently close proximity that the removal of a positive charge from one site can be compensated by the addition of a positive charge to the other.
Our attempt to demonstrate proximity between Gln-226 and Arg-271 via cysteine trapping yielded equivocal results. Although we demonstrated a strong energetic coupling between Q226C and R271C via mutant cycle analysis, we found that oxidizing and reducing agents had no significant effect on glycine-activated current magnitudes. Western blotting showed that Q226C/R271C double mutant GlyRs could indeed form dimer complexes, as predicted. However, because single mutant Q226C or R271C GlyRs could also form dimers and Q226C/R271C GlyRs could form pentameric or tetrameric subunit aggregates, we could not rule out the possibility of other mechanisms contributing to subunit aggregation.
We conclude that GlyRs can be activated directly by increasing an electrostatic attraction between Gln-226 at the top of TM1 and Arg-271 at the top of TM2 of the neighboring subunit. In wild type GlyRs, the formation of an H-bond between Gln-226 and Arg-271 may help stabilize the glycine-induced open state. When taken together with the crystal structure information (Fig. 1), we propose that this enhanced attraction would tilt the outer end of TM2 away from the pore axis, resulting in pore opening.
The Interaction between Val-280 and Ile-225
Comparison of closed and open state pLGIC structures suggests that the Cα-Cα separation of Val-280 and Ile-225 increases from 7.6 to ∼9 Å as the channel opens (Fig. 1). We therefore hypothesized that the spontaneous activity in the V280M mutant GlyR was due to the larger methionine side chain exerting a steric repulsion from Ile-225. This would increase the separation of TM1 and TM3 and thus mimic the closed to open state structural change. To test this hypothesis, we introduced progressively larger hydrophobic side chains at Val-280 and monitored both glycine sensitivity and the mean level of spontaneous channel activity. We found that larger side chains did indeed induce higher levels of spontaneous activity, consistent with our hypothesis. Although our attempts to demonstrate proximity between Val-280 and Ile-225 via cysteine trapping were unsuccessful, we did demonstrate a significant energetic coupling between V280C and I225C via mutant cycle analysis. In this case, the individual cysteine mutations had little effect on the glycine EC50 value, but the double cysteine mutant receptor exhibited dramatically reduced glycine sensitivity. This suggests that the double cysteine substitution (I225C/V280C) may have increased the space available for the respective domain backbones to move closer together, stabilizing the closed state.
The V280C mutant GlyR exhibited a leak current that was larger than may be expected because of its side chain volume (Fig. 5D). This can be explained by the disruption of a putative hydrophobic bond that helps to maintain the close apposition between Val-280 and Ile-225 in the closed state.
A comparison of GLIC versus ELIC structures reveals that during channel opening, the top of the TM1 does not move, although the top of TM3 moves radially outwards from the pore in parallel with TM2 (7, 23, 25). When taken in conjunction with our functional evidence, we propose that increasing the side chain volume at Val-280 tilts the top of TM3 radially outwards against the stationary TM1 of the adjacent subunit, thus providing space for TM2 to relax away from the pore axis to create an open channel. Consistent with this mechanism, ivermectin is also thought to open the GluClR by directly spreading TM1 and TM3 (22).
Effects of Mutations on Subunits Dimerized via K276C Cross-links
Two findings prompted us to conclude that GlyR α1 subunits dimerize via disulfide bonds between their respective K276C residues. First, current magnitude in K276C mutant GlyRs was dramatically increased by a reducing agent and irreversibly reduced by an oxidizing agent. Second, dimer formation was directly demonstrated by Western blotting. These results are consistent with a previous study on α1β2 GABAARs where β2 subunits were shown to dimerize via cross-links between TM2-TM3 loop residues corresponding to K276C (35). Cα-Cα separation must usually be <6 Å for disulfide bond formation to occur (33). In the ELIC, GLIC, and α GluClR crystal structures, the Cα-Cα separation of residues corresponding to Lys-276 in adjacent subunits is 20–24 Å (22–25). Given this large distance, dimerization via K276C cross-links provides evidence for exceptionally large thermal motions in the TM2-TM3 loop of α1 subunits. We cannot rule out the possibility of dimer formation between nonadjacent subunits, but this would implicate an even greater Cα-Cα separation.
Our results are consistent with a model whereby the reduction of cross-links in K276C GlyRs enhances TM2-TM3 loop flexibility and thereby leads to more efficacious glycine-induced activation. Given that a maximum of two dimer pairs can exist per receptor, it is clear that at least one (and possibly both) cross-links must be reduced for maximally efficacious receptor activation. However, the reduction of K276C cross-links did not enhance glycine-induced current magnitudes in Q226E/K276C or K276C/V280M double mutant GlyRs. We therefore infer that Q226E or V280M mutations configure the GlyR TMD into a conformation conducive to maximally efficacious glycine-induced activation. In such a scenario, the increased flexibility in the TM2-TM3 loop induced by reduction of the disulfide bonds would exert no additional effect on glycine-gated current magnitudes.
Conclusion
We have described how the hyperekplexia mutations, Q226E and V280M, induce spontaneous GlyR activation. The mechanism we propose is consistent with the structural differences evident in the x-ray atomic structures of closed and open state pLGICs, suggesting that it may be broadly applicable across the eukaryotic pLGIC receptor family. In addition, a specific prediction of our study is that an H-bond between Gln-226 in TM1 and Arg-271 in TM2 in the neighboring subunit is necessary for stabilizing the GlyR in the open state.
Acknowledgment
We thank Dr. Qian Wang for help with the voltage clamp fluorometry experiments.
This work was supported by the National Health and Medical Research Council of Australia and the Australian Research Council.
Bode, A., Wood, S.-E., Mullins, J. G., Keramidas, A., Cushion, T. D., Thomas, R. H., Pickrell, W. O., Drew, C. J., Masri, A., Jones, E. A., Vassallo, G., Born, A. P., Alehan, F., Aharoni, S., Bannasch, G., Bartsch, M., Kara, B., Krause, A., Karam, E. G., Matta, S., Jain, V., Mandel, H., Freilinger, M., Graham, G. E., Hobson, E., Chatfield, S., Vincent-Delorme, C., Rahme, J. E., Afawi, Z., Berkovic, S. F., Howell, O. W., Vanbellinghen, J.-F., Rees, M. I., Chung, S.-K., and Lynch, J. W. (2013) New Hyperekplexia Mutations Provide Insight into Glycine Receptor Assembly, Trafficking, and Activation Mechanisms. J. Biol. Chem. 288, 33745–33759.
- GlyR
- glycine receptor
- Cα
- α-carbon atom
- ECD
- extracellular domain
- GABAAR
- GABAA receptor
- GluClR
- glutamate-gated chloride channel receptor
- MTSR
- methanethiosulfonate rhodamine
- pLGIC
- pentameric ligand-gated ion channel
- TM
- transmembrane
- TMD
- transmembrane domain
- ANOVA
- analysis of variance.
REFERENCES
- 1. Dutertre S., Becker C. M., Betz H. (2012) Inhibitory glycine receptors. An update. J. Biol. Chem. 287, 40216–40223 [DOI] [PMC free article] [PubMed] [Google Scholar]
- 2. Lynch J. W. (2004) Molecular structure and function of the glycine receptor chloride channel. Physiol. Rev. 84, 1051–1095 [DOI] [PubMed] [Google Scholar]
- 3. Lynch J. W. (2009) Native glycine receptor subtypes and their physiological roles. Neuropharmacology 56, 303–309 [DOI] [PubMed] [Google Scholar]
- 4. Fritschy J. M., Harvey R. J., Schwarz G. (2008) Gephyrin. Where do we stand, where do we go? Trend. Neurosci. 31, 257–264 [DOI] [PubMed] [Google Scholar]
- 5. Specht C. G., Izeddin I., Rodriguez P. C., El Beheiry M., Rostaing P., Darzacq X., Dahan M., Triller A. (2013) Quantitative nanoscopy of inhibitory synapses. Counting gephyrin molecules and receptor binding sites. Neuron 79, 308–321 [DOI] [PubMed] [Google Scholar]
- 6. Cederholm J. M., Schofield P. R., Lewis T. M. (2009) Gating mechanisms in Cys-loop receptors. Eur. Biophys. J. 39, 37–49 [DOI] [PubMed] [Google Scholar]
- 7. Corringer P. J., Baaden M., Bocquet N., Delarue M., Dufresne V., Nury H., Prevost M., Van Renterghem C. (2010) Atomic structure and dynamics of pentameric ligand-gated ion channels. New insight from bacterial homologues. J. Physiol. 588, 565–572 [DOI] [PMC free article] [PubMed] [Google Scholar]
- 8. Corringer P. J., Poitevin F., Prevost M. S., Sauguet L., Delarue M., Changeux J. P. (2012) Structure and pharmacology of pentameric receptor channels. From bacteria to brain. Structure 20, 941–956 [DOI] [PubMed] [Google Scholar]
- 9. Miller P. S., Smart T. G. (2010) Binding, activation and modulation of Cys-loop receptors. Trends Pharmacol. Sci. 31, 161–174 [DOI] [PubMed] [Google Scholar]
- 10. Harvey R. J., Depner U. B., Wässle H., Ahmadi S., Heindl C., Reinold H., Smart T. G., Harvey K., Schütz B., Abo-Salem O. M., Zimmer A., Poisbeau P., Welzl H., Wolfer D. P., Betz H., Zeilhofer H. U., Müller U. (2004) GlyR α3. An essential target for spinal PGE2-mediated inflammatory pain sensitization. Science 304, 884–887 [DOI] [PubMed] [Google Scholar]
- 11. Xiong W., Cui T., Cheng K., Yang F., Chen S. R., Willenbring D., Guan Y., Pan H. L., Ren K., Xu Y., Zhang L. (2012) Cannabinoids suppress inflammatory and neuropathic pain by targeting α3 glycine receptors. J. Exp. Med. 209, 1121–1134 [DOI] [PMC free article] [PubMed] [Google Scholar]
- 12. Zeilhofer H. U. (2005) The glycinergic control of spinal pain processing. Cell Mol. Life Sci. 62, 2027–2035 [DOI] [PMC free article] [PubMed] [Google Scholar]
- 13. Manzke T., Niebert M., Koch U. R., Caley A., Vogelgesang S., Hülsmann S., Ponimaskin E., Müller U., Smart T. G., Harvey R. J., Richter D. W. (2010) Serotonin receptor 1A-modulated phosphorylation of glycine receptor α3 controls breathing in mice. J. Clin. Invest. 120, 4118–4128 [DOI] [PMC free article] [PubMed] [Google Scholar]
- 14. Richardson B. D., Brozoski T. J., Ling L. L., Caspary D. M. (2012) Targeting inhibitory neurotransmission in tinnitus. Brain Res. 1485, 77–87 [DOI] [PMC free article] [PubMed] [Google Scholar]
- 15. Eichler S. A., Kirischuk S., Jüttner R., Schaefermeier P. K., Legendre P., Lehmann T. N., Gloveli T., Grantyn R., Meier J. C. (2008) Glycinergic tonic inhibition of hippocampal neurons with depolarizing GABAergic transmission elicits histopathological signs of temporal lobe epilepsy. J. Cell Mol. Med. 12, 2848–2866 [DOI] [PMC free article] [PubMed] [Google Scholar]
- 16. Chung S. K., Vanbellinghen J. F., Mullins J. G., Robinson A., Hantke J., Hammond C. L., Gilbert D. F., Freilinger M., Ryan M., Kruer M. C., Masri A., Gurses C., Ferrie C., Harvey K., Shiang R., Christodoulou J., Andermann F., Andermann E., Thomas R. H., Harvey R. J., Lynch J. W., Rees M. I. (2010) Pathophysiological mechanisms of dominant and recessive GLRA1 mutations in hyperekplexia. J. Neurosci. 30, 9612–9620 [DOI] [PMC free article] [PubMed] [Google Scholar]
- 17. Thomas R. H., Harvey R. J., Rees M. I. (2010) Hyperekplexia. Stiffness, startle and syncope. J. Pediat. Neurol. 8, 11–14 [Google Scholar]
- 18. Keramidas A., Moorhouse A. J., Schofield P. R., Barry P. H. (2004) Ligand-gated ion channels. Mechanisms underlying ion selectivity. Prog. Biophys. Mol. Biol. 86, 161–204 [DOI] [PubMed] [Google Scholar]
- 19. Kruger W., Gilbert D., Hawthorne R., Hryciw D. H., Frings S., Poronnik P., Lynch J. W. (2005) A yellow fluorescent protein-based assay for high-throughput screening of glycine and GABAA receptor chloride channels. Neurosci. Lett. 380, 340–345 [DOI] [PubMed] [Google Scholar]
- 20. Pless S. A., Dibas M. I., Lester H. A., Lynch J. W. (2007) Conformational variability of the glycine receptor M2 domain in response to activation by different agonists. J. Biol. Chem. 282, 36057–36067 [DOI] [PubMed] [Google Scholar]
- 21. Lynch J. W., Han N. L., Haddrill J., Pierce K. D., Schofield P. R. (2001) The surface accessibility of the glycine receptor M2-M3 loop is increased in the channel open state. J. Neurosci. 21, 2589–2599 [DOI] [PMC free article] [PubMed] [Google Scholar]
- 22. Hibbs R. E., Gouaux E. (2011) Principles of activation and permeation in an anion-selective Cys-loop receptor. Nature 474, 54–60 [DOI] [PMC free article] [PubMed] [Google Scholar]
- 23. Bocquet N., Nury H., Baaden M., Le Poupon C., Changeux J. P., Delarue M., Corringer P. J. (2009) X-ray structure of a pentameric ligand-gated ion channel in an apparently open conformation. Nature 457, 111–114 [DOI] [PubMed] [Google Scholar]
- 24. Hilf R. J., Dutzler R. (2008) X-ray structure of a prokaryotic pentameric ligand-gated ion channel. Nature 452, 375–379 [DOI] [PubMed] [Google Scholar]
- 25. Hilf R. J., Dutzler R. (2009) Structure of a potentially open state of a proton-activated pentameric ligand-gated ion channel. Nature 457, 115–118 [DOI] [PubMed] [Google Scholar]
- 26. Langosch D., Laube B., Rundström N., Schmieden V., Bormann J., Betz H. (1994) Decreased agonist affinity and chloride conductance of mutant glycine receptors associated with human hereditary hyperekplexia. EMBO J. 13, 4223–4228 [DOI] [PMC free article] [PubMed] [Google Scholar]
- 27. Rajendra S., Lynch J. W., Pierce K. D., French C. R., Barry P. H., Schofield P. R. (1994) Startle disease mutations reduce the agonist sensitivity of the human inhibitory glycine receptor. J. Biol. Chem. 269, 18739–18742 [PubMed] [Google Scholar]
- 28. Rajendra S., Lynch J. W., Pierce K. D., French C. R., Barry P. H., Schofield P. R. (1995) Mutation of an arginine residue in the human glycine receptor transforms β-alanine and taurine from agonists into competitive antagonists. Neuron 14, 169–175 [DOI] [PubMed] [Google Scholar]
- 29. Shiang R., Ryan S. G., Zhu Y. Z., Hahn A. F., O'Connell P., Wasmuth J. J. (1993) Mutations in the α1 subunit of the inhibitory glycine receptor cause the dominant neurologic disorder, hyperekplexia. Nat. Genet. 5, 351–358 [DOI] [PubMed] [Google Scholar]
- 30. Kash T. L., Jenkins A., Kelley J. C., Trudell J. R., Harrison N. L. (2003) Coupling of agonist binding to channel gating in the GABAA receptor. Nature 421, 272–275 [DOI] [PubMed] [Google Scholar]
- 31. Lee W. Y., Sine S. M. (2005) Principal pathway coupling agonist binding to channel gating in nicotinic receptors. Nature 438, 243–247 [DOI] [PubMed] [Google Scholar]
- 32. Schreiber G., Fersht A. R. (1995) Energetics of protein-protein interactions. Analysis of the barnase-barstar interface by single mutations and double mutant cycles. J. Mol. Biol. 248, 478–486 [DOI] [PubMed] [Google Scholar]
- 33. Thornton J. M. (1981) Disulphide bridges in globular proteins. J. Mol. Biol. 151, 261–287 [DOI] [PubMed] [Google Scholar]
- 34. Lynch J. W., Rajendra S., Pierce K. D., Handford C. A., Barry P. H., Schofield P. R. (1997) Identification of intracellular and extracellular domains mediating signal transduction in the inhibitory glycine receptor chloride channel. EMBO J. 16, 110–120 [DOI] [PMC free article] [PubMed] [Google Scholar]
- 35. Wang Q., Pless S. A., Lynch J. W. (2010) Ligand- and subunit-specific conformational changes in the ligand-binding domain and the TM2-TM3 linker of α1β2γ2 GABAA receptors. J. Biol. Chem. 285, 40373–40386 [DOI] [PMC free article] [PubMed] [Google Scholar]
- 36. Pless S. A., Lynch J. W. (2008) Illuminating the structure and function of Cys-loop receptors. Clin. Exp. Pharmacol. Physiol. 35, 1137–1142 [DOI] [PubMed] [Google Scholar]