Background: The organic anion-transporting polypeptide (OATP/Oatp) superfamily includes polyspecific transporters that transport amphipathic molecules across the cell membrane of eukaryotes.
Results: Zebrafish Oatp1d1 transports steroid hormones and has conserved structural features common to the OATP1/Oatp1 family.
Conclusion: Zebrafish Oatp1d1 is a functional ortholog of mammalian OATP1A/Oatp1a and OATP1B/Oatp1b.
Significance: The first characterization of zebrafish Oatp offers insight into the evolution of the OATP1/Oatp1 family and the physiological importance of Oatp1d1.
Keywords: Cell Metabolism; Membrane Proteins; Membrane Transport; Organic Anion Channels; Zebrafish; New Slco Transporter in zebrafish; New Slco Transporter in Zebrafish, Molecular Characterization
Abstract
The organic anion-transporting polypeptide (OATP/Oatp) superfamily includes a group of polyspecific transporters that mediate transport of large amphipathic, mostly anionic molecules across cell membranes of eukaryotes. OATPs/Oatps are involved in the disposition and elimination of numerous physiological and foreign compounds. However, in non-mammalian species, the functional properties of Oatps remain unknown. We aimed to elucidate the role of Oatp1d1 in zebrafish to gain insights into the functional and structural evolution of the OATP1/Oatp1 superfamily. We show that diversification of the OATP1/Oatp1 family occurs after the emergence of jawed fish and that the OATP1A/Oatp1a and OATP1B/Oatp1b subfamilies appeared at the root of tetrapods. The Oatp1d subfamily emerged in teleosts and is absent in tetrapods. The zebrafish Oatp1d1 is similar to mammalian OATP1A/Oatp1a and OATP1B/Oatp1b members, with the main physiological role in transport and balance of steroid hormones. Oatp1d1 activity is dependent upon pH gradient, which could indicate bicarbonate exchange as a mode of transport. Our analysis of evolutionary conservation and structural properties revealed that (i) His-79 in intracellular loop 3 is conserved within OATP1/Oatp1 family and is crucial for the transport activity; (ii) N-glycosylation impacts membrane targeting and is conserved within the OATP1/Oatp1 family with Asn-122, Asn-133, Asn-499, and Asn-512 residues involved; (iii) the evolutionarily conserved cholesterol recognition interaction amino acid consensus motif is important for membrane localization; and (iv) Oatp1d1 is present in dimeric and possibly oligomeric form in the cell membrane. In conclusion, we describe the first detailed characterization of a new Oatp transporter in zebrafish, offering important insights into the functional evolution of the OATP1/Oatp1 family and the physiological role of Oatp1d1.
Introduction
Organic anion-transporting polypeptides (OATPs2 in humans, Oatps in all other species; gene symbol SLCO/Slco) are a group of polyspecific transporters that mediate transport of large amphipathic molecules across cell membranes of eukaryotes. OATPs transport a wide range of endogenous (steroid hormones, bile salts, prostaglandins, etc.) and exogenous compounds (pharmaceuticals, natural toxins). The classification in mammals includes six families named OATP1–6/Oatp1–6. The OATP1 family in humans encompasses four genes: OATP1A2, OATP1B1, OATP1B3, and OATP1C1 (1). Ubiquitously expressed OATP1A2 mediates transport of physiologically important compounds, such as steroid and thyroid hormones, bilirubin, bile salts, and eicosanoids. Along with the role in the balance of hormones and bile salts, OATP1A2 has been shown to transport various pharmaceuticals. Given its ubiquitous distribution, it is probably important for the tissue-specific disposition, pharmacokinetics, and toxicity of xenobiotics (2). Unlike OATP1A2, OATP1B1 and OATP1B3 are liver-specific transporters with largely overlapping substrate range that includes steroid conjugates, bile salts, and bilirubin. However, their affinities for the same substrates can significantly differ (3). OATP1B1 and OATP1B3 have been studied extensively because they are largely responsible for the disposition of drugs (e.g. lipid-lowering agents and chemotherapeutics) and their subsequent elimination through bile. OATP1C1, unlike most OATPs, has a narrow substrate range that principally includes thyroid hormones: thyroxine (T4), triiodothyronine (T3), reverse triiodothyronine, and their sulfated conjugates. OATP1C1 is predominantly expressed at the blood brain barrier (4). Along with monocarboxylate transporters (MCT8 and MCT10), NTCP (sodium (Na)-taurocholate-cotransporting polypeptide), and l-amino transporters (LAT1 and LAT2), it is crucial for the balance of thyroid hormones in mammals (5).
The OATP/Oatp superfamily has been scarcely studied in non-mammalian vertebrates. Four Oatps were described in birds (chicken (Gallus gallus) and quail (Coturnix japonica) (6)), and one Oatp1-like protein has been described in a cartilaginous fish, the little skate (Raja erinacea) (7). However, a detailed functional analysis of non-mammalian Oatps is lacking. We have previously shown that teleost fish lack Oatp1a and Oatp1b subfamilies but express the evolutionarily distinct Oatp1d subfamily (8). Two members within this subfamily, Oatp1d1 and Oatp1d2, show different expression patterns. Oatp1d1 is ubiquitously expressed in zebrafish, with the highest expression in the liver and brain, followed by intestine, gonads, and kidney, whereas Oatp1d2 showed negligible expression in all analyzed tissues (8). Because teleosts do not have clear orthologs of mammalian OATP1A/Oatp1a and OATP1B/Oatp1b subfamily members, herein we hypothesize that zebrafish Oatp1d1 has role similar to that of the OATP1A/Oatp1a and OATP1B/Oatp1b subfamily members in mammals.
In order to test this hypothesis, we conducted a detailed functional characterization of Oatp1d1 in zebrafish as an important and widely used model species in biomedical and environmental research. We determined the interaction with physiologically important OATP1/Oatp1 substrates as well as pharmaceuticals known to interact with OATP1/Oatp1 family members. Furthermore, to determine evolutionarily conserved properties within the OATP1/Oatp1 family, we analyzed the pH dependence and transport mechanism of Oatp1d1 as well as structural properties of the OATP1/Oatp1 family. In terms of substrate specificity, we found that zebrafish Oatp1d1 is similar to mammalian OATP1A/Oatp1a and OATP1B/Oatp1b subfamily members, thus suggesting an important role of Oatp1d1 in the balance of steroid hormones in fish. We propose that Oatp1d1 transport is dependent on pH gradient. Analysis of evolutionarily conserved structural properties revealed that (i) the histidine residue at position 79 located in intracellular loop 3 (IL3) is conserved within the OATP1/Oatp1 family and is crucial for the transport activity; (ii) the N-glycosylation pattern is conserved within the OATP1/Oatp1 family and is important for membrane targeting, with conserved Asn residues Asn-122, Asn-133, Asn-499, and Asn-512 involved; (iii) the evolutionarily conserved cholesterol recognition interaction amino acid consensus (CRAC) motif is important for membrane localization; and (iv) Oatp1d1 forms dimers and possibly higher order homo-oligomers, where highly conserved glycophorin motifs in the TMD5 and TMD8 are involved in the interaction among monomers. Our results contribute to a better understanding of the OATP/Oatp evolution within the vertebrate phyla and offer the first insight into the function and structural properties of a novel zebrafish Oatp1 ortholog.
EXPERIMENTAL PROCEDURES
Chemicals
[3H]Estrone 3-sulfate (E3S; 50 Ci/mmol) was purchased from PerkinElmer Life Sciences. Unlabeled estrone 3-sulfate, Lucifer yellow (LY), and all other chemicals were purchased from Sigma-Aldrich or Carl Roth GmbH (Karlsruhe, Germany).
Phylogenetic Analysis
Gene sequences were retrieved, using the BLASTX algorithm, from the following databases: NCBI, ENSEMBL, JGI, and Genoscope. Sequences were considered to be part of the OATP/Oatp superfamily if they complied with three criteria: BLASTX hit with a threshold value of e = 10−3, the presence of the Oatp conserved domain with a threshold value of e = 10−6, and the presence of the superfamily signature (DXRW(I/V)GAWWXG(F/L)L) on the border of extracellular loop 3 and transmembrane domain 6 (TMD6) (9, 10). Sequences were aligned with the MUSCLE algorithm (11), and a phylogenetic tree was constructed using the maximum likelihood method in PhyML version 3.0.1 software (12). Confidence of nodes was estimated by the approximate likelihood ratio test (13). Based on the phylogenetic relationships, all previously unclassified genes were provisionally annotated. Names were given in accordance with the new nomenclature adopted by the HUGO Gene Nomenclature Committee (1).
Real-time PCR Analysis
Adult zebrafish were purchased from a local fish supplier. Tissues were collected and prepared for RNA isolation; reverse transcription and quantitative RT-PCR were conducted as described previously (8).
Cloning and Heterologous Expression in HEK293 Cells
Full-length zebrafish Oatp1d1 (corresponding to GenBankTM accession number NP_001082802) was amplified from the zebrafish liver using primer pairs 5′-TTAGCGGCCGCATGAGTACGGAGAAGAAGAAG-3′ (forward) and 5′-TTAGGTACCTCTAGACTTCAGATGGTGGTCTCCTG-3′ (reverse) with high fidelity Phusion DNA polymerase (Finnzymes, Vantaa, Finland). The amplicon was cloned into pJET 2.0 vector (Invitrogen), and the sequence was verified by sequencing at VBC-Biotech Services GmbH (Vienna, Austria). Slco1d1 cDNA, located between NotI and KpnI multiple cloning sites, was subcloned into expression vector pcDNA3.1 and pcDNA3.1/His (Invitrogen). HEK293 cells were transiently transfected using polyethyleneimine reagent in 24-well plates for the E3S uptake assay and in 48-well plates for the LY uptake assay (14). Cells were transfected in parallel with pcDNA3.1/His/LacZ plasmid, and transfection efficiency was evaluated 24 h after transfection with the LacZ staining protocol. Transport experiments were conducted 24 h post-transfection, when transfection efficiency was above 70%. To test the dimer/oligomer formation hypothesis, we have subcloned Oatp1d1 into the pCS2+8NmCitrine vector that fluoresces in the green region of the visible spectrum (516/529 nm). The vector was a kind gift from Dr. Amro Hamdoun (Scripps Institute).
Transport Measurements
For the purpose of the transport assay, HEK293 cells overexpressing Oatp1d1 were preincubated in the transport medium (145 mm NaCl, 3 mm KCl, 1 mm CaCl2, 0.5 mm MgCl2, 5 mm d-glucose, and 5 mm HEPES, pH 7.4) for 10 min at 37 °C. To assess transport, the medium was removed, and the same medium containing the substrate was added. After incubation, the cells were rapidly washed three times with ice-cold phosphate-buffered saline (PBS), lysed in 500 μl of 0.1% sodium dodecyl sulfate (SDS) for 30 min, transferred to scintillation vials, and measured by a liquid scintillation counter (Tri-carb 2800 TR, PerkinElmer Life Sciences) in the case of [3H]E3S or transferred to 96-well black plates (Sigma-Aldrich) and measured using the microplate reader (Infinite 2000, Tecan, Salzburg, Austria) at 425-nm excitation and 540-nm emission wavelengths in the case of LY. Calibration curves for E3S and LY were generated in the 0.1% SDS and in the cell matrix dissolved in the 0.1% SDS. In the case of both substrates, linear calibration curves were the same in the SDS and in the dissolved cell matrix. Using the calibration curves, uptake of E3S and LY was expressed as nm substrates/mg of protein. Total cell protein content was determined according to the manufacturer's instructions using the DC protein assay kit (Bio-Rad).
In the inhibition experiments, the cells were preincubated for 20 s with test compounds, followed by a 5-min incubation with [3H]E3S (5 nm) or 30-min incubation with LY (5 μm). For the interactors that showed uptake inhibition above 50%, Ki values were determined. For the purpose of distinguishing the type of interaction with chosen compounds, the shift in Km and Vmax values for LY was determined in the presence of a target compound (at a concentration equal to the Ki value of a compound), at varying LY concentrations (8 points) and after 15 min of incubation, which was within the linear range of the LY transport rate. To determine the shift in Km and Vmax values for LY more accurately, all of the competition type experiments were performed within a single transfection experiment (repeated at least three times) in order to eliminate interexperiment differences due to the transient transfection system. The uptake into vector-transfected HEK293 cells (mock cells) was subtracted to obtain the transporter-specific uptake.
To determine if Oatp1d1 activity is pH-dependent, transport assays were performed in transport buffers of varying pH, similar to those described previously (15). Uptake medium contained 145 mm NaCl, 3 mm KCl, 1 mm CaCl2, 0.5 mm MgCl2, 5 mm d-glucose, and 25 mm MES in the case of pH 5.5 medium; 5 mm Hepes for the pH 7.4 uptake medium; and 25 mm Tris for pH 8 medium. By lowering extracellular pH, an inwardly directed [H+] gradient was achieved. An outwardly directed [H+] gradient was created by acidifying intracellular space with NH4Cl (30-min incubation at 37 °C in 30 mm NH4Cl in the presence of 0.5 mm amiloride) or with alkalizing extracellular pH (16, 17). Acidification of intracellular pH was verified using the BCECF method, whereas calibration was performed in vitro with BCECF-free acid (18).
To determine if N-glycosylation is involved in post-translational processing of Oatp1d1, tunicamycin, a general N-glycosylation inhibitor, was added in varying concentrations during the 24-h post-transfection period. After 24 h, cells were briefly incubated in medium without tunicamycin, and [3H]E3S and LY uptake was determined as described above and compared with that of the non-treated transfected cells. HEK293 mock cells (vector-transfected cells) were assayed as well, with and without tunicamycin treatment. Membrane topology prediction and potential N-glycosylation sites were predicted using the NetNGlyc 1.0 server.
Site-directed Mutagenesis
Site-directed mutagenesis was performed with the asymmetric overlap extension method as described previously (19).
Western Blotting and Immunocytochemistry
Cells were collected from 25-cm2 culture flasks 24 h after transfection; lysed in radioimmune precipitation assay buffer (150 mm NaCl, 1 mm EDTA, 25 mm Tris, 0.8% Nonidet P-40) with protease inhibitor mixture 4-(2-aminoethyl)-benzenesulfonyl fluoride (Sigma-Aldrich) for 30 min on ice; subjected to three freeze/thaw cycles; briefly sonicated; and centrifuged at 1,000 × g for 10 min at 4 °C. The protein concentration in total cell lysate was measured according to the manufacturer's instructions using the DC protein assay kit (Bio-Rad). Twenty micrograms of protein/lane was separated by electrophoresis in 1% SDS-polyacrylamide gel. The proteins were then transferred to the polyvinylidene difluoride membrane (Millipore) by semidry blotting. Blocking was performed in blocking solution, containing 5% low fat milk, 50 mm Tris, 150 mm NaCl, and 0.05% Tween 20. Subsequently, membranes were washed and incubated for 1 h with anti-Xpress (Invitrogen) or for 2 h with anti-His antibody (Santa Cruz Biotechnology, Inc.). Goat anti-mouse IgG-HRP was used as secondary antibody (Bio-Rad). The proteins were visualized by chemiluminescence (Abcam, Cambridge, UK). Protein size was estimated by the use of a protein marker (Thermo Fisher Scientific).
For immunofluorescence detection, HEK293 cells were grown on glass coverslips in 24-well culture plates. Twenty-four hours after transfection, cells were fixed with 4% paraformaldehyde in PBS for 30 min, washed three times in 100 mm glycine/PBS, permeabilized for 15 min in methanol, and blocked in 5% low fat milk for 30 min with gentle agitation. Subsequently, coverslips were transferred on microscope slides and incubated with Xpress antibody (1:100) in blocking solution for 1 h at 37 °C in a humidity chamber, washed, and then incubated with secondary FITC antibody (1:100) in blocking solution for 1 h at 37 °C. When double staining was performed after incubation with FITC, blocking was done in 5% low fat milk for 30 min with gentle agitation, followed by incubation with Na,K-ATPase anti-mouse primary antibody (Santa Cruz Biotechnology) for 2 h (1:150), washing, and 1-h incubation with Cy3-conjugated anti-mouse IgG-HRP as a secondary antibody (1:200) (Santa Cruz Biotechnology). Nuclei were stained with DAPI for 45 min at 37 °C in 300 nm DAPI/PBS. After mounting the samples in Fluoromount medium (Sigma-Aldrich), immunofluorescence was detected using a Leica TCS SP2 AOBS confocal microscope (Leica Microsystems, Wetzlar, Germany).
Cell Surface Biotinylation
Surface biotinylation of Oatp1d1 at the plasma membrane was performed as described previously (20) with some modifications. Transiently transfected cells (with pcDNA3.1/His vector alone or with pcDNA3.1/His-Oatp1d1) were washed three times with PBS, and surface proteins were biotinylated with Sulfo-NHS-LC-LC-biotin (1 mg/ml; Pierce) in PBS for 2 h at 4 °C. Subsequently, cells were washed three times with ice-cold PBS containing 100 mm glycine, lysed as described above, and centrifuged at 10,000 × g for 10 min at 4 °C to pellet the insoluble fraction. Total cell lysates were incubated with hydrophilic streptavidin magnetic beads (New England Biolabs) overnight on ice with gentle agitation. Bound proteins were washed and eluted according to the manufacturer's instructions, analyzed using Western blotting with anti-His primary antibody (1:3000), and visualized by chemiluminescence.
Data Analysis
All assays were performed in 2–4 independent experiments run in triplicates. Data represent mean ± S.E. or S.D. All calculations were performed using GraphPad Prism version 5 for Windows as described below. The kinetic parameters (Km and Vmax values) were calculated using the Michaelis-Menten equation,
 |
where V represents velocity (nmol of substrate/mg of proteins/min), Vmax is maximal velocity, [S] is substrate concentration, and Km is the Michaelis-Menten constant. The uptake into vector-transfected HEK293 cells was subtracted to obtain transporter-specific uptake. The Hill coefficient (h) estimating the degree of cooperativity was determined from the Hill plot (X = log [S], Y = log(V − Vmax)/Vmax. For the purpose of Ki calculations, data were fitted to the sigmoidal four-parameter dose-response model (variable slope),
 |
where V is response, Vmin represents minimum of response, Vmax represents maximum of response, h is Hill slope parameter, Ki is the concentration of inhibitor that corresponds to 50% of maximal effect, and A is the concentration of tested compound.
RESULTS
Phylogenetic Relationships
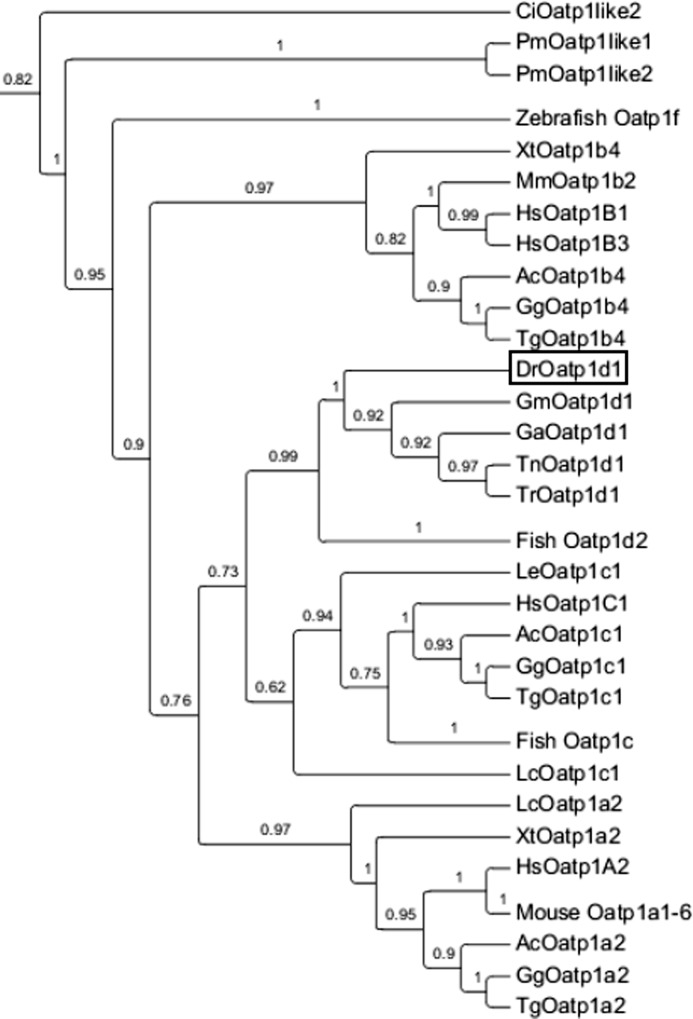
In order to determine phylogenetic relationships of zebrafish Oatp1d1 with the mammalian OATP1/Oatp1 members of known function, we performed a phylogenetic analysis of the OATP/Oatp superfamily in chordates. Resulting phylogenetic tree and provisional annotations and accession numbers are given in supplemental Fig. 1 and Table 1. In order to position zebrafish Oatp1d1 within the OATP/Oatp superfamily, all available chordate genomes were included in the analysis, from the ancient urochordates to mammals. A separate phylogenetic tree of the OATP1/Oatp1 family, which is a part of the complete OATP/Oatp tree given in supplemental Fig. 1, clearly shows distinct clusters of five subfamilies: OATP1A/Oatp1a, OATP1B/Oatp1b, OATP1C/Oatp1c, Oatp1d, and Oatp1f (Fig. 1). The obtained OATP/Oatp1 phylogeny represents an updated and improved analysis, considering that more genomes became available since the last phylogenetic analysis of OATPs/Oatps (1, 8, 10).
FIGURE 1.
Phylogenetic analysis of OATP1/Oatp1 family (organic anion-transporting polypeptides; gene family SLCO) in vertebrate phyla. The phylogenetic tree was constructed with the maximum likelihood method. Branch support is estimated with the approximate likelihood ratio test. Species abbreviations are as follows. Hs, Homo sapiens; Gg, Gallus gallus; Tg, Taeniopygia guttata; Ac, Anolis carolinensis; Xt, Xenopus tropicalis; Dr, Danio rerio; Tn, Tetraodon nigroviridis; Tr, Takifugu rubripes; Ga, Gastrosteus aculeatus; Ol, Oryzias latipes; Gm, Gadus morhua; Lc, Latimeria chalumnae; Le, Leucoraja erinacea; Pm, Petromyzon marinus; Ci, Ciona intestinalis.
We report the first finding of OATPs/Oatps both in a urochordate, sea squirt (Ciona intestinalis), and in a primitive jawless fish, sea lamprey (Petromyzon marinus). These Oatps clearly belong to the OATP1/Oatp1 family, within which they position outside of the vertebrate OATP1/Oatp1 clusters (supplemental Fig. 1). These newly identified OATPs/Oatps could represent ancestral sequences of the OATP1/Oatp1 family. Within the vertebrate cluster, OATP1A/Oatp1a and OATP1B/Oatp1b subfamilies are found in all tetrapod representatives, including West Indian Ocean coelacanth (Latimeria chalumnae). However, they are not present in teleost fish (Fig. 1). The OATP1C/Oatp1c subfamily is conserved throughout vertebrate phyla, including teleosts and the cartilaginous fish little skate. Herewith, we reassign the annotation of the skate Oatp gene that was previously annotated as Oatp1d1 (7, 21). According to our revised phylogeny (with more fully sequenced genomes available), the skate Slco gene is an OATP1C1/Oatp1c1 ortholog. The Oatp1d subfamily is a teleost-specific gene subfamily that forms a distinct cluster with a high node confidence (approximate likelihood ratio test = 0.99) between the OATP1B/Oatp1b and OATP1A/1C (Oatp1a/1c) subfamilies. Apart from zebrafish, Oatp1d1 and Oatp1d2 orthologs are present in all analyzed teleost species: pufferfishes (Tetraodon nigroviridis and Takifugu rubripes), stickleback (Gastrosteus aculeatus) and Atlantic cod (Gadus morhua) (Fig. 1).
Tissue Expression Pattern and Sex Differences in Oatp1d1 Expression
Oatp1d1 shows a ubiquitous tissue expression pattern with the highest expression in liver, brain, and testes, followed by intestine, kidney, gills, and skeletal muscle (Fig. 2). Sex differences in Oatp1d1 expression pattern are most pronounced in testes, where Oatp1d1 expression is 50 times higher than in ovaries. Differential mRNA expression is also present in zebrafish liver, where Oatp1d1 is 10 times higher expressed in males, followed by a smaller difference of 2.5-fold higher expression in the male kidney. In brain, gills, and intestine, Oatp1d1 is similarly expressed in both genders.
FIGURE 2.
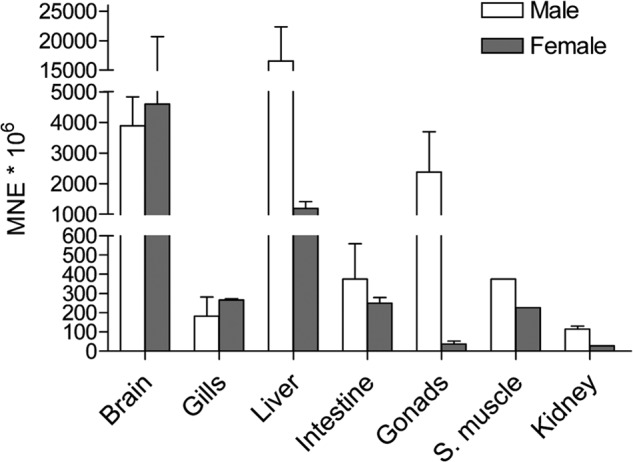
Tissue expression pattern of Slco1d1 in male and female zebrafish. Gene expression was quantified with quantitative RT-PCR using a relative quantification method. Results of three independent experiments (three pools of five individuals, two pools of 14 individuals for kidney) are shown. Data represent mean normalized expression (MNE) ± S.E. (error bars) normalized to the elongation factor 1α (Ef1α).
Functional Characterization of Oatp1d1
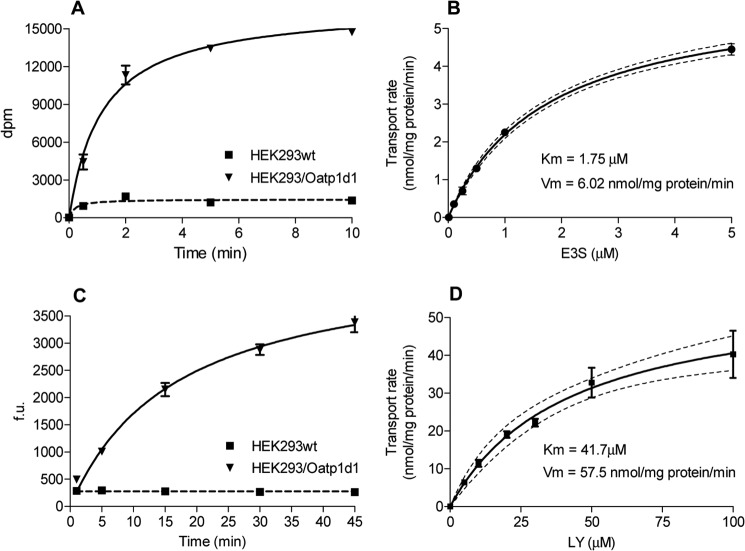
The transport of two substrates, E3S and the anionic dye LY, follows the classical Michaelis-Menten kinetics with saturable uptake of E3S after 2 min (Fig. 3A) and LY after 10 min (Fig. 3C), respectively. Oatp1d1 shows high affinity for E3S with Km of 1.75 ± 0.12 μm (Fig. 3B) and moderate affinity for LY with Km of 41.7 ± 10.1 μm (Fig. 3D). Vmax for E3S is 6.02 ± 0.17 nmol of E3S/mg of protein/min, whereas Vmax for LY is 57.5 ± 6.49 nmol of LY/mg of protein/min. The Hill number is close to 1 (1.2 for E3S and 0.78–1.2 for LY (four independent experiments)), which indicates a low degree of cooperativity and possibly one binding site for E3S and LY. Ki values for a set of model OATP1 substrates are similar when obtained either with the E3S or the LY inhibition assay (correlation analysis: R2 = 0.9218, p = 7.44 × 10⁻⁷, n = 10), which indicates that LY and E3S share the same binding site.
FIGURE 3.
Michaelis-Menten kinetics of zebrafish Oatp1d1 mediated uptake of E3S and fluorescent dye LY. Transport measurements were performed 24 h after transient transfection in HEK293 cells. Oatp1d1-overexpressing HEK293 cells were preincubated in the transport medium (145 mm NaCl, 3 mm KCl, 1 mm CaCl2, 0.5 mm MgCl2, 5 mm d-glucose, and 5 mm HEPES, pH 7.4) for 10 min at 37 °C. To assess transport, medium was removed, and the same medium containing a substrate was added. A, time response of Oatp1d1 [3H]E3S-mediated uptake expressed as a change in disintegration parts per minute (dpm) over the incubation time; B, dose response of Oatp1d1 [3H]E3S uptake expressed as transport rate of [3H]E3S (nmol/mg protein/min) over [3H]E3S concentration (μm) after a 5-min incubation with [3H]E3S (50 Ci/mmol). C, time response of LY uptake expressed as an increase in fluorescence (fluorescence units (f.u.)) over time (min). D, concentration dependence of LY uptake expressed as the transport rate (nmol/mg protein/min) over LY concentration (μm) after a 15-min incubation with LY. The uptake into vector-transfected HEK293 cells (mock cells) was subtracted to obtain transporter-specific uptake, and data were fitted in GraphPad Prism version 5. Each value represents the mean ± S.E. (error bars) from triplicate determinations.
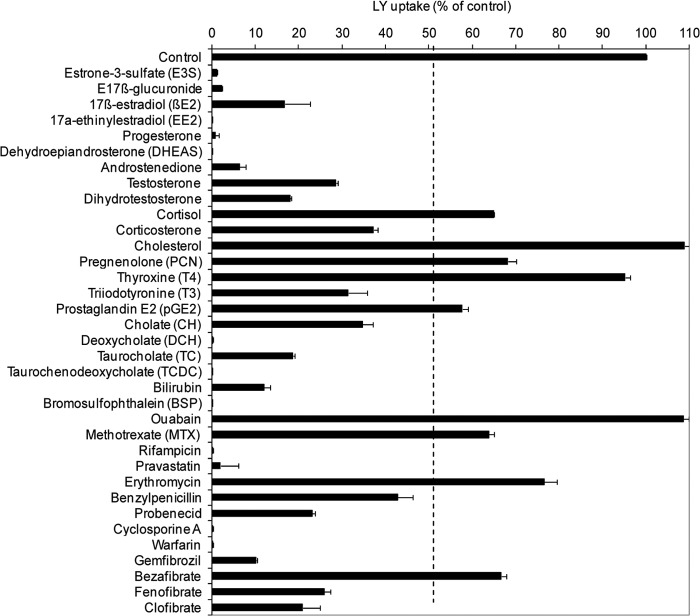
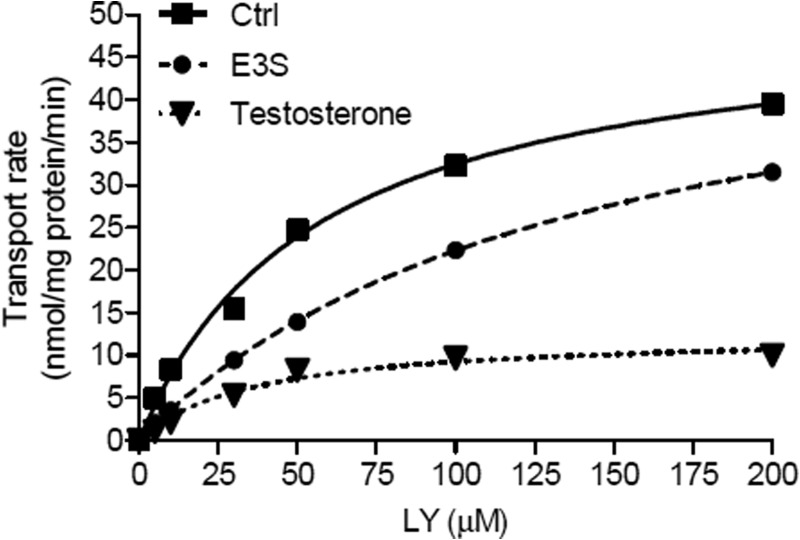
In order to elucidate the physiological role of Oatp1d1, we tested a series of known OATP1/Oatp1 substrates, including steroids, corticosteroids, thyroid hormones, prostaglandin E2, bile salts, and bilirubin. In addition to endogenous compounds, we analyzed several pharmaceuticals that are known to interact with mammalian OATP1/Oatp1 members in order to gain further insight into the specificity of the Oatp1d1 substrate binding site. A summary of the described inhibition assays is presented in Fig. 4. For the most active compounds (inhibition of LY uptake >50%), Ki values were determined and shown in Table 1. Dose responses of representative model substrates and inhibitors are given in Fig. 5, A and B. In order to determine the type of interaction with Oatp1d1, we compared kinetic parameters of LY uptake (eight different LY concentrations) in the absence and in the presence of different interacting compounds, where their concentrations were equal to their previously calculated Ki values. A summary of these findings is presented in Table 2, and representative dose-response curves of a typical competitive and noncompetitive inhibitor are shown in Fig. 6. This type of analysis has been successfully used previously to determine the type of interaction for a wide range of physiological substrates and fibrates for OATP1B1 (22, 23) and the interaction of OATP1B1, OATP1B3, and OATP1C1 with non-steroidal anti-inflammatory drugs (24, 25). If an interacting compound is a competitive inhibitor of LY, we can assume that it is being transported by Oatp1d1, in which case the Ki value of the interacting compound actually represents its Km value.
FIGURE 4.
Interaction of zebrafish Oatp1d1 with known substrates and inhibitors of mammalian OATP1/Oatp1 family members. Data are expressed as a percentage of the LY uptake after co-incubation with each interactor (100 μm) relative to LY uptake in the absence of interactor, which is set to 100%. Transiently transfected Oatp1d1-overexpressing cells were preincubated for 20 s with the tested compound, followed by a 30-min incubation with LY at 37 °C. The reaction was stopped with two washing cycles in ice-cold PBS, and the cells were lysed in 0.1% SDS for 30 min. Each value represents the mean ± S.E. (error bars) from triplicate determinations.
TABLE 1.
Ki values for a set of chosen zebrafish Oatp1d1 interactors
Interaction of Oatp1d1 with typical endo- and xenobiotic substrates and inhibitors of OATP1/Oatp1 family is expressed as a percentage of LY uptake mediated by Oatp1d1-overexpressing HEK293 cells in the presence of an interactor (100 μm) relative to control (Oatp1d1-overexpressing HEK293 cells in the absence of an interactor). Physiological interactors are separated from xenobiotic interactors as shown. LY (5 μm) uptake was measured after a 15-min incubation at 37 °C. The inhibition constant (Ki) for each interactor that showed more than 50% inhibition was determined by fitting data to a sigmoidal four-parameter dose-response model (variable slope) in GraphPad Prism version 5. Mean, S.D., and confidence intervals are calculated from triplicate determinations. NE, no effect; ND, not determined.
| Compound | LY uptake |
Ki | c.i. | |
|---|---|---|---|---|
| Mean | S.D. | |||
| % | μm | |||
| Control | 100 | 0.10 | ||
| Estrone 3-sulfate | 1.04 | 0.20 | 1.01 | 0.75–1.37 |
| E17β-glucuronide | 2.25 | 0.10 | 3.26 | 2.83–3.75 |
| 17β-estradiol | 16.8 | 5.79 | 2.83 | 2.27–3.51 |
| 17a-ethinylestradiol | 0.20 | 0.14 | 5.93 | 4.41–7.97 |
| Progesterone | 0.67 | 0.88 | 9.06 | 8.06–10.2 |
| DHEAS | 0.21 | 0.15 | 0.68 | 0.46–0.99 |
| Androstenedione | 6.33 | 1.40 | 3.78 | 2.85–5.02 |
| Testosterone | 28.6 | 0.51 | 30.0 | 25.5–35.2 |
| Dihydrotestosterone | 18.0 | 0.23 | 23.4 | 18.6–29.3 |
| Cortisol | 65.0 | 0.04 | 120 | 73.8–194 |
| Corticosterone | 37.2 | 0.92 | 105 | 38.0–288 |
| Cholesterol | 109 | 2.48 | NE | NE |
| Pregnenolone | 68.2 | 1.89 | ND | ND |
| Thyroxine | 95.2 | 1.19 | NE | NE |
| Triiodotyronine | 31.4 | 4.41 | 42.7 | 18.9–95.9 |
| Prostaglandin E2 | 57.7 | 1.30 | 227 | 98.7–524 |
| Cholate | 34.7 | 2.39 | 141 | 33.8–591 |
| Deoxycholate | 0.18 | 0.07 | 9.94 | 6.53–15.1 |
| Taurocholate | 18.6 | 0.37 | 36.9 | 30.2–45.1 |
| Taurochenodeoxycholate | 0.28 | 0.09 | 3.40 | 2.66–4.33 |
| Bilirubin | 12.0 | 1.41 | 14.5 | 12.8–16.5 |
| Bromosulfophthalein | 0.11 | 0.01 | 2.99 | 2.19–4.06 |
| Ouabain | 109 | 1.16 | NE | NE |
| Methotrexate | 63.8 | 1.36 | 222 | 62.4–792 |
| Rifampicin | 0.19 | 0.04 | 12.7 | 9.86–16.2 |
| Pravastatin | 1.98 | 4.15 | 9.27 | 6.75–12.7 |
| Erythromycin | 76.5 | 3.06 | 882 | 640–1,216 |
| Benzylpenicillin | 42.8 | 3.41 | 372 | 271–510 |
| Probenecid | 23.0 | 0.67 | 26.0 | 14.5–46.6 |
| Cyclosporine A | 0.17 | 0.06 | 1.34 | 1.19–1.50 |
| Warfarin | 0.11 | 0.13 | 0.36 | 0.31–0.42 |
| Gemfibrozil | 10.2 | 0.20 | 7.44 | 4.37–12.7 |
| Bezafibrate | 66.7 | 1.16 | 40.4 | 22.9–71.4 |
| Fenofibrate | 25.9 | 1.48 | 54.4 | 37.8–78.3 |
| Clofibrate | 20.9 | 3.94 | 345 | 252–470 |
FIGURE 5.
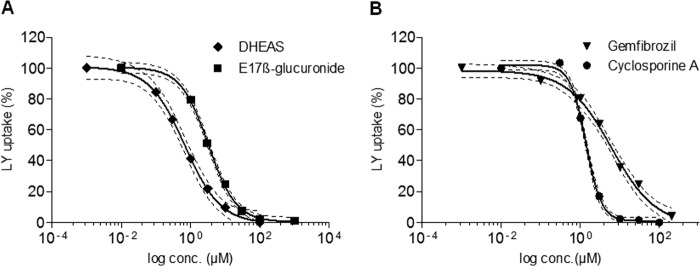
Concentration-dependent inhibition of Oatp1d1-mediated LY uptake by typical interactors of the OATP1/Oatp1 family. Representative compounds are shown: DHEAS and estradiol 17β-glucuronide as typical OATP1/Oatp1 subfamily substrates (A) and gemfibrozil and cyclosporin A as model inhibitors (B). The specific uptake of LY is expressed as a percentage relative to the LY uptake in the absence of an interactor (which is set to 100%). For the purpose of Ki calculations, data were fitted to the sigmoidal four-parameter dose-response model (variable slope) in GraphPad Prism version 5. Each data point represents the mean ± S.E. from triplicate determinations.
TABLE 2.
Determination of substrates and inhibitors of zebrafish Oatp1d1
Shown is a kinetic analysis of LY transport by HEK293/Oatp1d1-overexpressing cells in the absence of an interactor (control) and in the presence of an interactor (at a concentration equal to its Ki value shown in Table I). In all cases, the LY uptake followed Michaelis-Menten type kinetics, where a Km decrease and no change in the transport rate (Vm) in the presence of interactor indicates competitive inhibition (designated S for substrates); Km decrease and Vm decrease indicates non-competitive inhibition; and finally, no change in Km and a Vm decrease indicates uncompetitive inhibition (inhibitors are designated with “I”). Kinetic parameters of LY uptake are given as apparent Km (Km(app)) (μm), apparent Vm (Vm(app)) (nmol of LY/mg of protein/min), and 95% confidence intervals for each. Uptake was measured after a 15-min incubation at 37 °C. Data are mean ± S.E. from triplicate determinations.
| Interactor | Km(app) (LY) | c.i. | Vm(app) (LY) | c.i. | Interaction type |
|---|---|---|---|---|---|
| Control | 59.3 | 31.4–87.2 | 50.7 | 43.2–58.1 | |
| Estrone 3-sulfate | 147 | 128–167 | 54.9 | 50.9–58.9 | S |
| Estradiol 17β-glucuronide | 93.6 | 73.9–113 | 56.3 | 50.1–62.5 | S |
| Estradiol | 61.7 | 44.9–78.5 | 31.6 | 27.9–35.2 | I |
| Testosterone | 54.6 | 37.7–71.5 | 15.6 | 13.1–18.1 | I |
| Dihydrotestosterone | 42.4 | 21.8–63.1 | 24.0 | 18.8–29.1 | I |
| DHEAS | 129 | 81.9–175 | 59.4 | 48.6–70.1 | S |
| Androstenedione | 60.1 | 35.9–84.2 | 40.6 | 36.1–45.2 | I |
| Progesterone | 56.2 | 32.8–79.6 | 20.3 | 16.3–24.3 | I |
| Cortisol | 84.3 | 32.7–136 | 76.6 | 53.4–99.8 | S |
| Corticosterone | 32.0 | 23.8–40.3 | 41.3 | 36.4–46.1 | I |
| Triiodothyronine | 22.6 | 12.8–32.4 | 16.8 | 14.3–19.2 | I |
| Cholate | 39.7 | 18.9–60.5 | 25.1 | 19.7–30.4 | I |
| Deoxycholate | 29.2 | 2.74–55.7 | 16.3 | 9.91–22.6 | I |
| Taurocholate | 64.1 | 3.06–125 | 16.9 | 11.5–22.2 | I |
| Taurochenodeoxycholate | 39.8 | 26.5–53.2 | 18.0 | 15.7–20.2 | I |
| Bilirubin | 36.1 | 19.1–53.1 | 20.6 | 16.8–24.4 | I |
FIGURE 6.
Example of dose-response curves used to determine the type of interaction with Oatp1d1. Kinetic analysis of LY-mediated transport by HEK293/Oatp1d1-overexpressing cells in the absence of an interactor (Ctrl) and in the presence of a competitive inhibitor (substrate) E3S at 0.8 μm concentration and in the presence of uncompetitive inhibitor testosterone at a 30 μm concentration. For the purpose of distinguishing the type of interaction with chosen compounds, the shift in Km and Vmax values for LY was determined in the presence of target compounds. LY concentration was variable (6 points), whereas the concentration of modulator compound was fixed to its previously determined Ki value. Dose-response curves were calculated for each interactor using nonlinear regression (GraphPad Prism version 5). Each point represents the mean velocity ± S.E. from triplicate determinations.
The first major group of Oatp1d1-interacting compounds includes steroid and thyroid hormones. High affinity substrates of Oatp1d1 are sulfated and glucuronidated steroid conjugates, E3S (Km = 1.75 μm), dehydroepiandrosterone sulfate (DHEAS) (Ki = 0.68 μm), and estradiol 17β-glucuronide (Ki = 3.26 μm) (Tables 1 and 2). Nonconjugated steroids, estradiol (E2) (Ki = 2.83 μm), progesterone (Ki = 9.1 μm), and dihydrotestosterone (Ki = 23.35 μm), are potent uncompetitive inhibitors of LY uptake, whereas testosterone (Ki = 29.98 μm) and androstenedione (Ki = 3.78 μm) show moderate to strong inhibition of the noncompetitive type (Table 2). Interestingly, progestagen and pregnenolone show no interaction with Oatp1d1. In comparison with progestagens and androgens, corticosteroids cortisol and corticosterone show weaker interactions with Oatp1d1, with Ki values of 120 and 105 μm, respectively (Table 1). Cortisol is a substrate, whereas corticosterone is an uncompetitive inhibitor of Oatp1d1 (Table 2). We also wanted to determine if thyroid hormones T4 and T3, as prototypical OATP1C/Oatp1c subfamily substrates (5), interact with Oatp1d1. We found that Oatp1d1 does not interact with T4, and T3 is a moderately strong uncompetitive inhibitor (Ki = 42.7 μm) of Oatp1d1 (Table 2). Eicosanoid prostaglandin E2, a specific OATP1B1 substrate (23), weakly interacts with Oatp1d1 (Ki = 227.4 μm).
The second major group of Oatp1d1-interacting compounds is bile salts. Oatp1d1 shows interaction with all four major bile salts (cholate, taurocholate, deoxycholate, and taurochenodeoxycholate) with increasing potency (Ki = 141, 36.9, 9.94, and 3.39 μm, respectively). All four tested bile salts are inhibitors of LY transport; taurocholate shows noncompetitive inhibition, whereas the other three are uncompetitive inhibitors (Table 2). Besides steroids, thyroids, and bile salts, known physiological substrates of the OATP1/Oatp1 family in mammals are bilirubin and its conjugates. However, bilirubin is not transported by Oatp1d1 but rather behaves as a potent uncompetitive inhibitor (Ki = 14.5 μm) (Table 2). Bilirubin conjugates were not tested due to their commercial unavailability.
After testing a wide series of physiological OATP1/Oatp1 family interactors, we selected a set of known xenobiotic interactors in order to compare interaction strength and substrate specificities among zebrafish and human OATP1/Oatp1 members. Data on modulation of Oatp1d1 activity with model xenobiotics are shown in Table 1. The most potent interacting compounds include warfarin, cyclosporin A, bromosulfophtalein, gemfibrozil, pravastatin, and rifampicin. Moderately strong interactors are probenecid, bezafibrate, and fenofibrate, whereas methotrexate, clofibrate, benzylpenicillin, and erythromycin show weak interaction.
Dependence on pH Gradient
We suggest that Oatp1d1-mediated LY uptake is dependent on the pH gradient. The inwardly directed [H]+ gradient created by lowering extracellular pH (pHo = 5.5) caused activation of Oatp1d1 transport. This effect was apparent with both substrates; E3S uptake at pHo 5.5 increased by 108 ± 20%, and LY uptake at pHo 5.5 increased by 158 ± 4% in comparison with pHo 7.4 (Fig. 7A). To test if this effect was due to the activation of inwardly directed proton gradient, we performed the same experiment in the presence of ionophore monensin, which acts as an Na+/H+ antiporter and stops the gradient. Indeed, the addition of 2 μm monensin at pHo 5.5 resulted in the same Oatp1d1 activity as was observed at neutral extracellular pH, which suggested that the effect was gradient-specific (Fig. 7A). Kinetic analysis of Oatp1d1 LY transport at pHo 5.5 showed a significant increase in the transport rate and no change in substrate affinity of LY (Fig. 8A). Next, we created outwardly directed proton gradient to determine its effect on Oatp1d1 activity. In order to achieve outward [H]+ flux, we applied two different approaches: (i) alkalization of extracellular medium (pHo 8) and (ii) acidification of intracellular space (pHi). Significant reduction of Oatp1d1 activity was observed in comparison with neutral conditions in both cases: at pHo 8, LY uptake was reduced by 58.8% in comparison with neutral pHo, and at pHi < pHo, the uptake was decreased by 83% when compared with pHi ≈ pHo (Fig. 7B). The specificity of the gradient dependence was further tested by monitoring the pHi recovery to neutral pH (2-h incubation in complete growth medium at 37 °C), when the protein activity was restored to the control levels (data not shown). Furthermore, we determined uptake kinetic parameters at pHo 8 and found that the transport rate and transport affinity were significantly reduced (Fig. 8A).
FIGURE 7.
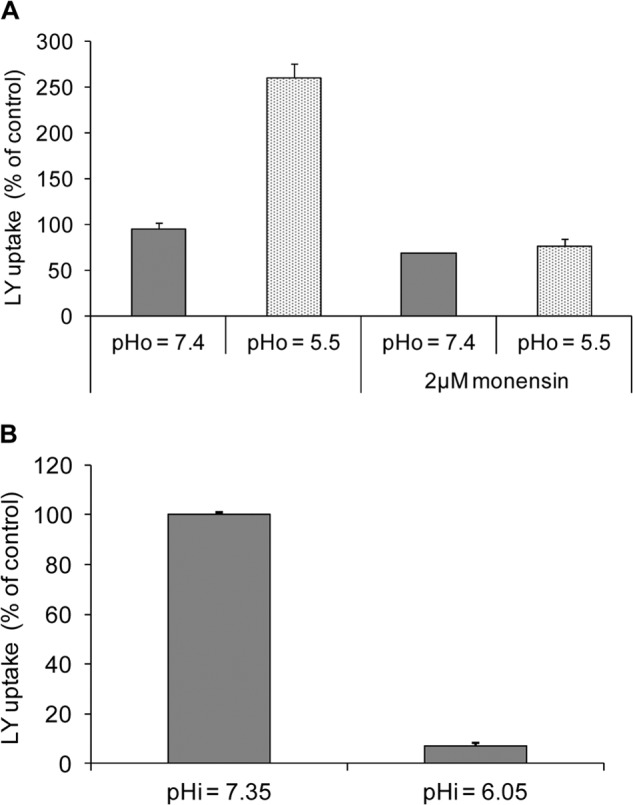
pH dependence of Oatp1d1. A, extracellular acidification (pHo) activates Oatp1d1-mediated LY uptake by 2.5-fold. When the inwardly directed [H]+ gradient is stopped with 2 μm monensin, LY uptake returns to control levels at neutral pHo. B, intracellular acidification after incubation in 30 mm NH4Cl (30 min at 37 °C), which creates an outwardly directed [H]+ gradient, abolishes Oatp1d1 LY uptake after pHi is reduced by 1.25 pH units (acidification from pH 7.35 to 6.05). Each data point represents the mean ± S.E. (error bars) of three independent experiments.
FIGURE 8.
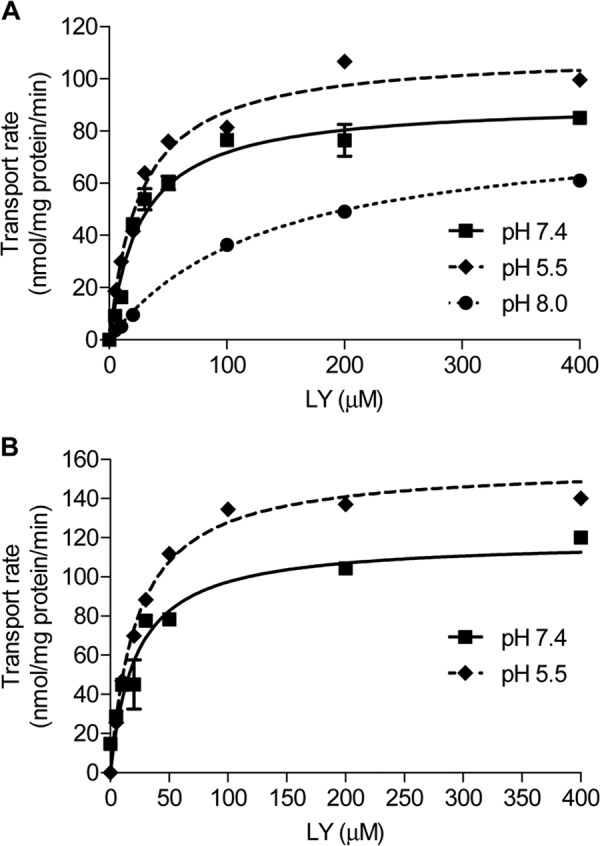
Effects of extracellular pH on Oatp1d1-WT- and Oatp1d1- H102Q-mediated LY uptake kinetics. A, Oatp1d1-WT. Km shifts from 27.0 ± 4.4 μm in neutral pHo to 134 ± 13.1 μm in pHo 8, whereas at the same time it remains unchanged at acidic pHo. Vm is significantly reduced at pHo 8 (83.1 nmol/mg protein/min; c.i. 76.5–90.0) in relation to neutral pHo (91.2 nmol/mg protein/min; c.i. 81.4–101), while at the same time Vm significantly increases at acidic pHo (110 nmol/mg protein/min; c.i. 103–117). B, Oatp1d1-H102Q. Similar to Oatp1d1-WT, Km remains the same at acidic pHo (22.9 ± 2.5 μm relative to neutral pHo (21.9 ± 5.2 μm), whereas Vm is significantly increased at acidic pHo (157 nmol/mg protein/min; c.i. 146–168) relative to neutral pHo (119 nmol/mg protein/min; c.i. 97.7–134). The uptake into vector-transfected HEK293 cells (mock cells) was subtracted to obtain transporter-specific uptake, and data were fitted in GraphPad Prism version 5. Each value represents the mean ± S.E. (error bars) from triplicate determinations.
The fact that the Oatp1d1 transport rate is activated at acidic extracellular pH and decreased at both alkaline extracellular pH and acidified pHi indicates that Oatp1d1 transport is dependent upon the proton gradient. It has been suggested that transport activation at extracellular pH is due to the protonation of an active site, more specifically a conserved outwardly facing histidine residue at the extracellular side of TMD3 (26). Although protonation of the substrate binding site would cause changes in apparent Km at pHo <7.4, which we did not observe, we proceeded to the site-directed mutagenesis of conserved histidine (His-102), to test our hypothesis that activation of Oatp1d1 transport at pHo <7.4 is due to the inwardly directed proton gradient and not to the His-102 protonation, as observed previously for certain mammalian OATP/Oatps (26). Considering that the Oatp1d1-H102Q mutant showed the same increase in transport rate at pHo 5.5 as was observed for Oatp1d1-WT (Fig. 8B), we conclude that the effect of pH-dependent transport activation was not due to the protonation of His-102. Following similar reasoning, the observed strong reduction in Oatp1d1 transport at pHi <6.9 could be a consequence of outwardly directed proton flux, which affects the [HCO3−] gradient. Alternatively, it could be a consequence of protonation of histidine residues at the intracellular side at pH <6.9. Therefore, we have searched for conserved histidines on the intracellular side of the protein, and found that His-79 in IL1 is conserved in all OATP1/Oatp1 members from fish to mammals. The constructed H79Q mutant had very low activity at neutral pHi, when LY uptake was reduced by 80% in comparison with Oatp1d1-WT (Fig. 9A). The reduction of the LY transport rate in the case of H79Q mutant was neither a consequence of the reduced protein expression, as seen from the Western blot analysis, nor a consequence of impaired membrane localization, as shown by immunocytochemistry (Fig. 9A). This suggests that His-79 is crucial for the Oatp1d1 transport activity. Although the importance of His-79 for Oatp1d1 transport activity was an unexpected discovery, we wanted to further investigate whether protonation of inwardly facing His-79 may be in part responsible for the effect of reduced transport activity at pHi <6.9. LY uptake in the Oatp1d1-H79Q mutant was reduced by 45% at pHi <6.9 in comparison with the transport activity of Oatp1d1-H79Q at neutral pHi. In contrast, Oatp1d1-WT activity was more profoundly reduced at acidified pHi in comparison with Oatp1d1-WT at neutral pHi (65% reduction (Fig. 9B). Therefore, we conclude that protonation of His-79 negatively influences Oatp1d1 transport activity and that this effect is partly responsible for the transport decrease at pHi <7, whereas the majority of reduction effect is due to the outwardly directed proton gradient created at pHi < pHo.
FIGURE 9.
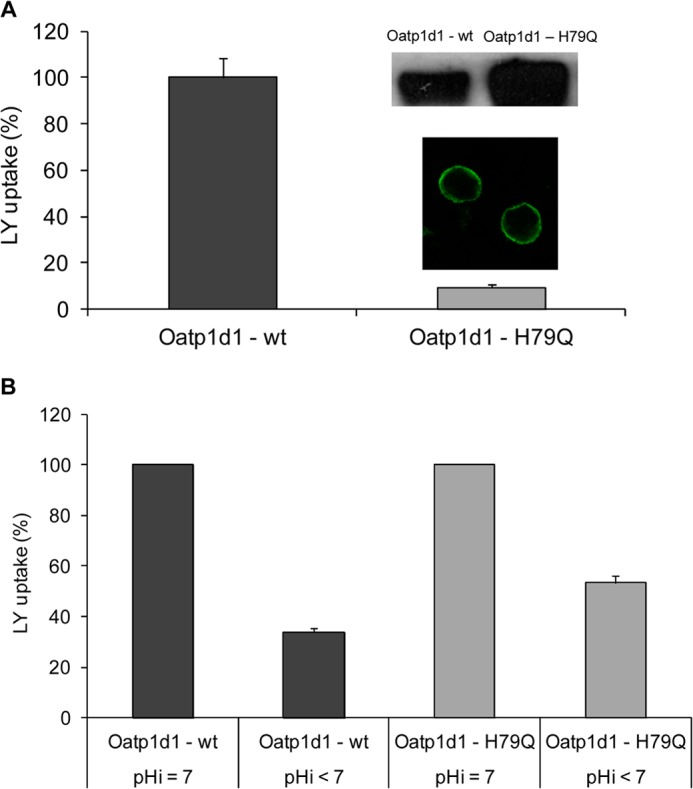
Histidine at position 79 is crucial for the Oatp1d1 transport activity, and its protonation is partly responsible for the reduction of Oatp1d1 transport activity at alkaline extracellular pH. A, activity of the Oatp1d1-H79Q mutant shown as a percentage of LY uptake relative to the Oatp1d1-WT. Uptake of LY by Oatp1d1 and Oatp1d1-H79Q was measured in transiently transfected HEK293 cells after a 15-min incubation with 100 μm LY at 37 °C. Data represent mean ± S.E. (error bars) of three independent experiments. Inset, localization of the H79Q mutant in the plasma membrane obtained by immunofluorescence analysis by confocal microscopy and high protein levels on Western blots stained with anti-His antibody. Immunocytochemistry was performed with FITC antibody. B, change in activity of Oatp1d1-WT and Oatp1d1-H79Q at neutral and acidified pHi. Results represent the percentage of LY uptake relative to Oatp1d1-WT at neutral pHi and relative to Oatp1d1-H79Q at neutral pHi, respectively. Data represent mean and S.E. from triplicate determinations.
Oligomerization of Oatp1d1
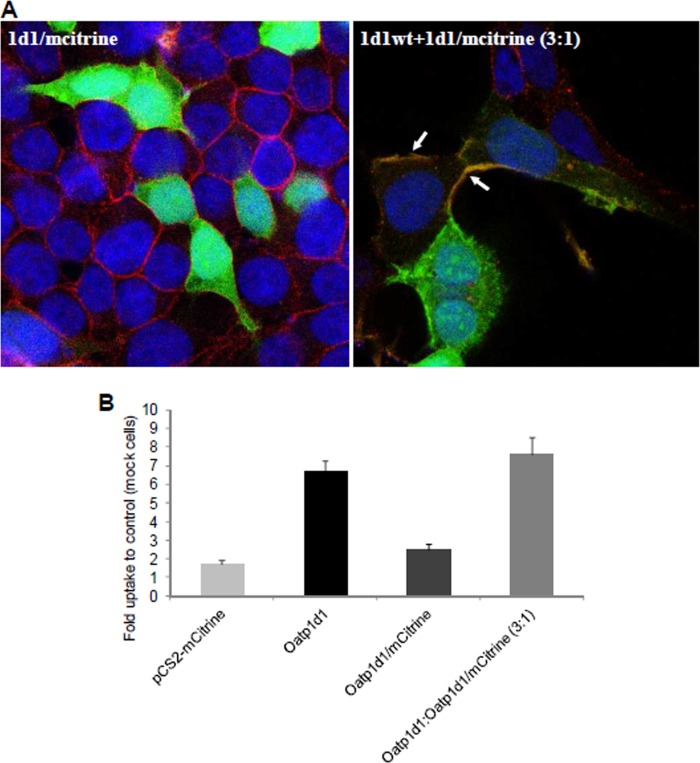
Oatp1d1 is present in three forms: as a monomeric protein of ∼80 kDa, as a dimeric form of ∼150 kDa, and as a tetramer or higher order oligomer that appears at ∼250 kDa in Western blots from the total cell lysate fraction (Fig. 10A). However, when the cell membrane fraction was isolated through the cell surface biotinylation, followed by binding of membrane fraction to the streptavidin magnetic beads, Western blots with anti-His primary antibody showed only the oligomeric form (Fig. 10A). Oligomers were not formed through disulfide bonds, because there was no breakage of the oligomeric complex in the presence of dithiothreitol (DTT) as a reducing agent (Fig. 10B). However, monomers appear to be linked through disulfide bonds into dimers because, in the absence of reducing agent (DTT), monomers are not present, whereas after the addition of DTT, the monomers appear (Fig. 10B). The observed oligomeric state was not an experimental artifact, because it was present in all of the tested conditions, with or without thermal pretreatment (70 °C), which can induce protein aggregation. To conclude, Oatp1d1 monomers are organized into dimers through disulfide bonds, whereas dimers form oligomers independently of disulfide link. The results of the rescue experiment are consistent with the dimer formation in situ (Fig. 11). When Oatp1d1 was fused to mCitrine on the N-terminal part of the protein, Oatp1d1-mCitrine did not localize in the membrane (Fig. 11A), similar to the Oatp1d1-GFP (data not shown). The fluorescent tags probably interfere with the protein folding and thus its trafficking, which results in protein remaining in the nuclei and the cytosolic compartment (Fig 11A). However, when Oatp1d1 without the mCitrine tag and Oatp1d1 with mCitrine tag are contransfected in a 3:1 ratio, we detected green fluorescence in the membrane. This is confirmed by the colocalization with the red signal from the plasma membrane immunostaining, as described under “Experimental Procedures” (Fig. 11A). Furthermore, protein activity in the rescue experiment was the same as in the control (Oatp1d1-WT-transfected cells), whereas Oatp1d1-mCitrine was inactive as a consequence of its inability to localize into the cell membrane (Fig. 11B). These findings suggest that Oatp1d1 interacts with the Oatp1d1-mCitrine. As a result, the protein complex is active and localizes to the plasma membrane, at least in the dimeric form. Whether dimers or oligomers are present remains to be further investigated.
FIGURE 10.
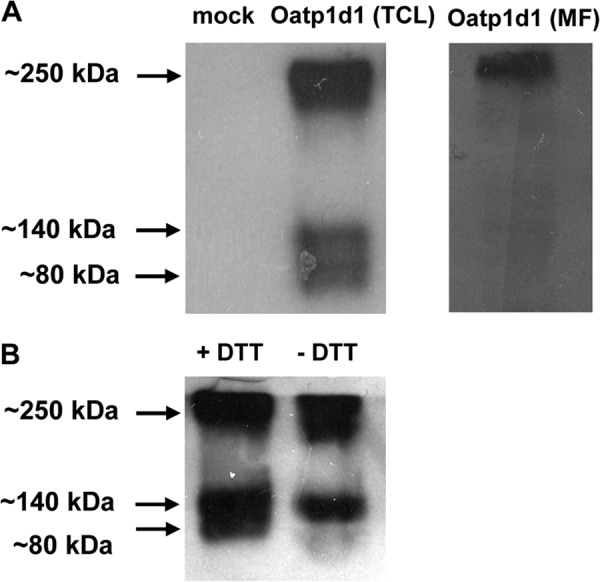
Oligomerization of Oatp1d1. A, Western blot analysis of total cell lysate (TCL) of HEK293/Oatp1d1-overexpressing cells shows three forms of Oatp1d1: monomeric form (∼80 kDa), dimeric form (∼150 kDa), and oligomeric form (∼250 kDa). Western blot analysis of the membrane fraction (MF) of HEK293/Oatp1d1-overexpressing cells after the cell surface biotinylation with Sulfo-NHS-LC-LC-biotin and isolation of cell surface-biotinylated proteins with hydrophilic streptavidin magnetic beads shows only the oligomeric form. Western blots were performed in the presence of the reducing agent DTT with anti-His antibody and visualized with chemiluminescence. B, Western blot analysis of total cell lysate with and without DTT shows that without DTT, oligomers and dimers are present, whereas after the addition of DTT, the monomeric form appears, indicating that monomers form dimers through disulfide bonds.
FIGURE 11.
Interaction of Oatp1d1-WT and Oatp1d1-mCitrine. A, cell localization of Oatp1d1 tagged on the N terminus with mCitrine (1d1/mCitrine) and cotransfection of Oatp1d1 without mCitrine and with mCitrine tag in a 3:1 ratio (1d1wt+1d1/mCitrine) obtained with immunofluorescence analysis by confocal microscopy. Plasma membranes are stained in red after binding of primary antibody Na,K-ATPase and Cy3-conjugated IgG secondary antibody (all anti-mouse). Nuclei are stained in blue with DAPI. White arrows indicate cell membrane localization of Oatp1d1. If the protein is localized to the membrane, the color turns to orange because of the overlap of green signal from the mCitrine tag and red stained plasma membranes. B, uptake of LY into the Oatp1d1-overexpressing cells in comparison with the HEK293 transiently transfected with either the empty vector pCS2-mCitrine or the Oatp1d1-mCitrine construct and after the cotransfection of Oatp1d1 without mCitrine and with mCitrine tag in a 3:1 ratio (Oatp1d1/Oatp1d1-mCitrine, 3:1). Transiently transfected HEK293 cells were incubated for 15 min with LY at 37°C. The reaction was stopped with two washing cycles in ice-cold PBS, and the cells were lysed in 0.1% SDS for 30 min. Data are expressed as -fold level of the LY uptake relative to the control (HEK293 cells transfected with the pcDNA3.1 empty vector). Each value represents the mean ± S.E. (error bars) from triplicate determinations.
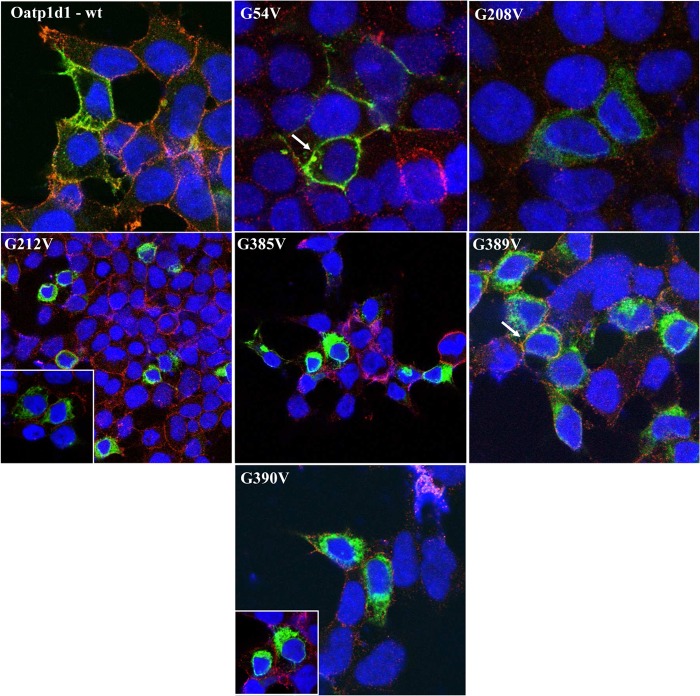
The next step was to identify motifs that are responsible for the interaction among monomers. We identified three distinct glycophorin A motifs (GXXXG): at amino acid positions 54–59 in the extracellular loop 1, at amino acid positions 208–212 in the TMD5, and at amino acid positions 385–389 (and/or 390) in the TMD8 of Oatp1d1. The glycophorin A motif is responsible for the dimer and oligomer formation of another SLC protein, the serotonin transporter (SERT) (27). Considering the high conservation of three GXXXG motifs within the OATP1 family of vertebrate phyla (data not shown), site-directed mutagenesis of glycine to valine residue was performed within the first motif, G54V (GXXXG); within the second motif, G208V and G212V (GXXXG); and within the third motif, G385V, G389V, and G390V (GXXXGG). We found that G208V and G212V, as well as G385V and G390V, are inactive and do not localize in the membrane (Fig. 12). On the contrary, G54V localizes in the membrane but is inactive. Western blots from total cell lysates showed that in comparison with the Oatp1d1-WT, where monomers (∼80 kDa), dimers (∼140 kDa), and oligomers (>200 kDa) are present, all GXXXG mutants (G208V, G212V, G385V, G389V, and G390V) do not show a >200 kDa band, whereas G208V does not have the dimeric band as well (Fig. 13).
FIGURE 12.
Cell localization of Oatp1d1 after mutations of conserved glycophorin motifs: G54V, G208V, G212V, G385V, G389C, and G390V. Images were obtained with immunofluorescence analysis by confocal microscopy. Immunocytochemistry was performed with FITC, which binds to the primary Xpress antibody and stains the protein in green. Nuclei are dyed in blue with DAPI, and plasma membranes are stained in red after binding of primary antibody Na,K-ATPase and Cy3-conjugated IgG secondary antibody (all anti-mouse). White arrows indicate examples where protein is present in the cell membrane. The color turns to orange due to the overlap of green and red, or it remains light green when overexpression of protein is dominant over red stained membranes. Cytosolic forms are seen as green areas in the cytoplasm.
FIGURE 13.
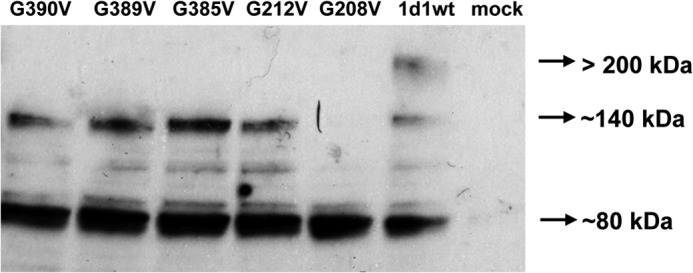
Protein expression of Oatp1d1 after mutations of conserved glycophorin motifs: G208V, G212V, G385V, G389C, and G390V. Western blot analysis of the total cell lysate (TCL) of HEK293/Oatp1d1-overexpressing cells shows three forms of Oatp1d1: monomeric form (∼80 kDa), dimeric form (∼140 kDa), and oligomeric form (>200 kDa). G208V is present as a monomer, whereas other mutants show monomeric and dimeric forms. Western blots were performed in the presence of the reducing agent DTT with anti-His antibody and visualized with chemiluminescence.
N-Glycosylation
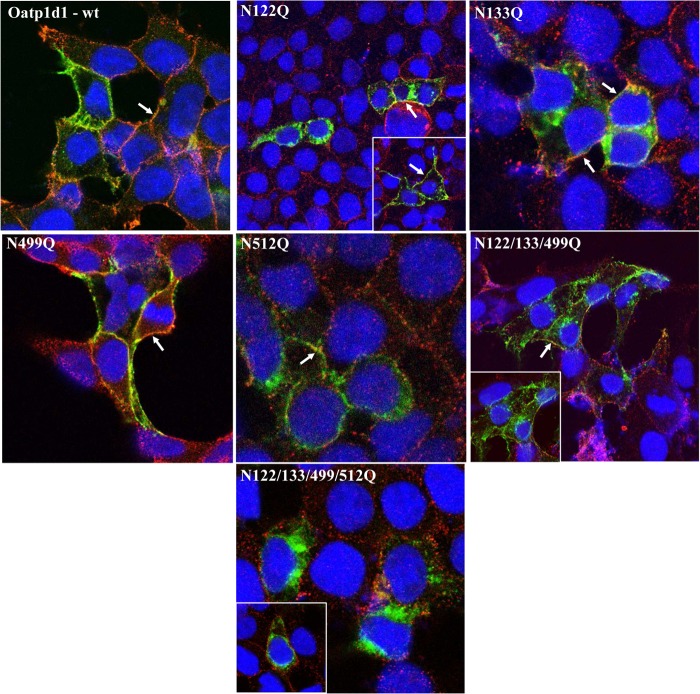
It has been shown that N-glycosylation plays an important role in protein folding of some mammalian OATPs/Oatps (28, 29). In order to determine if the N-glycosylation pattern is conserved within vertebrate phyla, we treated HEK293 cells overexpressing Oatp1d1 with tunicamycin and observed pronounced reduction in the protein transport activity. The uptake of both model substrates, E3S and LY, was reduced by 60% at 0.5–1 μg/ml tunicamycin (Fig. 14). Furthermore, tunicamycin treatment (0.5 μg/ml, 24 h) partly impaired Oatp1d1 membrane localization, which indicates the importance of N-glycosylation in membrane targeting of Oatp1d1. Subsequently, we aimed to identify the asparagine residues involved in glycosylation through the analysis of conservation of asparagine residues within the OATP1 subfamily in the vertebrate phyla. We found that Oatp1d1 has five predicted N-glycosylation sites at the amino acid positions Asn-122, -133, -499, -512, and -672. When we compared all OATP1 sequences from fish to mammals, we found that Asn-122 is conserved in all transporters; Asn-133, -499, and -512 are conserved in the majority of proteins, with the exception of few Oatp1c subfamily members; and Asn-672 appears only sporadically throughout the OATP1 family. Membrane topology prediction showed that all four conserved residues are located extracellularly, Asn-122 and -133 in extracellular loop 2 and Asn-499 and 512 in extracellular loop 5. After these four asparagines residues were changed to glutamine, kinetic parameters of LY transport for each mutant were determined, as well as their cellular localizations with immunostaining. N122Q and N133Q mutants showed significantly reduced transport rates (by 2- and 1.7-fold, respectively) in comparison with the Oatp1d1-WT, whereas their affinity remained unchanged (Table 3). Both mutants were present in the cytoplasm as well as in the plasma membrane (Fig. 15). N499Q showed a reduced transport rate (by 1.5-fold), whereas the N512Q transport rate remained unchanged in comparison with the Oatp1d1-WT (Table 3). N499Q localized mainly in the plasma membrane, whereas N512Q was found in the cytoplasm as well as in the plasma membrane (Fig. 15). The triple mutant (N122Q/N133Q/N499Q) showed reduced transport rate with unchanged affinity and was present in the cytoplasm as well as in the plasma membrane. However, when all four potential glycosylation sites were changed, membrane localization and transport activity were almost completely impaired (Fig. 15 and Table 3).
FIGURE 14.
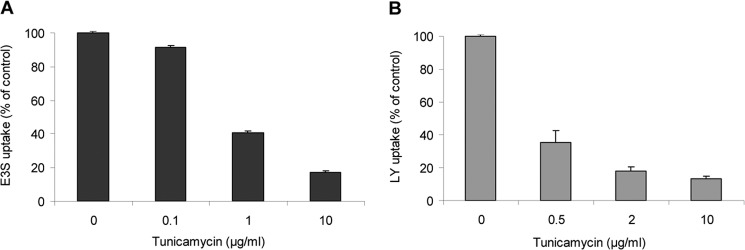
N-Glycosylation is important for membrane localization of Oatp1d1. Tunicamycin, a general inhibitor of N-glycosylation, reduced E3S (A) and LY (B) uptake in a dose-dependent manner and partly impaired membrane localization of Oatp1d1 as shown by immunofluorescence analysis (inset). Immunocytochemistry was performed after a 24-h exposure to tunicamycin (5 μg/ml), with FITC antibody (green) and nuclei stained with DAPI (blue). Uptake is expressed as a percentage relative to tunicamycin-non-treated Oatp1d1-transiently transfected HEK293 cells. Results represent means and S.E. (error bars) of three independent experiments.
TABLE 3.
Transport kinetics of zebrafish Oatp1d1 after disruption of four potential N-glycosylation sites (N122Q, N133Q, N499Q, and N512Q) and simultaneous mutation of all four asparagine residues (Asn-122/133/499/512)
Transport measurements were performed 24 h after transient transfection in HEK293 cells. Oatp1d1-overexpressing HEK293 cells were preincubated in the transport medium (145 mm NaCl, 3 mm KCl, 1 mm CaCl2, 0.5 mm MgCl2, 5 mm d-glucose, and 5 mm HEPES, pH 7.4) for 10 min at 37 °C. To assess transport, medium was removed, and the same medium containing the substrate was added. Concentration dependence of LY uptake is expressed as transport rate (nmol/mg protein/min) over LY concentration (μm) after a 15-min incubation with LY of varying concentrations. The uptake into vector-transfected HEK293 cells (mock cells) was subtracted to obtain transporter-specific uptake, and data were fitted in the GraphPad Prism version 5. Each value represents the mean ± S.E. from triplicate determinations of representative experiments (each experiment was repeated three times).
| Km (LY) | c.i. | Vm (LY) | c.i. | |
|---|---|---|---|---|
| Oatp1d1 WT | 28.3 | 23.9–32.6 | 127 | 119–135 |
| N122Q | 23.8 | 17.3–30.3 | 59.5 | 53.3–65.7 |
| N133Q | 24.8 | 19.2–30.4 | 76.9 | 70.1–83.7 |
| N499Q | 44.7 | 36.8–52.7 | 85.2 | 80.2–90.1 |
| N512Q | 44.7 | 30.7–58.7 | 111 | 99.2–122 |
| N122Q/N133Q/N499Q | 26.5 | 17.3–30.3 | 62.7 | 53.3–70.7 |
| N122Q/N133Q/N499Q/N512Q | 21.3 | 13.9–28.6 | 18.8 | 16.2–20.7 |
FIGURE 15.
Cell localization of Oatp1d1 after mutations of conserved N-glycosylation sites. Mutagenesis of N122Q, N133Q, N499Q, and N512Q, as well as simultaneous mutation of three (N122/133/499Q) and four asparagine residues (N122/133/499/512Q), respectively, was performed, and images were obtained with immunofluorescence analysis by confocal microscopy. Immunocytochemistry was performed with FITC, which binds to the primary Xpress antibody and stains the protein in green. Nuclei are dyed in blue with DAPI, and plasma membranes are stained in red after binding of primary antibody Na,K-ATPase and Cy3-conjugated IgG secondary antibody (all anti-mouse). White arrows indicate examples where protein is present in the cell membrane. The color turns to orange because of the overlap of green and red, or it remains light green when overexpression of protein is dominant over red-stained membranes. Cytosolic forms are seen as green areas in the cytoplasm.
Cholesterol Binding Domain
Considering that membrane cholesterol is important for the proper folding and function of membrane transporters (30, 31), we wanted to investigate whether Oatp1d1 contains any of the known cholesterol binding motifs and whether these motifs are conserved within the OATP1/Oatp1 family. We identified the presence of the CRAC domain ((L/V)X1–5YX1–5(R/K)), conserved in all OATP1/Oatp1 family members from fish to mammals, with the exception of the OATP1C/Oatp1c subfamily. In Oatp1d1, this domain is positioned from amino acid 180 to 190 and spans part of TMD4 and IL2 according to the predicted topology. After substitution of the central tyrosine residue in the CRAC motif for alanine (Y184A), the LY transport rate was reduced by ∼4-fold: Vmax = 12.1 ± 1.5 nmol/mg protein/min as opposed to 43.5 ± 6.2 nmol nmol/mg protein/min in the case of Oatp1d1-WT (Fig. 16A). On the contrary, the transport affinity of Oatp1d1-Y184A (Km = 13.0 ± 3.4 μm) increased by ∼2 fold in comparison with Oatp1d1-WT (Km = 27.8 ± 8 μm). Western blots of total cell lysates showed the same protein levels of Oatp1d1-Y184A as of Oatp1d1-WT. However, membrane localization revealed that part of Oatp1d1-Y184A was localized in the cytosol, which could indicate that the decrease in transport rate was a consequence of partially impaired membrane localization (Fig. 16B).
FIGURE 16.
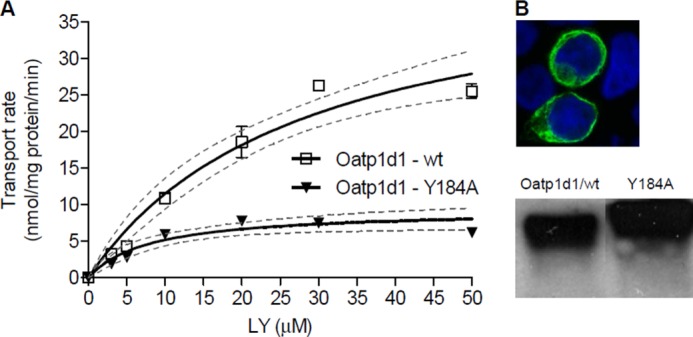
Mutation of tyrosine at position 184 as a part of the CRAC motif impacts membrane localization and transport activity of Oatp1d1. A, transport kinetics of Oatp1d1-Y184A in comparison with Oatp1d1-WT shows significant reduction in transport activity from Vm of 43.5 nmol/mg protein/min (c.i. 29.9–57.1) for Oatp1d1-WT to Vm of 12.14 nmol/mg protein/min (c.i. 8.8–15.5) for Oatp1d1-Y184A. B, partly impaired membrane localization of the Y184A mutant obtained by immunofluorescence analysis and Western blot stained with anti-His antibody shows a similar protein expression pattern between Oatp1d1-WT and Oatp1d1-Y184A cells. Immunocytochemistry was performed with FITC antibody (green) with nuclei stained with DAPI (blue), and samples were visualized on a confocal microscope.
DISCUSSION
Zebrafish (Danio rerio) is a widely recognized vertebrate model for the investigation of the roles of specific genes and signaling pathways and is the only vertebrate system that permits fast screens of phenotypic changes in response to genetic alterations. However, to understand the disposition of endogenous and foreign compounds in zebrafish, it is important to identify and characterize critical determinants of the absorption, distribution, metabolism, and elimination (ADME) processes. OATP/Oatp superfamily, which is a crucial part of ADME, has not been thoroughly investigated in fish species. We aimed to fill this gap with the characterization of a novel Oatp ortholog in zebrafish as well as to offer new insights into the functional evolution of OATP/Oatp transporters in vertebrate phyla.
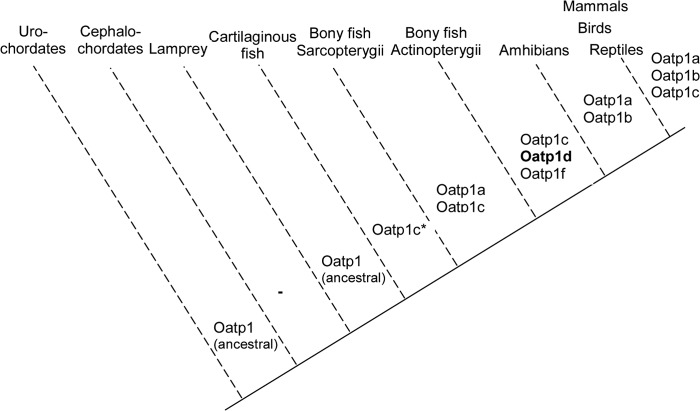
Through genome searches and phylogenetic analysis of SLCO/Slco genes in vertebrates, we have previously identified a fish-specific Oatp subfamily, Oatp1d, that includes two genes: the ubiquitously expressed Oatp1d1 and negligibly expressed Oatp1d2 (8). The schematic representation of OATP/Oatp evolution (Fig. 17) derived from phylogenetic analysis (Fig. 1 and supplemental Fig. 1) shows the emergence of Oatp1 subfamilies from urochordates to mammals. Diversification of the OATP1/Oatp1 family occurred after the emergence of jawed fish, which followed the second round of the whole genome duplication event after the split of jawless and jawed fish, but before the split of cartilaginous and bony fish (32). OATP1A/Oatp1a and OATP1B/Oatp1b subfamilies that emerged at the root of tetrapods (OATP1A/Oatp1a is found in primitive tetrapod Latimeria chalumnae) long after two rounds of whole genome duplication events in vertebrate evolution probably arose independently by chromosomal duplications. OATP1C/Oatp1c, as the only subfamily found in all vertebrate representatives from cartilaginous fish (little skate) to humans, might represent the sequence most similar to the common ancestor of the OATP1/Oatp1 family, as was suggested previously (33). In fish, three subfamilies are present: Oatp1c, Oatp1d, and Oatp1f. Summarizing our findings, four arguments led us to the hypothesis that Oatp1d1 in teleosts is functionally similar to OATP1A/Oatp1a and OATP1B/Oatp1b members in mammals: (i) the OATP1A/Oatp1a and OATP1B/Oatp1b subfamilies are not present in fish; (ii) the Oatp1d subfamily is found in all teleost genomes analyzed; (iii) Oatp1d2 is negligibly expressed throughout zebrafish tissues; and (iv) Oatp1f is a zebrafish-specific gene (Fig. 1), implying that the Oatp1f subfamily is irrelevant for the entire teleost class. Unfortunately, the syntenic relationship to mammalian OATP1/Oatp1 members cannot be determined, because Oatp1d1 is not yet mapped within the zebrafish chromosome 4.
FIGURE 17.
Evolution of OATP1/Oatp1 family in chordates; schematic representation. Mammals include humans, mice, and rats; birds include chicken (G. gallus) and zebra finch (T. guttata). Reptiles are represented with the anole lizard (A. carolinensis) and amphibians with the frog X. tropicalis. Teleosts included in the analysis are acanthopterygians: zebrafish (D. rerio), pufferfishes (T. nigroviridis and T. rubripes), stickleback (G. aculeatus), medaka (O. latipes), Atlantic cod (G. morhua), and a sarcopterygian L. chalumnae. Cartilaginous fish include the little skate (R. erinacea), and representatives of primitive chordates are cephalochordate lancelet (B. floridae) and urochordate sea squirt (C. intestinalis).
Our next step was to determine the Oatp1d1 substrate and inhibitor specificity. Based on the kinetic analysis, we propose that Oatp1d1 probably has one and the same substrate binding site for E3S and LY. In that sense, it is similar to OATP1A2, whereas OATP1B1 and probably OATP1B3 have two binding sites for E3S (34–37). Biphasic transport kinetics was also suggested for the transport of estradiol-17β-glucuronide and T4 by OATP1C1 (25, 36). The affinity of Oatp1d1 for E3S is more similar to that of OATP1A2 (Km = 6–35 μm) then to the skate Oatp1 member (Km = 61 ± 11 μm) and is several times higher than the affinities of OATP1B3 and OATP1C1 for E3S (21, 29, 33, 37).
We showed that zebrafish Oatp1d1 is a high affinity transporter of the conjugated steroid hormones E3S, estradiol-17β-glucuronide, and DHEAS, whereas the nonconjugated steroids estradiol, progesterone, androstenedione, dihydrotestosterone, and testosterone are potent inhibitors of Oatp1d1 (Table 2). Considering high expression of Oatp1d1 in liver, we propose that Oatp1d1 is crucial for the uptake and subsequent elimination of excess steroid hormone metabolites through bile, similar to the role of OATP1A2, OATP1B1, and OATP1B3 (3). Furthermore, its high expression in testes implies possible involvement in the uptake of DHEAS as a precursor for androgen (and estrogen) synthesis in gonads, a role that the OATP6/Oatp6 family has in mammalian testes (38, 39). Additionally, uptake of DHEAS by Oatp1d1 may be of critical importance in the brain, considering its action as a neurosteroid and high expression of Oatp1d1 in the brain (similar to OATP1A2). Inhibition of Oatp1d1 by nonconjugated steroids could reduce the uptake of conjugated steroid hormones in target tissues, depending on the fine hormonal balance in the plasma. In that sense, transporters, and more specifically Oatp1d1, would be involved in the negative feedback loop regulation of steroid hormone synthesis (40). Corticosteroid metabolism is also in part regulated by transporters. Oatp1d1, similarly to OATP1A2, transports cortisol, a crucial hormone in fish that acts as both glucocorticoid and mineralocorticoid, given that fish do not possess corticosterone and aldosterone (40, 41). In summary, our data strongly suggest that the role of OATP/Oatp transporters in steroid catabolism is conserved from fish to mammals and that Oatp1d1 fulfills that role in zebrafish.
The most pronounced difference between mammalian OATP1/Oatp1 members and zebrafish Oatp1d1 is the fact that Oatp1d1 does not transport the thyroid hormones T4 and T3 (Fig. 4 and Table 2). In mammals, thyroids are primarily transported by OATP1C1 and OATP1A2 in the brain, whereas OATP1B1 is crucial for their elimination through liver (5, 42). Considering that Oatp1d1 is inhibited by T3 and no allosteric interaction for Oatp1d1 was found with the wide range of interactors, T3 possibly enters the substrate binding pocket without actually being transported. The substrate binding site of OATP1A2 in mammals possibly evolved in order to transport thyroid hormones. In fish, however, this role might be fulfilled by Oatp3a1 and Oatp3a2, which are highly expressed in zebrafish brain, especially considering that the OATP3/Oatp3 family is involved in thyroid uptake in mammalian brain (8, 43).
Another major group of OATP1/Oatp1 substrates includes bile salts. Bile acid metabolism is conserved within the vertebrate lineage, with certain variations in bile content. Bile acid uptake from blood into the liver is largely mediated by sodium taurocholate cotransporting polypeptide, accounting for 70% of the bile acid uptake in humans. The rest is mediated by OATPs, namely OATP1A2, OATP1B1, and OATP1B3. The dominant forms of bile acids in teleosts and mammals are cholic and deoxycholic acid and their glyco- and tauroconjugates. However, in cyprinid fishes, unlike in other teleost species, the dominant bile alcohol is 5α-cyprinol, a C27 bile alcohol (44). We have shown that in zebrafish, cholate, deoxycholate, and their taurine conjugates are inhibitors of Oatp1d1 (Table 2). Considering significant structural differences between these bile salts and 5α-cyprinol, we propose that Oatp1d1 might transport cyprinol. Unfortunately, this hypothesis could not be tested in this study due to commercial unavailability of 5α-cyprinol. In favor of the hypothesis that Oatp1d1 is important for cyprinol excretion into bile is the fact that Oatp1d1 is the only Oatp1 present in zebrafish liver, and the OATP1/Oatp1 subfamily is crucial for bile acid homeostasis in mammals (8).
Comparison of substrate and inhibitor preferences of Oatp1d1 with mammalian OATP1/Oatp1 transporters clearly indicates that zebrafish Oatp1d1 is more similar to OATP1A2, OATP1B1, and OATP1B3 then to OATP1C. Nevertheless, notable differences are present in terms of its substrate selectivity and affinity in comparison with OATP1A2, OATP1B1, and OATP1B3. First, Oatp1d1 does not transport bilirubin, T3, T4, bile salts, and ouabain. Second, differences also occur in the substrate affinity; Oatp1d1 shows higher affinity for DHEAS in comparison with mammalian OATP1/Oatp1 members. Additionally, the inhibition potency of model compounds warfarin, gemfibrozil, and fenofibrate is higher in zebrafish Oatp1d1. Because the skate Oatp1 member, which we annotated as Oatp1c1, was not characterized in detail (7, 21), it can be compared only in terms of E3S, bromosulfophtalein, and ouabain transport, which generally showed similarities between skate Oatp1c1 and zebrafish Oatp1d1. In summary, Oatp1d1 appears to be crucial for the balance of steroid hormones in zebrafish and might be responsible for uptake of bile alcohol cyprinol and conjugated bilirubin in zebrafish liver.
The transport mechanism of OATPs/Oatps has not been elucidated conclusively, although the anion antiport has been suggested as a presumable driving force. The majority of OATPs/Oatps, including OATP1A2, OATP1B1, and OATP1B3, function as [HCO3−] antiporters (15, 26, 45, 46). However, some rat transporters, namely Oatp1a1 and Oatp1a4, use glutathione for the antiport (47, 48). Therefore, we wanted to address the transport mechanism of Oatp1d1 and gain insight into the evolutionary conservation of OATP1/Oatp1 transport in vertebrate phyla. Oatp1d1 activity was affected by pHo and pHi changes, which in turn induced changes in proton fluxes across the plasma membrane (Figs. 7 (A and B) and 8A). These proton fluxes are linked to [HCO3−] concentrations. When extracellular [H+] concentration is increased (pHo 5.5), [HCO3−] with excess [H+] forms H2O and CO2, which in turn stimulates the outwardly directed [HCO3−] gradient. The opposite effect is achieved when pHi < pHo after intracellular acidification or extracellular alkalinization (pHo 8.0). In our experiments, acidification of the extracellular space (pHo 5.5) significantly increased the Oatp1d1 transport rate, whereas at the same time, apparent Km was not significantly changed (Fig. 8A). This suggests that the inwardly directed proton gradient enhances protein activity, either through [H+] cotransport (uptake) or through [HCO3−] or [OH−] antiport. Because [H+] cotransport or [OH−] antiport as driving forces for OATP/Oatp transport have not been reported for any of the OATPs/Oatps studied, we regard it as less probable then [HCO3−] antiport, which was previously proven for several mammalian OATPs/Oatps (26, 45). In contrast, when [H+] gradient was reversed (pHi < pHo) through intracellular acidification or extracellular alkalization, we observed significant reduction in Oatp1d1 transport activity (Fig. 7B). To summarize, when the proton gradient is inwardly directed, [HCO3−] is outwardly directed, and Oatp1d1 activity is stimulated. The opposite effect was observed when the proton gradient was outwardly directed and Oatp1d1 activity was significantly reduced. Altogether, our results suggest that Oatp1d1 is pH gradient-dependent, which is an indication of the [HCO3−] antiport, similar to the mammalian OATP/Oatps.
Because the pH dependence of protein activity could be a consequence of the protonation of histidine residues, we analyzed the conservation of relevant His residues within the OATP1/Oatp1 family. Through mutagenesis studies, we showed that His-102 is not involved in the pH sensitivity of the transport (Fig. 8B), unlike in mammalian transporters (26). However, we showed that protonation of His-79 in the IL1 is crucial for Oatp1d1 activity (Fig. 9A) and is in part responsible for the reduction of transport activity at acidified intracellular pH (Fig. 9B). Considering that His-79 is highly conserved within the vertebrate OATP1/Oatp1 family, this new finding suggests that His-79 may be important for the transport activity of mammalian OATPs/Oatps as well.
N-Glycosylation is known to be involved in post-translational processing of mammalian OATPs/Oatps (49). Considering that each individual mutation of four highly conserved potential glycosylation sites in Oatp1d1 only partly impaired membrane localization and protein activity, whereas only the quadruple mutant was completely inactive and remained in the cytosol (Table 3 and Fig. 15), we propose that Asn-122, -133, -499, and -512 are responsible for protein glycosylation, which in turn influences membrane targeting and thus protein activity. Interestingly, when only Asn-512 was modified, the protein transport rate remained unchanged. However, the triple mutant that excluded Asn-512 (Asn-122/133/499) was active (with 50% reduced transport rate) and partly localized in the membrane. When Asn-512 was also changed (in the quadruple mutant), the protein was inactive and remained in the cytosol, which indicates that Asn-512 is also involved in the glycosylation, but in the N512Q mutant, the other three residues compensate for the inability of glycan binding to Asn-512. A similar pattern was observed for rat Oatp1a1, where residues Asn-124, -135, and -492, which correspond to the residues Asn-122, -133, and -499 in Oatp1d1, are responsible for protein glycosylation (28, 49), whereas only Asn-133 was identified as crucial for the glycosylation of human OATP1A2. The importance of glycosylation for protein folding and membrane targeting was observed for human OATP2B1 (50), and Oatp1d1 is the fourth OATP to be investigated in terms of N-linked glycosylation impact on protein activity and localization. Based on the high degree of conservation of residues Asn-122, Asn-133, Asn-499, and Asn-512 within the OATP1 subfamily of vertebrate phyla, we propose that N-glycosylation of OATPs/Oatps is an important factor for membrane localization with N-linked carbohydrate chains in extracellular loops 2 and 5 at residues Asn-122, -133, -499, and -512 in the case of the OATP1 family.
The dependence of OATP/Oatps on membrane cholesterol has not been investigated so far. The CRAC motif is conserved in all OATP1/Oatp1 family members from fish to mammals, with the exception of OATP1C/Oatp1c subfamily. Furthermore, this motif is known to be present in many proteins that interact with cholesterol (51). Because our data show that mutation in the CRAC motif (Y184A) significantly impairs zebrafish Oatp1d1 membrane targeting (Fig. 12B), we propose that this motif is important for the localization of Oatp1d1 in the plasma membrane, possibly through the interaction with membrane cholesterol. Considering that the CRAC motif is well conserved within the OATP1/Oatp1 family, we suggest its importance for the membrane localization of mammalian OATPs, possibly through the interaction with membrane cholesterol, a topic that remains to be addressed in further studies.
Oatp1d1 is present in the plasma membrane as a dimer and potentially as a higher order oligomer. Monomers are linked into dimers through disulfide bonds, and dimers organize into oligomers independent of disulfide bonds (Fig. 10, A and B). Dimerization through disulfide bonds has been shown for OATP2B1 (52). Considering that cotransfection of Oatp1d1-WT and Oatp1d1-mCitrine showed plasma membrane localization (Fig. 11), Oatp1d1-WT is present in the membrane at least in the dimeric form. Although the surface biotinylation experiment is an indication of the presence of only the oligomeric form in the plasma membrane (Fig. 10A), due to the possibility of chemical cross-linking, it is not conclusive. However, we have a strong indication that highly conserved glycophorin A motifs (GXXXG) within TMD5 (residues 208–212) and TMD8 (residues 385–390) are involved in the oligomer formation, considering that change in these motifs impairs protein activity due to the inability to localize in the plasma membrane and considering the absence of oligomeric form in total cell lysates after their mutation (Figs. 12 and 13). This motif has been found to be responsible for the dimer and oligomer formation of another SLC transporter, SERT (27). Overall, although more than 35% of all cellular proteins act as oligomers, investigation of oligomeric forms of membrane proteins has been scarce (53, 54), probably due to the fact that oligomers are “lost” on Western blots due to the often harsh experimental conditions. However, the oligomeric state is preferable over monomers or dimers, due to the allosteric regulation between monomers (52). In addition, members of SLC22, a closely related transporter superfamily, human OAT1 and rat Oat1, Oct1, and Oct2 form homo-oligomers (55, 56). In the case of rat Oct1 and Oct2, monomeric units are linked through disulfide bond(s) (56), whereas OAT1 oligomers are formed independently of a disulfide link (55), similar to zebrafish Oatp1d1.
In summary, we have characterized a novel Oatp in zebrafish, Oatp1d1. This is the first characterization of an Slco transporter in zebrafish, which provides important insights into the functional evolution of the OATP1/Oatp1 family. Diversification of the OATP1/Oatp1 family occurred after the emergence of jawed fish; the Oatp1d subfamily emerged in teleosts and is absent in tetrapods, whereas OATP1A/Oatp1a and OATP1B/Oatp1b subfamilies emerged at the root of tetrapods. Substrate specificity analysis and tissue expression analysis revealed similarities with mammalian OATP1A/Oatp1a and OATP1B/Oatp1b subfamily members and differences from the mammalian OATP1C/Oatp1c subfamily. We suggest an important role of Oatp1d1 in hormonal balance in fish as well as its involvement in elimination of steroid hormone metabolites and foreign compounds through bile. Based on the results of extracellular and intracellular pH manipulations, we propose that Oatp1d1 activity is pH gradient-dependent. Analysis of evolutionary conservation and importance of structural properties revealed that (i) His-79 located in the IL3 is conserved within the OATP1/Oatp1 family and is crucial for transport activity; (ii) the N-glycosylation pattern is conserved within the OATP1/Oatp1 family and is important for membrane localization with the four N-linked glycosylation sites involved (Asn-122, -133, -499, and -512); (iii) the evolutionarily conserved CRAC motif is important for the membrane localization of Oatp1d1; and finally (iv) our results show that Oatp1d1 is present in the plasma membrane as a dimer and possibly as a higher order oligomer, with highly conserved glycophorin motifs in TMD5 and TMD8 involved in the oligomer formation.
This work was supported by Ministry for Science, Technology, and Sports of the Republic of Croatia Project 098-0982934-2745 and by Swiss National Science Foundation (SNSF) Grant SCOPES-IZ73ZO_128025/1.

This article contains supplemental Table 1 and Fig. 1.
- OATP and Oatp
- organic anion-transporting polypeptide (in humans and other species, respectively)
- T3
- triiodothyronine
- T4
- thyroxine
- CRAC
- cholesterol recognition interaction amino acid consensus
- E3S
- [3H]estrone 3-sulfate
- LY
- Lucifer yellow
- BCECF
- 2′,7′-bis-(2-carboxyethyl)-5-(and-6)-carboxyfluorescein acetoxymethyl ester
- ADME
- absorption, distribution, metabolism, and elimination
- DHEAS
- dehydroepiandrosterone sulfate
- c.i.
- confidence interval
- TMDn
- transmembrane domain n
- ILn
- intracellular loop n.
REFERENCES
- 1. Hagenbuch B., Meier P. J. (2004) Organic anion transporting polypeptides of the OATP/SLC21 family. Phylogenetic classification as OATP/SLCO superfamily, new nomenclature and molecular/functional properties. Pflugers Arch. 447, 653–665 [DOI] [PubMed] [Google Scholar]
- 2. Badagnani I., Castro R. A., Taylor T. R., Brett C. M., Huang C. C., Stryke D., Kawamoto M., Johns S. J., Ferrin T. E., Carlson E. J., Burchard E. G., Giacomini K. M. (2006) Interaction of methotrexate with organic-anion transporting polypeptide 1A2 and its genetic variants. J. Pharmacol. Exp. Ther. 318, 521–529 [DOI] [PubMed] [Google Scholar]
- 3. Hagenbuch B., Gui C. (2008) Xenobiotic transporters of the human organic anion transporting polypeptides (OATP) family. Xenobiotica 38, 778–801 [DOI] [PubMed] [Google Scholar]
- 4. Roth M., Obaidat A., Hagenbuch B. (2012) OATPs, OATs and OCTs. The organic anion and cation transporters of the SLCO and SLC22A gene superfamilies. Br. J. Pharmacol. 165, 1260–1287 [DOI] [PMC free article] [PubMed] [Google Scholar]
- 5. van der Deure W. M., Peeters R. P., Visser T. J. (2010) Molecular aspects of thyroid hormone transporters, including MCT8, MCT10, and OATPs, and the effects of genetic variation in these transporters. J. Mol. Endocrinol. 44, 1–11 [DOI] [PubMed] [Google Scholar]
- 6. Nakao N., Takagi T., Iigo M., Tsukamoto T., Yasuo S., Masuda T., Yanagisawa T., Ebihara S., Yoshimura T. (2006) Possible involvement of organic anion transporting polypeptide 1c1 in the photoperiodic response of gonads in birds. Endocrinology 147, 1067–1073 [DOI] [PubMed] [Google Scholar]
- 7. Meier-Abt F., Hammann-Hänni A., Stieger B., Ballatori N., Boyer J. L. (2007) The organic anion transport polypeptide 1d1 (Oatp1d1) mediates hepatocellular uptake of phalloidin and microcystin into skate liver. Toxicol. Appl. Pharmacol. 218, 274–279 [DOI] [PubMed] [Google Scholar]
- 8. Popovic M., Zaja R., Smital T. (2010) Organic anion transporting polypeptides (OATP) in zebrafish (Danio rerio). Phylogenetic analysis and tissue distribution. Comp. Biochem. Physiol. A Mol. Integr. Physiol. 155, 327–335 [DOI] [PubMed] [Google Scholar]
- 9. Marchler-Bauer A., Anderson J. B., Cherukuri P. F., DeWeese-Scott C., Geer L. Y., Gwadz M., He S., Hurwitz D. I., Jackson J. D., Ke Z., Lanczycki C. J., Liebert C. A., Liu C., Lu F., Marchler G. H., Mullokandov M., Shoemaker B. A., Simonyan V., Song J. S., Thiessen P. A., Yamashita R. A., Yin J. J., Zhang D., Bryant S. H. (2005) CDD. A conserved domain database for protein classification. Nucleic Acids Res. 33, D192–D196 [DOI] [PMC free article] [PubMed] [Google Scholar]
- 10. Meier-Abt F., Mokrab Y., Mizuguchi K. (2005) Organic anion transporting polypeptides of the OATP/SLCO superfamily. Identification of new members in nonmammalian species, comparative modeling and a potential transport mode. J. Membr. Biol. 208, 213–227 [DOI] [PubMed] [Google Scholar]
- 11. Edgar R. C. (2004) MUSCLE. Multiple sequence alignment with high accuracy and high throughput. Nucleic Acids Res. 32, 1792–1797 [DOI] [PMC free article] [PubMed] [Google Scholar]
- 12. Guindon S., Gascuel O. (2003) A simple, fast, and accurate algorithm to estimate large phylogenies by maximum likelihood. Syst. Biol. 52, 696–704 [DOI] [PubMed] [Google Scholar]
- 13. Anisimova M., Gascuel O. (2006) Approximate likelihood-ratio test for branches. A fast, accurate, and powerful alternative. Syst. Biol. 55, 539–552 [DOI] [PubMed] [Google Scholar]
- 14. Tom R., Bisson L., Durocher Y. (2008) Transfection of adherent HEK293-EBNA1 cells in a six-well plate with branched PEI for production of recombinant proteins. CSH Protoc. 10.1101/pdb.prot4978 [DOI] [PubMed] [Google Scholar]
- 15. Kobayashi D., Nozawa T., Imai K., Nezu J., Tsuji A., Tamai I. (2003) Involvement of human organic anion transporting polypeptide OATP-B (SLC21A9) in pH-dependent transport across intestinal apical membrane. J. Pharmacol. Exp. Ther. 306, 703–708 [DOI] [PubMed] [Google Scholar]
- 16. Bendayan R., Lo B., Silverman M. (1994) Characterization of cimetidine transport in LLCPKI cells. J. Am. Soc. Nephrol. 5, 75–84 [DOI] [PubMed] [Google Scholar]
- 17. Hong M., Schlichter L., Bendayan R. (2001) A novel zidovudine uptake system in microglia. J. Pharmacol. Exp. Ther. 296, 141–149 [PubMed] [Google Scholar]
- 18. Boyarsky G., Hanssen C., Clyne L. A. (1996) Superiority of in vitro over in vivo calibrations of BCECF in vascular smooth muscle cells. FASEB J. 10, 1205–1212 [DOI] [PubMed] [Google Scholar]
- 19. Xiao Y.-H., Yin M.-H., Hou L., Luo M., Pei Y. (2007) Asymmetric overlap extension PCR method bypassing intermediate purification and the amplification of wild-type template in site-directed mutagenesis. Biotechnol. Lett. 29, 925–930 [DOI] [PubMed] [Google Scholar]
- 20. Yao J., Hong W., Huang J., Zhan K., Huang H., Hong M. (2012) N-Glycosylation dictates proper processing of organic anion transporting polypeptide 1B1. PloS One 7, e52563. [DOI] [PMC free article] [PubMed] [Google Scholar]
- 21. Cai S.-Y., Wang W., Soroka C. J., Ballatori N., Boyer J. L. (2002) An evolutionarily ancient Oatp. Insights into conserved functional domains of these proteins. Am. J. Physiol. Gastrointest. Liver Physiol. 282, G702–G710 [DOI] [PubMed] [Google Scholar]
- 22. Yamazaki M., Li B., Louie S. W., Pudvah N. T., Stocco R., Wong W., Abramovitz M., Demartis A., Laufer R., Hochman J. H., Prueksaritanont T., Lin J. H. (2005) Effects of fibrates on human organic anion-transporting polypeptide 1B1-, multidrug resistance protein 2- and P-glycoprotein-mediated transport. Xenobiotica 35, 737–753 [DOI] [PubMed] [Google Scholar]
- 23. Gui C., Wahlgren B., Lushington G. H., Hagenbuch B. (2009) Identification, Ki determination and CoMFA analysis of nuclear receptor ligands as competitive inhibitors of OATP1B1-mediated estradiol-17β-glucuronide transport. Pharmacol. Res. 60, 50–56 [DOI] [PMC free article] [PubMed] [Google Scholar]
- 24. Westholm D. E., Salo D. R., Viken K. J., Rumbley J. N., Anderson G. W. (2009) The blood-brain barrier thyroxine transporter organic anion-transporting polypeptide 1c1 displays atypical transport kinetics. Endocrinology 150, 5153–5162 [DOI] [PubMed] [Google Scholar]
- 25. Kindla J., Müller F., Mieth M., Fromm M. F., König J. (2011) Influence of non-steroidal anti-inflammatory drugs on organic anion transporting polypeptide (OATP) 1B1- and OATP1B3-mediated drug transport. Drug Metab. Dispos. 39, 1047–1053 [DOI] [PubMed] [Google Scholar]
- 26. Leuthold S., Hagenbuch B., Mohebbi N., Wagner C. A., Meier P. J., Stieger B. (2009) Mechanisms of pH-gradient driven transport mediated by organic anion polypeptide transporters. Am. J. Physiol. Cell Physiol. 296, C570–C582 [DOI] [PubMed] [Google Scholar]
- 27. Horschitz S., Lau T., Schloss P. (2008) Glycine residues G338 and G342 are important determinants for serotonin transporter dimerization and cell surface expression. Neurochem. Int. 52, 770–775 [DOI] [PubMed] [Google Scholar]
- 28. Lee T. K., Koh A. S., Cui Z., Pierce R. H., Ballatori N. (2003) N-glycosylation controls functional activity of Oatp1, an organic anion transporter. Am. J. Physiol. Gastrointest. Liver Physiol. 285, G371–G381 [DOI] [PubMed] [Google Scholar]
- 29. Lee W., Glaeser H., Smith L. H., Roberts R. L., Moeckel G. W., Gervasini G., Leake B. F., Kim R. B. (2005) Polymorphisms in human organic anion-transporting polypeptide 1A2 (OATP1A2). Implications for altered drug disposition and central nervous system drug entry. J. Biol. Chem. 280, 9610–9617 [DOI] [PubMed] [Google Scholar]
- 30. Storch C. H., Ehehalt R., Haefeli W. E., Weiss J. (2007) Localization of the human breast cancer resistance protein (BCRP/ABCG2) in lipid rafts/caveolae and modulation of its activity by cholesterol in vitro. J. Pharmacol. Exp. Ther. 323, 257–264 [DOI] [PubMed] [Google Scholar]
- 31. Molina H., Azocar L., Ananthanarayanan M., Arrese M., Miquel J. F. (2008) Localization of the sodium-taurocholate cotransporting polypeptide in membrane rafts and modulation of its activity by cholesterol in vitro. Biochim. Biophys. Acta 1778, 1283–1291 [DOI] [PubMed] [Google Scholar]
- 32. Froschauer A., Braasch I., Volff J. (2006) Fish genomes, comparative genomics and vertebrate evolution. Curr. Genomics 7, 43–57 [Google Scholar]
- 33. Pizzagalli F. (2002) Identification of a novel human organic anion transporting polypeptide as a high affinity thyroxine transporter. Mol. Endocrinol. 16, 2283–2296 [DOI] [PubMed] [Google Scholar]
- 34. Tamai I., Nezu J., Uchino H., Sai Y., Oku A., Shimane M., Tsuji A. (2000) Molecular identification and characterization of novel members of the human organic anion transporter (OATP) family. Biochem. Biophys. Res. Commun. 273, 251–260 [DOI] [PubMed] [Google Scholar]
- 35. Noé J., Portmann R., Brun M. E., Funk C. (2007) Substrate-dependent drug-drug interactions between gemfibrozil, fluvastatin and other organic anion-transporting peptide (OATP) substrates on OATP1B1, OATP2B1, and OATP1B3. Drug Metab. Dispos. 35, 1308–1314 [DOI] [PubMed] [Google Scholar]
- 36. Roth M., Araya J. J., Timmermann B. N., Hagenbuch B. (2011) Isolation of modulators of the liver-specific organic anion-transporting polypeptides (OATPs) 1B1 and 1B3 from Rollinia emarginata Schlecht (Annonaceae). J. Pharmacol. Exp. Ther. 339, 624–632 [DOI] [PMC free article] [PubMed] [Google Scholar]
- 37. Hirano M., Maeda K., Shitara Y., Sugiyama Y. (2006) Drug-drug interaction between pitavastatin and various drugs via OATP1B1. Drug Metab. Dispos. 34, 1229–1236 [DOI] [PubMed] [Google Scholar]
- 38. Suzuki T., Onogawa T., Asano N., Mizutamari H., Mikkaichi T., Tanemoto M., Abe M., Satoh F., Unno M., Nunoki K., Suzuki M., Hishinuma T., Goto J., Shimosegawa T., Matsuno S., Ito S., Abe T. (2003) Identification and characterization of novel rat and human gonad-specific organic anion transporters. Mol. Endocrinol. 17, 1203–1215 [DOI] [PubMed] [Google Scholar]
- 39. Klaassen C. D., Lu H. (2008) Xenobiotic transporters. Ascribing function from gene knockout and mutation studies. Toxicol. Sci. 101, 186–196 [DOI] [PubMed] [Google Scholar]
- 40. James M. O. (2011) Steroid catabolism in marine and freshwater fish. J. Steroid Biochem. Mol. Biol. 127, 167–175 [DOI] [PubMed] [Google Scholar]
- 41. Pippal J. B., Cheung C. M., Yao Y.-Z., Brennan F. E., Fuller P. J. (2011) Characterization of the zebrafish (Danio rerio) mineralocorticoid receptor. Mol. Cell Endocrinol. 332, 58–66 [DOI] [PubMed] [Google Scholar]
- 42. Fujiwara K., Adachi H., Nishio T., Unno M., Tokui T., Okabe M., Onogawa T., Suzuki T., Asano N., Tanemoto M., Seki M., Shiiba K., Suzuki M., Kondo Y., Nunoki K., Shimosegawa T., Iinuma K., Ito S., Matsuno S., Abe T. (2001) Identification of thyroid hormone transporters in humans. Different molecules are involved in a tissue-specific manner. Endocrinology 142, 2005–2012 [DOI] [PubMed] [Google Scholar]
- 43. Huber R. D., Gao B., Sidler Pfändler M.-A., Zhang-Fu W., Leuthold S., Hagenbuch B., Folkers G., Meier P. J., Stieger B. (2007) Characterization of two splice variants of human organic anion transporting polypeptide 3A1 isolated from human brain. Am. J. Physiol. Cell Physiol. 292, C795–C806 [DOI] [PubMed] [Google Scholar]
- 44. Hagey L. R., Lida T., Tamegai H., Ogawa S., Une M., Asahina K., Mushiake K., Goto T., Mano N., Goto J., Krasowski M. D., Hofmann A. F. (2010) Major biliary bile acids of the Medaka (Oryzias latipes). 25R- and 25S-epimers of 3α,7α,12α-trihydroxy-5β-cholestanoic acid. Zool. Sci. 27, 565–573 [DOI] [PMC free article] [PubMed] [Google Scholar]
- 45. Martinez-Becerra P., Briz O., Romero M. R., Macias R. I. R., Perez M. J., Sancho-Mateo C., Lostao M. P., Fernandez-Abalos J. M., Marin J. J. G. (2011) Further characterization of the electrogenicity and pH sensitivity of the human organic anion-transporting polypeptides OATP1B1 and OATP1B3. J. Pharmacol. Exp. Ther. 79, 596–607 [DOI] [PubMed] [Google Scholar]
- 46. Satlin L. M., Amin V., Wolkoff A. W. (1997) Organic anion transporting polypeptide mediates organic anion/HCO3− exchange. J. Biol. Chem. 272, 26340–26345 [DOI] [PubMed] [Google Scholar]
- 47. Li L., Lee T. K., Meier P. J., Ballatori N. (1998) Identification of glutathione as a driving force and leukotriene C4 as a substrate for oatp1, the hepatic sinusoidal organic solute transporter. J. Biol. Chem. 273, 16184–16191 [DOI] [PubMed] [Google Scholar]
- 48. Li L., Meier P. J., Ballatori N. (2000) Oatp2 mediates bidirectional organic solute transport. A role for intracellular glutathione. Mol. Pharmacol. 58, 335–340 [DOI] [PubMed] [Google Scholar]
- 49. Wang P., Hata S., Xiao Y., Murray J. W., Wolkoff A. W. (2008) Topological assessment of oatp1a1. A 12-transmembrane domain integral membrane protein with three N-linked carbohydrate chains. Am. J. Physiol. Gastrointest. Liver Physiol. 294, G1052–G1059 [DOI] [PubMed] [Google Scholar]
- 50. Tschantz W. R., Pfeifer N. D., Meade C. L., Wang L., Lanzetti A., Kamath A. V., Berlioz-Seux F., Hashim M. F. (2008) Expression, purification and characterization of the human membrane transporter protein OATP2B1 from Sf9 insect cells. Protein Expr. Purif. 57, 163–171 [DOI] [PubMed] [Google Scholar]
- 51. Jafurulla M., Tiwari S., Chattopadhyay A. (2011) Identification of cholesterol recognition amino acid consensus (CRAC) motif in G-protein coupled receptors. Biochem. Biophys. Res. Commun. 404, 569–573 [DOI] [PubMed] [Google Scholar]
- 52. Hänggi E., Grundschober A. F., Leuthold S., Meier P. J., St.-Pierre M. V. (2006) Functional analysis of the extracellular cysteine residues in the human organic anion transporting polypeptide, OATP2B1. Mol. Pharmacol. 70, 806–817 [DOI] [PubMed] [Google Scholar]
- 53. Ali M. H., Imperiali B. (2005) Protein oligomerization. How and why. Bioorg. Med. Chem. 13, 5013–5020 [DOI] [PubMed] [Google Scholar]
- 54. Goodsell D. S., Olson A. J. (2000) Structural symmetry and protein function. Annu. Rev. Biophys. Biomol. Struct. 29, 105–153 [DOI] [PubMed] [Google Scholar]
- 55. Hong M., Xu W., Yoshida T., Tanaka K., Wolff D. J., Zhou F., Inouye M., You G. (2005) Human organic anion transporter hOAT1 forms homooligomers. J. Biol. Chem. 280, 32285–32290 [DOI] [PubMed] [Google Scholar]
- 56. Keller T., Egenberger B., Gorboulev V., Bernhard F., Uzelac Z., Gorbunov D., Wirth C., Koppatz S., Dötsch V., Hunte C., Sitte H. H., Koepsell H. (2011) The large extracellular loop of organic cation transporter 1 influences substrate affinity and is pivotal for oligomerization. J. Biol. Chem. 286, 37874–37886 [DOI] [PMC free article] [PubMed] [Google Scholar]


