

Background: Glycerophosphocholine (GroPCho) is a phospholipid metabolite found throughout the human body.
Results: Loss of Git3 and Git4 in C. albicans abolishes GroPCho transport, and Git3-deficient cells exhibit reduced virulence.
Conclusion: The major GroPCho transporter, Git3, is required for full virulence.
Significance: This report is the first to identify a eukaryotic GroPCho-specific transporter and the first to implicate GroPCho utilization in pathogenicity.
Keywords: Candida albicans, Pathogenesis, Phosphatidylcholine, Phospholipid Turnover, Transport, Yeast Genetics, Glycerophosphocholine, Phospholipid Metabolite
Abstract
Candida albicans contains four ORFs (GIT1,2,3,4) predicted to encode proteins involved in the transport of glycerophosphodiester metabolites. Previously, we reported that Git1, encoded by ORF 19.34, is responsible for the transport of intact glycerophosphoinositol but not glycerophosphocholine (GroPCho). Here, we report that a strain lacking both GIT3 (ORF 19.1979) and GIT4 (ORF 19.1980) is unable to transport [3H]GroPCho into the cell. In the absence of a GroPCho transporter, C. albicans can utilize GroPCho via a mechanism involving extracellular hydrolysis. Upon reintegration of either GIT3 or GIT4 into the genome, measurable uptake of [3H]GroPCho is observed. Transport assays and kinetic analyses indicate that Git3 has the greater transport velocity. We present evidence that GDE1 (ORF 19.3936) codes for an enzyme with glycerophosphodiesterase activity against GroPCho. Homozygous deletion of GDE1 results in a buildup of internal GroPCho that is restored to wild type levels by reintegration of GDE1 into the genome. The transcriptional regulator, Pho4, is shown to regulate the expression of GIT3, GIT4, and GDE1. Finally, Git3 is shown to be required for full virulence in a mouse model of disseminated candidiasis, and Git3 sequence orthologs are present in other pathogenic Candida species. In summary, we have characterized multiple aspects of GroPCho utilization by C. albicans and have demonstrated that GroPCho transport plays a key role in the growth of the organism in the host.
Introduction
Candida albicans is an opportunistic fungal pathogen that is part of the natural flora of healthy human beings (1). C. albicans together with other Candida species account for most hospital-related fungal infections. Patients in the intensive care unit, individuals with compromised immune systems, and patients undergoing cancer treatments or immunosuppressant therapy are most likely to develop invasive candidal infection (2, 3). Opportunistic pathogens such as C. albicans develop strategies to survive and proliferate in the various niches of the host. This survival must depend upon the ability of the organism to efficiently utilize the available nutrients. Indeed, comparative analysis of the genome of the nonpathogenic Saccharomyces cerevisiae with that of C. albicans has uncovered numerous metabolic differences, including the expansion of gene families related to energy production, nutrient transport, and extracellular hydrolytic activity (4, 5). Secreted phospholipase activity, for example, is prevalent in pathogenic fungi and has been linked to pathogenicity (6, 7). It has been postulated that phospholipases enhance virulence by damaging host membranes and enabling penetration by the organism (6), but their importance may also be related to their ability to release phospholipid metabolites that can be used as nutrients.
Phospholipases of the B type (PLBs)2 deacylate glycerophospholipids (Fig. 10C) to produce fatty acids and water-soluble metabolites called glycerophosphodiesters (GroPXs) (6, 8). Two such GroPXs are glycerophosphoinositol (GroPIns) and glycerophosphocholine (GroPCho) produced through the deacylation of phosphatidylinositol and phosphatidylcholine (PC), respectively. C. albicans contains five PLB-encoding genes (7), and loss of PLB1 or PLB5 has been shown to attenuate virulence (9, 10). In addition to the GroPXs potentially produced through fungus-related phospholipases, GroPXs are found throughout mammalian tissues and fluids as a result of host-specific phospholipases, which can include phospholipases of the A1 and A2 type, as well as PLBs (11–20). GroPCho and its precursor, PC, are present in serum (14, 15). They are also found in the gastrointestinal tract and the urinary tract (11, 17, 19, 20), known locations for C. albicans colonization (1, 21). In the renal medulla of the kidney, where there is risk of C. albicans infection in critically ill patients (1), GroPCho serves as a protective osmolyte against a high concentration of NaCl and urea (12, 13). Additionally, GroPCho is found in the brain and spinal fluid (16, 18).
FIGURE 10.

Glycerophosphodiester transport and catabolism in C. albicans and S. cerevisiae. A, in C. albicans Git1 acts as a GroPIns transporter, whereas both Git3 and Git4 transport GroPCho. The host environment can provide GroPXs for utilization by the organism. The endogenous production of GroPXs by C. albicans has not been studied. B, in S. cerevisiae Git1 transports GroPIns and has minor activity for GroPCho. Cell surface-associated PLBs are responsible for the production of extracellular GroPIns and GroPCho. An endoplasmic reticulum-associated PLB, Nte1, is not shown. For both A and B, weight of arrows across transport proteins indicates relative transport activity. Catabolic products of GroPIns and GroPCho as determined through radiolabeling studies are indicated. Question marks indicate that the gene product(s) involved are unknown. Dashed arrows indicate that inositol and choline are recycled back into membrane phospholipids. PM, plasma membrane. C, reaction illustrating deacylation of phosphatidylcholine to produce GroPCho and fatty acids. This reaction can be catalyzed by phospholipases of the A1-, A2-, or B-type.
We have reported that C. albicans transports glycerophosphodiesters, specifically GroPIns and GroPCho, into the cell where they are hydrolyzed and used as a source of phosphate, choline, and inositol (22). GIT1, identified based on sequence similarity to S. cerevisiae GIT1, was shown to be responsible for GroPIns transport but not GroPCho transport. GroPCho transport is roughly 50 times greater in C. albicans as compared with S. cerevisiae, and three other ORFs (GIT2,3,4; 19.1978–19.1980) with similarity to GIT1 exist in the C. albicans genome (22). GIT2,3,4 lie in a tandem repeat on chromosome 5 and, like GIT1, are members of the major facilitator superfamily (23).
In this study, we have identified several gene products involved in the utilization of the common phospholipid metabolite, GroPCho (Fig. 10A). We have identified Git3 and Git4 as GroPCho transporters, with Git3 exhibiting the major activity. In addition, we have identified Gde1 as a glycerophosphodiesterase involved in intracellular GroPCho catabolism and have shown that Pho4 is a regulator of GIT3, GIT4, and GDE1 expression. Based on extensive labeling studies, we determined that C. albicans employs multiple mechanisms for GroPCho utilization. Our finding that GIT3 is required for full virulence in a mouse model underlines the importance of metabolic studies in garnering a full understanding of C. albicans biology and pathogenicity.
EXPERIMENTAL PROCEDURES
Strains and Media
C. albicans strains used in this study can be found in Table 1. Strains were grown aerobically at 30 °C unless otherwise noted. Turbidity was monitored by measurement of absorbance at 600 nm (A600) on a BioMate 3 Thermo Spectronic spectrophotometer. Medium used for this study was synthetic complete (yeast nitrogen base (YNB)) containing 2% glucose, as described previously (24). Media phosphate concentrations were controlled by removing KH2PO4 (1 g/liter) from the synthetic mix and replacing it with KCl (1 g/liter). KH2PO4 was added back into media at high (10 mm) or low (200 μm) concentrations as indicated. In some experiments, media contained GroPCho (200 μm) (Sigma catalog no. G5291). For all experiments, the medium was supplemented with 80 μg/ml uridine. For serum experiments, bovine serum (Sigma catalog no. B9433) was added to synthetic complete YNB media containing KH2PO4 (1 mm) at 10% of the total volume. Strains were maintained on YEPD agar plates (yeast extract 10 g, peptone 20 g, and dextrose 10 g per liter).
TABLE 1.
Strains used in the study
| BWP17 | ura3Δ::λimm434 his1::hisG arg4::hisG | 26 |
| ura3Δ::λimm434 his1::hisG arg4::hisG | ||
| WT (DAY185) | ura3Δ::λimm434 ARG4::URA3::arg4::hisG HIS1::his1::hisG | 25, 58 |
| ura3Δ::λimm434 arg4::hisG his1::hisG | ||
| WT-TF | arg4Δ LEU2 HIS1 URA3 IRO1 | 59 |
| arg4Δ leu2Δ his1Δ ura3Δ::imm434 iro1Δ::imm434 | ||
| pho4Δ/Δ | arg4Δ leu2Δ his1Δ URA3 IRO1 pho4::LEU2 | 59 |
| arg4Δ leu2Δ his1Δ ura3Δ::imm434 iro1Δ::imm434 pho4::HIS1 | ||
| git2,3,4Δ/Δ + pDDB78 | ura3Δ::λimm434 arg4::hisG his1::hisG::pHIS1 git2,3,4::ARG4 | This study |
| ura3Δ::λimm434 arg4::hisG his1::hisG git2,3,4::URA3 | ||
| git2,3,4Δ/Δ + pDDB78GIT2 | ura3Δ::λimm434 arg4::hisG his1::hisG::pHIS1-GIT2 git2,3,4::ARG4 | This study |
| ura3Δ::λimm434 arg4::hisG his1::hisG git2,3,4::URA3 | ||
| git2,3,4Δ/Δ + pDDB78GIT3 | ura3Δ::λimm434 arg4::hisG his1::hisG::pHIS1-GIT3 git2,3,4::ARG4 | This study |
| ura3Δ::λimm434 arg4::hisG his1::hisG git2,3,4::URA3 | ||
| git2,3,4Δ/Δ + pDDB78GIT4 | ura3Δ::λimm434 arg4::hisG his1::hisG::pHIS1-GIT4 git2,3,4::ARG4 | This study |
| ura3Δ::λimm434 arg4::hisG his1::hisG git2,3,4::URA3 | ||
| gde1Δ/Δ + pDDB78 | ura3Δ::λimm434 arg4::hisG his1::hisG::pHIS1 gde1::ARG4 | This study |
| ura3Δ::λimm434 arg4::hisG his1::hisG gde1::URA3 | ||
| gde1Δ/Δ + pDDB78GDE1 | ura3Δ::λimm434 arg4::hisG his1::hisG::pHIS1-GDE1 gde1::ARG4 | This study |
| ura3Δ::λimm434 arg4::hisG his1::hisG gde1::URA3 | ||
| git3Δ/Δ | ura3Δ::λimm434 arg4::hisG his1::hisG git3::dpl200 | This study |
| ura3Δ::λimm434 arg4::hisG his1::hisG git3::dpl200 | ||
| git4Δ/Δ | ura3Δ::λimm434 arg4::hisG his1::hisG git4::dpl200 | This study |
| ura3Δ::λimm434 arg4::hisG his1::hisG git4::dpl200 |
Construction of Homozygous Mutants
Primers used in this study are listed in Table 2. The wild type strain (DAY185) and methodology for creating homozygous deletion mutants have been described previously (25, 26). In general, a forward deletion primer consisted of 100 nt homologous to the upstream region of the gene's start site plus an adaptor sequence (5′-TTTCCCAGTCACGACGTT-3′) that flanked the 5′ end of the URA3 gene in plasmid pGEM-URA3 (JVE278) (26). A reverse deletion primer consisted of 100 nt of homology downstream of a gene's stop site plus an adaptor sequence (5′-GTGGAATTGTGAGCGGATA-3′) that flanked the 3′ end of the URA3 gene in plasmid pGEM-URA3. The 1.4-kb PCR product containing the URA3 gene was transformed into strain BWP17, and Ura+ transformants were selected. Identical primers were used to PCR-amplify the ARG4 gene from plasmid pRS-ARG4 (JVE279) (26) for deletion of the second allele because the same adaptor sequence was contained in both plasmids pGEM-URA3 and pRS-ARG4. The ∼2.5-kb PCR product containing the ARG4 gene was transformed into the heterozygous mutant strain, and Ura+ Arg+ transformants were selected. A homozygous deletion mutant would produce PCR products for both the inserted URA3 gene (1.2 kb) and inserted ARG4 gene (2.3 kb) but not the native locus. Using this methodology, a strain, git2,3,4Δ/Δ (JPV 692/SGH338) was produced using a forward primer with homology upstream of the GIT2 start site and a reverse primer with homology downstream of the GIT4 stop site. The resulting homozygous mutant lacked ∼8500 kb encompassing GIT2 through GIT4.
TABLE 2.
Deletion primers used in this study
| Gene name | Primer | Sequence 5′–3′ |
|---|---|---|
| GIT2 | Forward | ATTACAACAATCCCAAAATTAGTACTTTAACATCAAATGCAATCTTTCACTACATGTAACACGCTTTTTTAATTACGTATCGTGAACAATTCCAAATTTATGGTTATGTAAAAATACTAGGTTTTCCCAGTCACGACGTT |
| GIT3 | Forward (A) | CATTTCCTCATCTATCTTATCTTATCTTATCTTTTTTTATTTGGTCATACACTTATACATATATCTTTTTTTGTTTGAAACTTCTACTGACTTTACAAATTTTCCCAGTCACGACGTT |
| GIT3 | Reverse (A) | TACGTTAAAATGCTCTAAACTATATATATAAATGTGCTCCCACAAAGCGTCCAGTCAAATGAGATATAATAAATACTGTTTTATGCAAAACTATAAACTAGTGGAATTGTGAGCGGATA |
| GIT3 | Forward (B) | CTACTAGAGATTTACCTCATAGTTTTTCCGAGTTGAGTTATGGCTGGGTGAAAAGAATACGTGCTGAATTCACCGTTGGGAAAAGTAAAGAACAATTACTTTCCCAGTCACGACGTT |
| GIT3 | Reverse (B) | AAGAGAATTATTGTCAACTTGGAAATCATCTCTTTTTCCTTTTTCAAGTGAGTCTGATTCACGACAAACTTCACGAACATCACCACCTTCTCCCAACATAGTGGAATTGTGAGCGGATA |
| GIT4 | Forward (A) | TAAATTGGGATTCAATTTCCTTTACATATTTTTATTTCCTTTTTGTCCAAGAAGACTCTAAACCATTCAATCCTAATTTAAATAATCATATCATATCATTTTTCCCAGTCACGACGTT |
| GIT4 | Reverse (A) | TCACTCAAACGTGTAAAACAATAATTAAATCTAATATATTTATATAAAAGCAAATACAAAAACTCTACACCTGCAAAGTTGAACCTCCGCTTAGTATCTGGTGGAATTGTGAGCGGATA |
| GIT4 | Forward (B) | GCTACTAGAGATTTACCTCATTCAGTTGGTGACTTTTGTTTTGGTTGGGTTGATCAAATTCGAAGTGAAATCACTTTAGGTAAAAGTCAAGATCAATTAATTTCCCAGTCACGACGTT |
| GIT4 | Reverse (B) | TACATTTTTCTGTTGTACTTTAACGGTATCGTCTTTTTCATCAGAAATCACACCAATATCTTCATCTTCTTGATATTGAGTGACAACACCACTATCACCTGTGGAATTGTGAGCGGATA |
| GDE1 | Forward | TATTCATTTGTTGTTGTTGTTGTTGTTTTCTTTCTTTCTTTTTTCCTGTGTGTGTGTGTTTGTGGAATAGTTTAAACGGTTATTTAGTTTTCAATTCCCATTTCCCAGTCACGACGTT |
| GDE1 | Reverse | TAGTAAGTACATCGTGATACAAACAATGCTATGTAAGAATCCAAGAAACAACTAACAACTAACAAATCTATATCTCTCTCTAATTTAGTATTTAATATATAAAATTTGTGGAATTGTGAGCGGATA |
For two strains (git3Δ/Δ and git4Δ/Δ), homozygous deletions were made utilizing the URA3 cassette described above, but following heterozygous mutant verification, 5-fluoroorotic acid counterselection was performed (25). For deletion of the second allele, a secondary set of deletion primers (B set in Table 2) was necessary for both GIT3 and GIT4 because of the tendency of the URA cassette to combine at the deletion site of the first allele. This second group of primers was similar to the first set (labeled A in Table 2) but consisted of a forward primer with 100 nt homologous to the region downstream of the gene's start site plus an adaptor sequence and a reverse primer that consisted of 100 nt homologous to the region upstream of the gene's stop site. This second URA3 cassette was transformed into the heterozygous mutant strain; deletion of the second native allele was verified, and counterselection on 5-fluoroorotic acid was repeated producing a Ura− homozygous deletion mutant.
Construction of Complementation Plasmids
Complementation plasmids were constructed for GIT2, GIT3, GIT4, and GDE1 using plasmid pDDB78 (25). Each target gene was amplified from genomic DNA using primers that can be found in Table 3. Each forward primer was located ∼1500 bp upstream from the start site and contained a 5′ NotI restriction site plus 100 nt of homology to the genomic DNA. The reverse primer was located ∼300 bp downstream of the stop site and contained a 5′ EcoRI restriction site plus 100 nt of homology to the genomic DNA. Upstream and downstream locations varied depending on intergenic distances and neighboring ORFs. The vector pDDB78 was linearized with restriction enzymes NotI and EcoRI. The linear pDDB78 and amplified target gene were transformed into S. cerevisiae strain (trp1Δ63, his3Δ200, ura3-52, and leu2Δ1) (JPV1) (25) for in vivo recombination, and Trp+ colonies were selected. Plasmids were extracted from Trp+ colonies using acid-washed beads and a Zyppy Mini prep kit (Zymo). Extracted plasmids were then transformed into E. coli, and Amp+ plasmids were selected. The plasmids were extracted from E. coli and verified by PCR and agarose gel electrophoresis.
TABLE 3.
Complementation primers used in this study
| Gene name | Primer | Sequence 5′–3′ |
|---|---|---|
| GIT2 | Forward | TTCACACAGGAAACAGCTATGACCATGATT |
| ACGCCAAGCTAAATTGATTCTGCCGTGCCC | ||
| GIT2 | Reverse | TCGACCATATGGGAGAGCTCCCAACGCGTT |
| GGATGCATAGATTTACCCGGAATCAACCCC | ||
| GIT3 | Forward | TTCACACAGGAAACAGCTATGACCATGATT |
| ACGCCAAGCTGGGTTGATTCCGGGTAAATG | ||
| GIT3 | Reverse | TCGACCATATGGGAGAGCTCCCAACGCGTT |
| GGATGCATAGTCCACGTTGTCAGAGAGTTCA | ||
| GIT4 | Forward | TTCACACAGGAAACAGCTATGACCATGATT |
| ACGCCAAGCTTATCTCATTTGACTGGACGC | ||
| GIT4 | Reverse | TCGACCATATGGGAGAGCTCCCAACGCGTT |
| GGATGCATAGAATAGTGGCGGACACTTGTTG | ||
| GDE1 | Forward | TTCACACAGGAAACAGCTATGACCATGATT |
| ACGCCAAGCTACCAGGTCTGTTCTTTTTCA | ||
| GDE1 | Reverse | TCGACCATATGGGAGAGCTCCCAACGCGTT |
| GGATGCATAGGGATGGCATTGAGTCTGTAG |
Insertional Complementation of Deletion Mutants
Plasmids pDDB78GIT2, pDDB78GIT3, pDDB78GIT4, and pDDB78GDE1 were linearized with NruI, which cuts the plasmids within the HIS1 gene. Linearized pDDB78GIT2, pDDB78GIT3, and pDDB78GIT4 plasmids were then transformed into git2, 3,4Δ/Δ (JPV 692/SGH338), and linearized pDDB78GDE1 was transformed into gde1Δ/Δ (JPV 733) for recombination at the HIS1 locus. His+ transformants were tested for complementation of the mutant phenotype when possible. Reintegration was also verified by PCR. Empty plasmid pDDB78 was also linearized and transformed into both git2,3,4Δ/Δ and gde1Δ/Δ strains.
[3H]GroPCho Transport Assays
Short term transport assays were performed as described previously (22). Briefly, cultures were grown to log phase at 30 °C. Aliquots were harvested, washed once in sterile DI H2O, and suspended in 100 mm citrate buffer (pH 5) to an A600 of 5. Cell suspensions were incubated at 30 °C for 10 min with agitation to allow for equilibration to buffer conditions. The assay was started by the addition of 50 μl of 1 mm [3H]GroPCho to 200 μl of cell suspension making a final concentration of 200 μm [3H]GroPCho. After 2 min of incubation at 30 °C, the assay was stopped by the addition of 10 ml of ice-cold DI H2O. The samples were immediately filtered through glass fiber (GF/C) filters (Whatman number 1822-025). The filters were washed once with ice-cold DI H2O and suspended in 10 ml of scintillation fluid. Radioactivity was measured by liquid scintillation counting. Tritium-labeled GroPCho ([3H]choline-GroPCho) was produced through the chemical deacylation of phosphatidylmethyl[3H]choline (American Radiolabeled Chemicals) as described previously (27).
To determine GroPCho transport kinetics, the initial rate of GroPCho uptake was determined as described above but with varying concentrations of GroPCho. For measuring Git3 kinetics in a git4Δ/Δ mutant, a concentration range of 20 μm to 1 mm was used. For measuring Git4 kinetics in a git3Δ/Δ mutant, 5–200 μm was used. Saturation kinetics data for GroPCho were analyzed to determine estimated Km and Vmax values using the Levenberg-Marquardt algorithm for nonlinear regression in GraphPad Prism (version 4.0). Values were determined by least squares fitting of the data to the Michaelis-Menten equation (V = Vmax[S]·(Km + [S])−1), where S represents GroPCho. Linearization of the kinetic data was performed using Hanes plot transformations (28).
Preparation of External and Internal Cellular Fractions and Analysis of [3H]Choline-containing Metabolites by Ion-exchange Chromatography
[3H]Choline-containing metabolites were analyzed in both intracellular and extracellular fractions of the cell following short term transport assays and long term incorporation studies. For the short term studies, a standard 2-min transport assay was performed except that the assay was not stopped with 10 ml of DI H2O. Rather, 750 μl of H2O was added to the 250-μl cell suspension. The cells were pelleted, and the supernatant was removed as the extracellular fraction. The pellet was washed once in 500 μl of DI H2O and pelleted. The supernatant was again removed to the extracellular fraction.
To isolate an internal fraction (29), the cell pellet was suspended in 100 μl of 5% TCA solution followed by a 10-min incubation on ice. Cells were again pelleted, and the supernatant was removed as the internal fraction. To neutralize the TCA, an equal volume of 1 m Tris (pH 8) was added to the TCA fraction. The cell pellet was washed once with 300 μl of DI H2O, and the supernatant was added to the internal fraction.
Long term incorporation studies were designed to analyze label uptake incrementally over 24 h. The assay was started by inoculating 2.2-ml cultures of synthetic complete YNB media containing 200 μm KH2PO4 and 50 μm [3H]GroPCho to an A600 of 0.05. At 6, 12, 18, and 24 h after inoculation, 400 μl of culture was removed. Cells were pelleted, and the extracellular fraction was removed. When necessary, nonradioactive cells were added to aid in the pelleting of radioactive cells. Pellets were washed with 600 μl of DI H2O and again sedimented. The pellet was suspended 100 μl of 5% TCA solution followed by a 10-min incubation on ice. Cells were again pelleted, and the TCA fraction was removed as the internal fraction. To neutralize the TCA, an equal volume of 1 m Tris (pH 8) was added to the TCA fractions. The cells were washed once with 300 μl of DI H2O and pelleted, and the supernatant was removed to the internal fraction. Internal and external samples were diluted 4× in DI H2O, applied to 250-μl Dowex 50W8, 200–400 anion-exchange columns, and eluted as described previously (30). Briefly, [3H]GroPCho was eluted with 2× 1-ml H2O washes. [3H]Choline-phosphate, if present, was eluted with a subsequent 1-ml H2O wash. [3H]Choline was eluted with 5 ml of 1 m HCl. Standards were used to verify that columns were functioning correctly. Radioactivity in each sample was determined using liquid scintillation counting.
RNA Extraction and Gene Expression Analysis by Real Time Quantitative PCR
RNA extraction and quantitative RT qPCR procedures were performed as described previously (22). Briefly, strains were grown in low (200 μm) or high (10 mm) phosphate media described above. Cultures were grown to A600 between 0.8 and 1.2 and harvested, and RNA was extracted using a hot phenol/chloroform extraction (31). RNA was DNase-treated using the Turbo DNA-free kit (Applied Biosystems) and stored at −80 °C until analysis. Primer 3 software was used to design forward and reverse RT qPCR primers for TDH3, GIT2, GIT3, GIT4, and GDE1 (Table 4). RT qPCR was carried out on an Applied Biosystems StepOnePlus instrument using Power SYBR Green RNA to a CT one-step kit (Applied Biosystems). Each reaction consisted of 0.2 μl of a 125× RT enzyme mixture, 12.5 μl of a 2× RT-PCR mixture, 1 μm primers, and 1.5 μl of DNase-treated RNA brought up to a volume of 25 μl with diethyl pyrocarbonate-treated H2O. Experimental samples were performed in triplicate and are representative of three independent determinations. Reverse transcription was performed at 50 °C for 15 min, followed by 95 °C for 15 min for RT inactivation and polymerase activation. This was followed by 40 cycles at 95 °C for 15 s, 50 °C for 30 s for primer annealing, and 72 °C for 40 s for amplification. Primers were validated for specificity through melt curve analysis and by visualizing amplicons by gel electrophoresis. Primer sets did not produce an amplicon when the template from the respective deletion mutant was employed. Control reactions lacking reverse transcriptase or template were performed. Expression levels were analyzed using the ΔΔCT method (32) and normalized to the endogenous control, TDH3, which is not phosphate-regulated. For experiments determining the change in expression due to phosphate concentrations, wild type (DAY185) low phosphate expression was normalized to 1 and used to compare fold change in high phosphate expression. For experiments determining the change in expression due to PHO4, wild type (WT-TF) low phosphate expression was normalized to 1 and used to compare fold change in the pho4Δ/Δ strain under low phosphate conditions.
TABLE 4.
Real time qPCR primers used in this study
| Gene name | Primer | Sequence 5′-3′ |
|---|---|---|
| GIT2 | Forward | GGTGCCTTTTCTGCTGATTA |
| GIT2 | Reverse | CCAAATTCACCCAATGTAGC |
| GIT3 | Forward | TTGCTAGAAAAGGAGGGATG |
| GIT3 | Reverse | AAAGCTGAAACAACGAAACC |
| GIT4 | Forward | GTATTGCCATGTCAGCATGT |
| GIT4 | Reverse | TGAAAAGACACAAGGCAGAA |
| GDE1 | Forward | CTGGTTCAGATGATGGAACT |
| GDE1 | Reverse | TCGGTAGCAAAACTCTTAGC |
| TDH3 | Forward | TGCTAAAGCCGTTGGTAAGG |
| TDH3 | Reverse | AAATCGGTGGAGACAACAGC |
[3H]GroPCho Uptake in Serum and XTT Cell Proliferation Assay
Parallel radioactive and nonradioactive experiments were performed. Nonradioactive cultures were used to assess cell growth using the XTT cell proliferation assay kit (Abnova). This assay measures the reduction of XTT through the production of a colorimetric product and was previously used to monitor cell proliferation in C. albicans biofilms (33). Cultures (1 ml) of synthetic complete media (1 mm KH2PO4) containing 10% bovine serum were inoculated to an A600 of 0.1. For the radioactive samples, the media were supplemented with 200 μm [3H]GroPCho, whereas 200 μm GroPCho was used in the nonradioactive samples. Cultures were grown at 37 °C with agitation for 6 h. Following the incubation period, the radioactive samples were centrifuged at 3500 rpm for 4 min to pellet the cellular mass. The 1-ml supernatant was carefully removed as the extracellular fraction. Pellets were washed with 500 μl of DI H2O and centrifuged again removing the supernatant to the extracellular fraction. The pellet was suspended 100 μl of 5% TCA solution followed by 10 min of incubation on ice. Cells were again pelleted, and the TCA fraction was removed as the internal fraction. To neutralize the TCA, an equal volume of 1 m Tris (pH 8) was added to the TCA fractions. The cells were washed once with 300 μl of DI H2O and pelleted, and the supernatant was removed to the internal fraction. Internal [3H]choline-containing metabolites were separated by ion-exchange chromatography as described under “Experimental Procedures.”
Cell growth was assessed in nonradioactive cultures using the XTT kit because the presence of serum induced hyphae formation and clumping cells whose growth could not be monitored by measuring optical density. After 6 h of growth, 10 μl of XTT reagent mixture was added to each 1-ml culture and carefully mixed with a pipette. Tubes were incubated upright at 37 °C for 4 h. Tubes were centrifuged at 3500 rpm for 4 min to pellet cells, and 50 μl of supernatant was diluted 10-fold in DI H2O. Absorbance was measured at 450 nm, and this number was used to normalize radioactive uptake of [3H]GroPCho to approximate cellular growth across the different strains.
Mouse Model of Blood Stream Infection
The standard mouse model of hematogenously disseminated candidiasis was used. Eight male BALB/c mice per strain were injected via the tail vein with 5 × 10⁵ C. albicans cells. Survival was monitored three times daily for 21 days. Differences in survival among mice infected with the different strains were analyzed by the log-rank test.
Phylogenetic Analyses
Homologs of C. albicans Git1, Git2, Git3, and Git4 proteins were identified with a BLASTP search of known and predicted proteins in the NCBI nr database from the following species of the “CTG clade”: Candida dubliniensis, Candida tropicalis, Candida maltosa, Candida orthopsilosis, and Candida parapsilosis, along with other members of the Saccharomycetales: Kluyveromyces lactis, S. cerevisiae, and the more distantly related Yarrowia lipolytica. Hits with greater than 30% identity and greater than 50% coverage in the matches to C. albicans proteins were aligned with Clustal Omega software (34). Maximum likelihood and neighbor-joining phylogenetic trees were constructed using MEGA Version 5.2.2 software (35), with the JTT matrix-based method excluding all positions containing gaps or missing data (complete deletion option) with statistical confidence of nodes assessed with 10,000 bootstrap replicates.
RESULTS
Novel Construction of a Strain Lacking GIT2,3,4
C. albicans contains four ORFs (GIT1,2,3,4) that are predicted to be involved in glycerophosphodiester transport. GIT1, residing on chromosome 2, codes for a permease that is solely responsible for the uptake of GroPIns but does not have specificity for GroPCho, a highly transported metabolite in C. albicans (22). The remaining three ORFs, GIT2,3,4, lie in a tandem repeat on chromosome 5 and are the focus of this work. Pairwise alignment of Git3 with Git2 using NCBI BLAST (36) reveals that the Git2, Git3, and Git4 proteins are all similar to each other, ranging from 69 to 75% identity and with 81–87% positive matches (Table 5). In contrast, these three proteins are equally much more divergent from Git1, ranging from 33 to 35% identical and 50–53% positive matches to Git1. Because the GIT2,3,4 gene products are very similar to each other, we reasoned that single mutation phenotypes might be difficult to detect because of compensation by the other ORFs. Thus, in addition to constructing single gene deletion mutants, we also constructed a triple mutant by deleting the region from GIT2 to GIT4 spanning roughly 8500 bp. To the best of our knowledge, this is the first report of a triple mutant being created by knocking out three genes in tandem in C. albicans.
TABLE 5.
Sequence comparisons among C. albicans Git proteins
Percent identity between homologs shown below diagonal; percent positive matches shown above diagonal.
| Git1 | Git2 | Git3 | Git4 | |
|---|---|---|---|---|
| Git1 | 51.7 | 50.4 | 53.2 | |
| Git2 | 33.0 | 86.6 | 81.4 | |
| Git3 | 34.1 | 75.3 | 83.3 | |
| Git4 | 35.3 | 69.4 | 73.7 |
Role of GIT3 and GIT4 in the Utilization of GroPCho as a Phosphate Source
S. cerevisiae and C. albicans can utilize glycerophosphodiesters as phosphate sources (22, 37). To assess the role of Git2,3,4 in this process, we examined the growth of a git2,3,4Δ/Δ mutant when GroPCho was provided as the sole phosphate source (Fig. 1A). Early growth (just detectable roughly 18 h post-inoculation) was abolished in the git2,3,4Δ/Δ mutant, although growth did resume after that. Reintegration of either GIT3 or GIT4 into the genome of the git2,3,4Δ/Δ mutant rescued this early growth defect on GroPCho, although reintegration of GIT2 or the empty vector (pDDB78) did not. All strains grew uniformly when KH2PO4 was supplied (Fig. 1B), and only background growth was observed in the absence of a phosphate source (Fig. 1C).
FIGURE 1.

Both GIT3 and GIT4 rescue growth of a git2,3,4Δ/Δ mutant utilizing GroPCho as the sole phosphate source. Strains were grown in synthetic YNB liquid media lacking a phosphate source (C) and supplemented with 200 μm KH2PO4 (B) or with 200 μm GroPCho (A). Cultures were incubated at 30 °C with shaking, and A600 readings were taken incrementally over 48 h. Values represent means ± S.E. of triplicate determinations. Strains are WT-DAY185 or git2,3,4Δ/Δ complemented with empty vector (pDDB78), GIT2 (pDDB78GIT2), GIT3 (pDDB78GIT3), or GIT4 (pDDB78GIT).
Git3 Is the Major GroPCho Permease and Is Regulated by Phosphate Availability
Because both GIT3 and GIT4 rescued the growth defect observed in a git2,3,4Δ/Δ strain, we next monitored the initial rate of [3H]GroPCho uptake. Cells were pre-grown in synthetic media containing either 200 μm (low) or 10 mm (high) KH2PO4, since we showed previously that [3H]GroPCho uptake is regulated by phosphate availability (22). Reintegration of GIT3 rescued a majority of the transport activity lost by the deletion of GIT2,3,4 (Fig. 2A). Reintegration of GIT4 also rescued initial [3H]GroPCho transport, albeit at a much lower level than GIT3. On an adjusted scale (Fig. 2B), it is evident that [3H]GroPCho uptake through Git4 is not trivial but is comparable with the [3H]GroPIns uptake that is observed in a wild type strain and mediated by Git1 (22). This level of GroPIns transport is enough to support growth that is indistinguishable from that which occurs when free KH2PO4 is supplied as the phosphate source (22). Thus, it is not surprising that the GroPCho transport activity provided by GIT3 when reintegrated into a git2,3,4Δ/Δ strain is not growth-limiting when compared with wild type using either GroPCho (Fig. 1A) or KH2PO4 (Fig. 1B) as the phosphate source.
FIGURE 2.
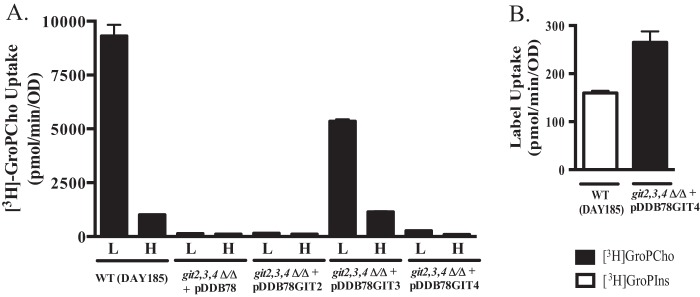
Git3 exhibits greater initial transport velocity than Git4 and is regulated by phosphate availability. A, strains grown to log phase in synthetic YNB media containing either 200 μm KH2PO4 (L) or 10 mm KH2PO4 (H) were harvested and assayed for their ability to transport [3H]GroPCho in 2-min assays. B, enlargement of git2,3,4Δ/Δ + pDDB78GIT4 (L) from A compared with uptake of [3H]GroPIns by WT-DAY185 strain grown under low phosphate conditions. Values represent means ± S.E. of triplicate determinations. Strains are WT-DAY185 or git2,3,4Δ/Δ complemented with empty vector (pDDB78), GIT2 (pDDB78GIT2), GIT3 (pDDB78GIT3), or GIT4 (pDDB78GIT).
Growth in high phosphate reduced both [3H]GroPCho uptake and the mRNA levels of GIT3 and GIT4 as determined by RT qPCR (Table 6). Although we have not identified a role for GIT2, we examined its expression and found it to be largely unresponsive to phosphate levels (Table 6).
TABLE 6.
Gene expression as a function of phosphate availability
Wild type cells were grown to log phase in YNB liquid media containing either low (200 μm) or high (10 mm) Pi. Expression was measured by RT-qPCR. TDH3 was used as an endogenous control. For each gene, expression under low phosphate conditions was normalized to 1. Values represent means ± S.E. of triplicate determinations. Two independent experiments were performed for GIT3, GIT4, and GDE1.
| Strain | Normalized fold expression |
|||
|---|---|---|---|---|
| GIT2 | GIT3 | GIT4 | GDE1 | |
| WT DAY185 (low Pi) | 1 | 1 | 1 | 1 |
| WT DAY185 (high Pi) | 1.26 ± 0.09 | 0.32 ± 0.05 | 0.05 ± 0.01 | 0.25 ± 0.02 |
We have previously reported that Git1 is the sole transporter for GroPIns based on the absence of transport in the git1Δ/Δ mutant (22). For completeness, we measured GroPIns transport in a wild type and git2,3,4Δ/Δ mutant and found no decrease in transport activity upon loss of GIT2,3,4 (100 ± 8% for wild type versus 115 ± 3% for the triple mutant). Thus, neither Git2, Git3, nor Git4 possess detectable GroPIns transport activity.
Loss of GDE1 Alters GroPCho Catabolism
Because an initial goal of this work was to abrogate GroPCho utilization and deletion of GIT2, GIT3, and GIT4 did not achieve that, we deleted a gene predicted to be involved in GroPCho catabolism. A single ORF in the C. albicans genome has sequence similarity to S. cerevisiae GDE1 (YPL110C), which codes for a protein with glycerophosphodiesterase activity specific for GroPCho (38, 39). Using NCBI BLAST (36) (default settings, CGD) ORF 19.3936, here named Gde1, was found to have 42% identity match and 58% positive match to Gde1 with 15% gaps. GDE1 is predicted to encode a cytosolic protein of 1162 amino acids. Homozygous deletion of GDE1 did not abolish the cells' ability to utilize GroPCho as a sole phosphate source, although there was a measurable difference between wild type and the gde1Δ/Δ strain (Fig. 3A). The difference in growth was rescued when a copy of GDE1 (pDDB78GDE1) was reintegrated into the genome of gde1Δ/Δ (Fig. 3A). To assess the role of Gde1 in GroPCho catabolism, we performed transport assays followed by analysis of the internal metabolites. As shown in Fig. 3B, internal [3H]GroPCho as well as [3H]choline were present in a wild type strain. In the homozygous deletion mutant, we observed a buildup of internal [3H]GroPCho and minimal levels of [3H]choline. Reintegration of one copy of GDE1 resulted in wild type levels of [3H]GroPCho and [3H]choline, suggesting that GDE1 codes for a glycerophosphodiesterase that acts on GroPCho. A git2,3,4Δ/Δ was also included to show that GroPCho is not internalized in the absence of a transporter. Growth in the presence of high phosphate reduced the expression of GDE1, as was the case for GIT3 and GIT4 (Table 6).
FIGURE 3.
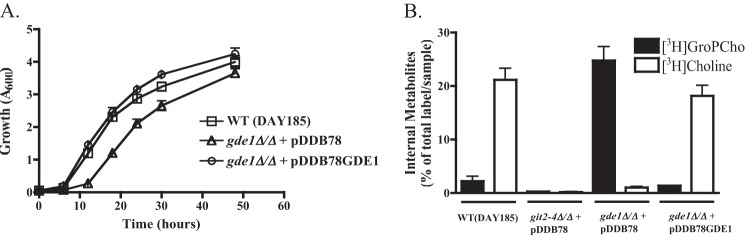
Deletion of GDE1 results in altered GroPCho catabolism. A, strains were grown in synthetic YNB liquid media lacking phosphate and supplemented with 200 μm GroPCho. Cultures were incubated at 30 °C with shaking, and A600 readings were taken over 48 h. B, strains were grown to log phase in synthetic YNB low phosphate media, harvested, and incubated with [3H]GroPCho for 2 min. Internal pools of [3H]GroPCho and [3H]choline were determined by ion-exchange chromatography. Values represent means ± S.E. of triplicate determinations. Strains are WT-DAY185 or gde1Δ/Δ complemented with empty vector (pDDB78) or GDE1 (pDDB78GDE1).
C. albicans Can Utilize GroPCho through Transport and Intracellular Hydrolysis or through Extracellular Hydrolysis
Our transport assays indicate that either Git3 or Git4 is required for GroPCho uptake (Fig. 2), yet growth on GroPCho as a phosphate source does occur roughly 12 h post-inoculation in a git2,3,4Δ/Δ mutant (Fig. 1A). To gain insight into these results, we analyzed the extracellular and intracellular water-soluble fractions of cells inoculated in the presence of [3H]GroPCho over the course of 24 h. For these experiments, the medium was supplemented with 200 μm KH2PO4 in addition to [3H]GroPCho to supply a phosphate source for initial growth of the git2,3,4Δ/Δ mutant. Focusing on the internal fraction of the wild type strain (Fig. 4A), the level of [3H]GroPCho seen at 6 h decreased thereafter, and a parallel increase of internal free [3H]choline occurred. These data suggest that the internal GroPCho is being hydrolyzed initially to [3H]choline and glycerol 3-phosphate (GroP). By 24 h, the internal [3H]choline had been incorporated into PC (data not shown) and thus was not present in the water-soluble fractions. Outside of the cell, the level of [3H]GroPCho decreased with time as it was transported into the cell and reached a plateau at ∼12 h (Fig. 4B). Notably, [3H]choline appeared in the extracellular fraction starting at ∼6 h, suggesting that external hydrolysis was occurring parallel to GroPCho transport (Fig. 4B).
FIGURE 4.

C. albicans can utilize GroPCho through transport and intracellular hydrolysis or through extracellular hydrolysis. Strains were grown in liquid YNB synthetic media containing 200 μm KH2PO4 in the presence of [3H]GroPCho. At each time point, samples were harvested and separated into extracellular and intracellular fractions. Each fraction was analyzed by ion-exchange chromatography to determine the distribution of counts into either [3H]GroPCho or [3H]choline. Values represent means ± S.E. of duplicate determinations. A, intracellular, and B, extracellular fraction of WT-DAY185. C, intracellular, and D, extracellular fraction of git2,3,4Δ/Δ with an empty vector (pDDB78) reintegrated. E, intracellular, and F, extracellular fraction of git2,3,4Δ/Δ with GIT3 (pDDB78GIT3) reintegrated.
In the git2,3,4Δ/Δ mutant, we were unable to detect any significant levels of internal [3H]GroPCho over 24 h of growth (Fig. 4C), indicating that deletion of GIT2,3,4 abolishes GroPCho transport activity, even over 24 h. After 12 h of growth, however, we were able to detect internal [3H]choline in the git2,3,4Δ/Δ mutant (Fig. 4C), as well as a decrease in extracellular [3H]GroPCho (Fig. 4D) and the appearance of external [3H]choline. These data suggest that [3H]GroPCho was being hydrolyzed outside of the cell to release free choline, as was the case for wild type (Fig. 4B). Because Git3 is the primary permease for GroPCho, we analyzed the git2,3,4Δ/Δ mutant with GIT3 reintegrated into the genome to confirm that intracellular and extracellular levels of metabolites were returned to that of wild type (Fig. 4, E and F) in the presence of a GroPCho permease. For all experiments, radioactivity not accounted for in the extracellular and intracellular water-soluble fractions was detected in the membrane fraction by way of free choline incorporation into newly synthesized PC (data not shown).
In total, the data presented in Fig. 4 suggest that during the first 12 h of growth, wild type cells transport GroPCho into the cell (primarily via Git3) and hydrolyze it to release free choline and GroP. After 12 h, when there is little continued uptake of intact GroPCho, the most likely scenario is that GroPCho is hydrolyzed extracellularly and the resulting metabolites transported into the cell as needed.
Pho4 Regulates the Expression of GIT3, GIT4, and GDE1
As shown in Table 6, GIT3, GIT4, and GDE1 message levels are up-regulated in response to low phosphate. The transcription factor Pho4 regulates the expression of GIT1 and thereby the transport of GroPIns by C. albicans (22), and its homolog in S. cerevisiae is a known regulator of phosphate-responsive genes (40, 41). Thus, we examined the role of Pho4 in GroPCho metabolism. As shown in Fig. 5B, [3H]GroPCho transport activity was greatly reduced in the pho4Δ/Δ mutant grown under low phosphate conditions. RT qPCR analysis of gene expression (Fig. 5C) revealed an approximate 10-fold reduction in mRNA levels for both GIT3 and GDE1 in the pho4Δ/Δ strain as compared with wild type. GIT4 displayed a roughly 4-fold decrease in message levels in a pho4Δ/Δ strain as compared with wild type. Growth of a pho4Δ/Δ mutant was slightly diminished as compared with wild type when cells were grown on either low concentrations of KH2PO4 or GroPCho (Fig. 5A). It is not surprising that the GroPCho transport activity remaining in the pho4Δ/Δ mutant (250 pmol/min/ODU) was enough to support growth on GroPCho, as that level of activity was also enough to support growth of the git2,3,4Δ/Δ stain with a copy of GIT4 reintegrated (Fig. 1A).
FIGURE 5.

Pho4 regulates the expression of GIT3, GIT4, and GDE1. A, wild type (WT-TF) and pho4Δ/Δ strains were grown in YNB media lacking phosphate (No Pi), supplemented with either 200 μm KH2PO4 (Low Pi) or 200 μm GroPCho. Cultures were incubated at 30 °C with shaking. B, strains were grown to log phase in low Pi medium. Cells were harvested, washed, and analyzed for their ability to transport [3H]GroPCho over 2 min. C, strains were grown to log phase in low Pi medium. Cells were harvested; RNA was extracted, and expression of GIT3, GIT4, and GDE1 was measured by quantitative real time PCR. TDH3 was used as an endogenous control. Fold change expression was calculated compared with WT strain for the transcription factor deletion set (WT-TF) (normalized to 1). Values represent means ± S.E. of triplicate determinations. Experiments were repeated with similar results.
Kinetics of GroPCho Transport by Git3 and Git4
Given that our results indicated that both Git3 and Git4 act as GroPCho transporters, we used a git4Δ/Δ mutant to analyze Git3 transport kinetics and a git3Δ/Δ mutant to analyze Git4 transport kinetics. For analyzing kinetics, strains were grown in synthetic media containing low phosphate. Initial transport of [3H]GroPCho by both Git3 and Git4 conformed to Michaelis-Menten kinetics (Fig. 6, A and B). Under the given conditions, Git3 exhibited a Vmax of 3940 ± 150 pmol/min/ODU and a Km of 45 ± 6 μm. Git4 exhibited a Vmax of 340 ± 40 pmol/min/ODU and a Km of 16 ± 7 μm. Data were transformed into a Hanes plot (Fig. 6, A and B, right panels) to verify linearity and the presence of a single transporter for each analysis. The larger error bars (Fig. 6B) observed for the minor transporter, Git4, as compared with the major transporter, Git3, are due to this relatively low transport activity being affected by small changes in cell density at inoculation as well as at cell harvesting.
FIGURE 6.
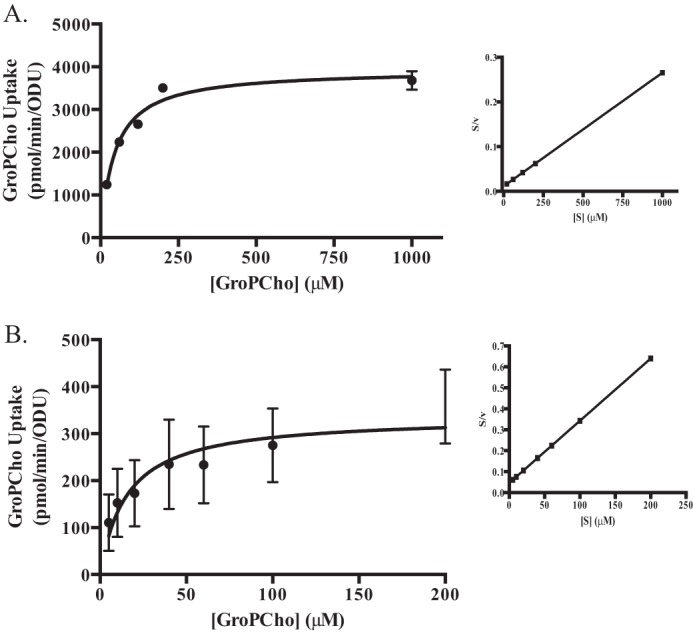
Kinetics of GroPCho transport by Git3 and Git4. Strains were grown to log phase in synthetic YNB low phosphate media, harvested, washed, and assayed for initial rate of transport of [3H]GroPCho at varying concentrations of GroPCho. A, Git3 transport activity was assayed in a git4Δ/Δ mutant with GroPCho concentration ranging from 20 μm to 1 mm. B, Git4 transport activity was assayed in a git3Δ/Δ mutant with GroPCho concentration ranging from 5 to 200 μm. Data were linearized using Hanes plot transformations (A and B, right panels).
GroPCho Utilization under Serum Growth Conditions
To explore GroPCho transport under conditions more similar to those experienced in a human host, we performed GroPCho incorporation experiments in the presence of 10% serum and 1 mm KH2PO4, which is within the phosphate concentration range reported for serum (42). Cultures were grown for 6 h at 37 °C in the presence of [3H]GroPCho, and the internal metabolites were analyzed (Fig. 7). Both [3H]GroPCho and [3H]choline were detected internally in a wild type strain. When GIT2,3,4 were deleted, no internal radiolabeled metabolites were detected. Upon reintegration of GIT3, wild type levels of metabolites were observed. A minimal amount of [3H]GroPCho was detected when GIT4 was reintegrated. A strain containing a homozygous deletion of GDE1 exhibited a buildup of [3H]GroPCho and less [3H]choline compared with wild type levels. Upon reintegration of GDE1, internal metabolites returned to levels similar to wild type. These results indicate that both Git3 and Gde1 are active in the presence of serum, which is known to contain GroPCho (14, 15, 43).
FIGURE 7.
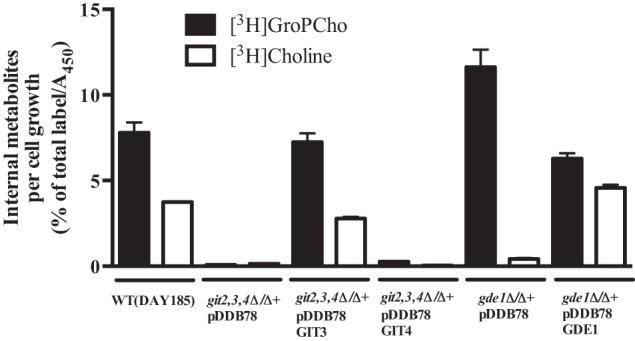
GroPCho is transported and metabolized in the presence of serum. Strains were pre-grown in synthetic YNB media containing 1 mm KH2PO4 (YNB 1 mm Pi). The assay was initiated by inoculating cultures of synthetic YNB 1 mm Pi medium containing 10% bovine serum and 200 μm [3H]GroPCho to an A600 of 0.1. Cultures were incubated at 37 °C for 6 h with agitation. [3H]Choline metabolites in extracellular, intracellular, and membrane fractions were determined by ion-exchange chromatography followed by liquid scintillation counting. Cell growth was determined using XTT reduction analysis (Abnova) performed on parallel nonradioactive cultures. Results represent mean ± S.E. of duplicate samples. Experiment was repeated with similar results. Strains are WT-DAY185, git2,3,4Δ/Δ complemented with empty vector (pDDB78), GIT3 (pDDB78GIT3) or GIT4 (pDDB78GIT), and gde1Δ/Δ complemented with empty vector (pDDB78) or GDE1 (pDDB78GDE1).
Loss of GroPCho Transport Activity Reduces Virulence in a Mouse Model of Blood Stream Infection
Because GroPCho utilization occurs in the presence of serum (Fig. 7), we examined the role of GroPCho transport in virulence following blood stream infection (Fig. 8). Mice infected with the wild type strain displayed a median survival of 5 days. In contrast, a git2,3,4Δ/Δ mutant exhibited a median survival of 9 days, and reintegration of a single copy of GIT3 into the git2,3,4Δ/Δ mutant restored wild type virulence levels (p < 0.0007 for git2,3,4Δ/Δ + pDDB78 compared with both the WT and git2,3,4Δ/Δ + pDDB78GIT3). Thus, GIT3 is required for full virulence in this infection model.
FIGURE 8.
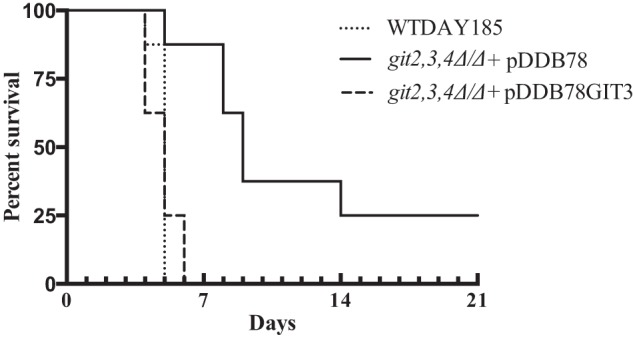
Loss of GroPCho transport activity reduces virulence in a mouse model hematogenously disseminated infection. Mice were injected intravenously with WT-DAY185, git2,3,4Δ/Δ + pDDB78, and git2,3,4Δ/Δ + pDDB78GIT3 (n = 8 per strain). Survival was monitored for 21 days. p < 0.0007 for git2,3,4Δ/Δ + pDDB78 was compared with both the WT-DAY185 and git2,3,4Δ/Δ + pDDB78GIT3 strains.
Multiple Homologs of the Git Family Are Found in Many Candida Species
C. albicans and its close relative C. dubliniensis each possess four paralogs of the Git family, which we have named Git1, Git2, Git3, and Git4 (Fig. 9). Other species of the CTG clade (44) have two or three members of this protein family, whereas S. cerevisiae and K. lactis each possess only one Git homolog. Based on the robustly supported phylogenetic tree, homologs among Candida species can for the most part be grouped into one of four clades based on similarity to the C. albicans proteins (Fig. 9). The Git1 cluster appears to be evolutionarily stable, and the Git2/3/4 cluster more dynamic. Therefore, following the divergence of these two main clusters, there does not appear to be any subsequent gains or losses of genes among Git1 orthologs, although at least two additional gene duplications have occurred during the radiation of the Candida to create the Git2, Git3, and Git4 proteins likely followed by subsequent losses of genes. Interestingly, the phylogenetic placement of the single proteins found in S. cerevisiae and K. lactis, along with the presence of a Y. lipolytica protein in both the Git1 and Git2/3/4 clusters, suggests that the gene duplication creating these two clusters may have occurred prior to the diversification of the Saccharomycetales and well before the whole genome duplication event in Saccharomyces. Although the biochemical activity, if any, of Git2 remains to be elucidated, it is worth noting that it is most similar in sequence to Git3 and that only the sister species C. albicans and C. dubliniensis retain all four paralogs.
FIGURE 9.
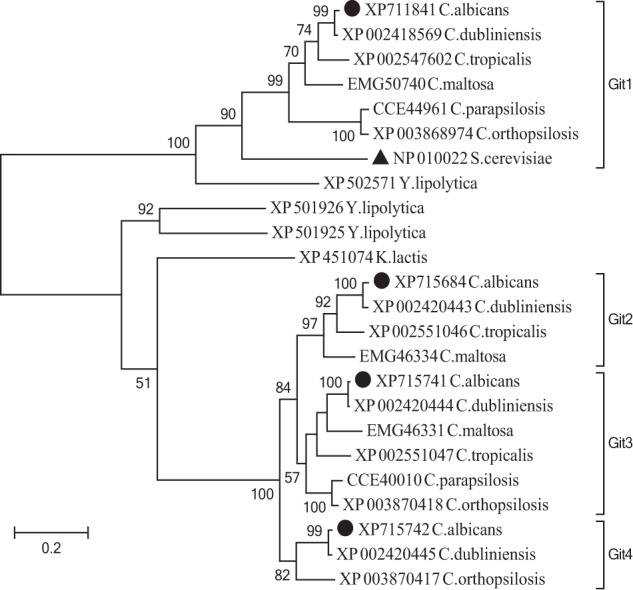
Homologous proteins among Candida species form distinct Git clades. Maximum likelihood tree of C. albicans (●) Git1 to Git4 proteins and homologs from related Candida species, along with additional Saccharomycetales including S. cerevisiae Git1 (▴). Bootstrap values from 10,000 replicates are given at nodes with greater than 50% support. The tree is drawn to scale, with branch lengths measured in a number of substitutions per site and rooted at the midpoint. Neighbor-joining methods produce trees with identical topology at all nodes (data not shown).
DISCUSSION
In this study, we have characterized multiple aspects of GroPCho transport and utilization in C. albicans, have identified several ways in which this metabolism differs from that which occurs in the nonpathogenic S. cerevisiae (Fig. 10), and have linked GroPCho transport to fungal pathogenicity. GroPCho is produced through the activity of deacylating phospholipases (Fig. 10C), such as those of the A1-, A2-, and B-type, that are widespread, having been found in bacteria (45, 46), fungi (7), and humans (47). Thus, GroPCho is a common metabolite, and its presence has been noted in several locations relevant to C. albicans infection, including serum (11, 12, 14–19), the gastrointestinal tract, and the urinary tract (11, 17, 19, 20).
Our work and that of others have shown that GroPXs are not dead-end metabolites but are recycled into biological molecules through some combination of transport and hydrolysis (Fig. 10) (22, 38, 39, 48–50). The ability of C. albicans to utilize GroPXs is expanded as compared with the nonpathogenic S. cerevisiae (22). S. cerevisiae has one transporter (ScGit1) whose preferred substrate is GroPIns. Furthermore, ScGit1 has only marginal GroPCho transport activity (Fig. 10B). In contrast, C. albicans has four ORFs with similarity to ScGIT1 and much greater GroPCho transport activity (Fig. 10A) (22). Although we previously reported that Git1 transports GroPIns (22), the data presented here indicate that Git3 and Git4 are GroPCho transporters. Evidence to support this conclusion is 2-fold as follows: (i) either Git3 or Git4 is required for early post-inoculation growth when GroPCho is supplied as sole phosphate source (Fig. 1A), and (ii) measurable transport of GroPCho requires either Git3 or Git4, with Git3 displaying much greater initial transport activity (Fig. 2, A and B). Although GroPCho transport has been described in E. coli (51, 52), and a GroPIns permease (GLUT2) has been identified in mammalian cells (53), to the best of our knowledge this is the first identification of a GroPCho-specific permease in a eukaryotic organism.
At least three reasons exist for our inability to identify a role for Git2 in these studies. The first is that Git2 may transport a metabolite that was not tested, for example glycerophosphoserine or glycerophosphoethanolamine. The second is that GIT2 was not sufficiently expressed under our experimental conditions. Although we did detect GIT2 transcript by quantitative RT-PCR, as others have using RNA-seq (54), it was at a level roughly 6-fold less than that of GIT3 under high phosphate (repressing) conditions (data not shown). Finally, Git2 may simply not act as a GroPX transporter or possess any other activity that would have been detected in this study.
Despite lacking a GroPCho transporter, a git2,3,4Δ/Δ mutant is able to initiate growth on GroPCho 12–18 h post-inoculation (Fig. 1A), suggesting that an alternative mechanism for GroPCho utilization is initiated in that time frame. Our data, obtained using [3H]GroPCho in which the choline molecule was labeled, indicate that this alternative mechanism involves the extracellular hydrolysis of [3H]GroPCho to [3H]choline and GroP, as we observe the production of extracellular [3H]choline (Fig. 4D). Presumably, the unlabeled GroP is hydrolyzed to release free phosphate that is utilized by the cell. The hydrolysis of [3H]GroPCho into [3H]choline and GroP is the most likely pathway given that we did not detect [3H]choline-phosphate in internal or external fractions. It is worth noting that this transporter-independent pathway for GroPCho utilization does not exist in S. cerevisiae, where deletion of ScGIT1 completely abolishes the ability of cells to utilize GroPCho as a phosphate source (39).
GroPXs are hydrolyzed to GroP and their respective alcohol by glycerophosphodiesterases (8, 55). To better understand GroPCho catabolism in C. albicans, we deleted GDE1 (ORF 19.3936), which is predicted to be a cytosolic protein with a glycerophosphodiester phosphodiesterase domain. Gde1 is highly similar to the only known GroPCho glycerophosphodiesterase in S. cerevisiae (ScGde1) and is annotated in CGD as a glycerophosphodiester glycerophosphodiesterase using InterPro (IPR004129) (56). Loss of GDE1 resulted in a buildup of internal GroPCho (Figs. 3B and 7), providing evidence that Gde1 acts upon internal GroPCho. The fact that we did not detect an increase in external GroPCho upon loss of GDE1 (data not shown) and that Gde1 does not contain a predicted signal peptide or GPI-anchor attachment site suggests that Gde1 is not acting externally. Clearly, other gene products must exist that are capable of catabolizing GroPCho but are not highly similar to a standard glycerophosphodiesterase (IPR004129). This fact also stands in contrast to that which occurs in S. cerevisiae, where deletion of ScGDE1 renders the cells unable to grow on GroPCho as a phosphate source (39).
As has been reported for plants (48, 49) and bacteria (50–52), we show here that GroPCho utilization in C. albicans is linked to phosphate limitation. PHO4 and GRF10 are orthologs to ScPHO4 and ScPHO2 (4), genes that encode transcription factors that regulate phosphate-responsive genes in S. cerevisiae (40, 41). As was the case for Git1 (22), the expression of GIT3, GIT4, and GDE1 is governed by the transcriptional regulator Pho4 (Fig. 5C). However, loss of GRF10 does not affect the ability of C. albicans to utilize GroPCho (data not shown). Additionally, GRF10 does not a regulate the expression of GIT1 (22), and others have noted that it does not appear to be involved in the phosphate response in C. albicans (21). Interestingly, a recent report indicates that phosphate limitation might have implications for C. albicans virulence (21). In this study, C. albicans strains isolated from the stool of critically ill patients underwent filamentation and expressed a lethal phenotype against mice and C. elegans upon phosphate limitation (21). It is tempting to speculate that the phosphate-regulated genes involved in utilization of GroPIns (Git1) (22) and GroPCho (Git3, Git4, and Gde1) may play a role in these phenotypes.
Besides acting as a nutrient source, other functions have been ascribed to GroPCho. A well known function involves osmotic regulation in renal medullary tissue of mammals, where GroPCho counteracts the effects of high NaCl and urea concentrations (12, 13). In the fungal pathogen, Cryptococcus neoformans, GroPCho appears to be required for capsule enlargement (57). Capsule enlargement is necessary for this organism's virulence, as it provides protection from phagocytosis as well as oxidation (57). A C. neoformans strain lacking phospholipase B1 (PLB1) loses its ability to enlarge its capsule, but supplementation of GroPCho rescues this phenotype (57). Interestingly, C. neoformans contains a putative protein that is 42% similar (NCBI-Blast) to Git3 suggesting that it may also transport intact GroPCho.
We have shown previously that C. albicans is able to utilize GroPCho under conditions of elevated temperature and pH found in the human body (22). Here, we show that C. albicans employs Git3 to transport and Gde1 to metabolize GroPCho in the presence of serum and the concentration of phosphate found in serum, roughly 1 mm (Fig. 7). These results indicating that GroPCho transport and metabolism are physiological relevant functions under conditions of human infection, prompted us to perform mouse virulence studies on a strain lacking GroPCho transport capability. As shown in Fig. 8, a git2,3,4Δ/Δ mutant exhibits a virulence defect compared with the wild type strain, and reintegration of a single copy of GIT3 into the git2,3,4Δ/Δ mutant restored wild type virulence levels. Thus, the major GroPCho transporter, Git3, is required for full virulence in a mouse model of blood stream infection. Of note, the phylogenetic tree of Git homologs (Fig. 9) suggests that several other Candida species with Git3 and Git4 orthologs may similarly possess GroPCho transport activity.
This work was supported, in whole or in part, by National Institutes of Health Grants R15GM104876 (to J. P.-V.), R01AI070272 (to A. P. M.), and R01AI054928 (to S. G. F.). This work was also supported by National Science Foundation Grant BCS-0922525 (to M. J. S.).
- PLB
- phospholipase B
- GroPX
- glycerophosphodiester
- GroPCho
- glycerophosphocholine
- GroPIns
- glycerophosphoinositol
- GroP
- glycerol 3-phosphate
- PC
- phosphatidylcholine
- nt
- nucleotide
- YNB
- yeast nitrogen base
- qPCR
- quantitative PCR
- XTT
- 2,3-bis-(2-methoxy-4-nitro-5-sulfophenyl)-5-[(phenylamino) carbonyl]-2H-tetrazolium hydroxide
- DI
- deionized
- ODU
- optical density unit.
REFERENCES
- 1. Fisher J. F., Kavanagh K., Sobel J. D., Kauffman C. A., Newman C. A. (2011) Candida urinary tract infection: pathogenesis. Clin. Infect. Dis. 52, S437–S451 [DOI] [PubMed] [Google Scholar]
- 2. Pappas P. G., Kauffman C. A., Andes D., Benjamin D. K., Jr., Calandra T. F., Edwards J. E., Jr., Filler S. G., Fisher J. F., Kullberg B. J., Ostrosky-Zeichner L., Reboli A. C., Rex J. H., Walsh T. J., Sobel J. D., and Infectious Diseases Society of America (2009) Clinical practice guidelines for the management of candidiasis: 2009 update by the Infectious Diseases Society of America. Clin. Infect. Dis. 48, 503–535 [DOI] [PMC free article] [PubMed] [Google Scholar]
- 3. Wisplinghoff H., Bischoff T., Tallent S. M., Seifert H., Wenzel R. P., Edmond M. B. (2004) Nosocomial bloodstream infections in US hospitals: analysis of 24,179 cases from a prospective nationwide surveillance study. Clin. Infect. Dis. 39, 309–317 [DOI] [PubMed] [Google Scholar]
- 4. Braun B. R., van Het Hoog M., d'Enfert C., Martchenko M., Dungan J., Kuo A., Inglis D. O., Uhl M. A., Hogues H., Berriman M., Lorenz M., Levitin A., Oberholzer U., Bachewich C., Harcus D., Marcil A., Dignard D., Iouk T., Zito R., Frangeul L., Tekaia F., Rutherford K., Wang E., Munro C. A., Bates S., Gow N. A., Hoyer L. L., Köhler G., Morschhäuser J., Newport G., Znaidi S., Raymond M., Turcotte B., Sherlock G., Costanzo M., Ihmels J., Berman J., Sanglard D., Agabian N., Mitchell A. P., Johnson A. D., Whiteway M., Nantel A. (2005) A human-curated annotation of the Candida albicans genome. PLoS Genet. 1, 36–57 [DOI] [PMC free article] [PubMed] [Google Scholar]
- 5. Moran G. P., Coleman D. C., Sullivan D. J. (2011) Comparative genomics and the evolution of pathogenicity in human pathogenic fungi. Eukaryot. Cell 10, 34–42 [DOI] [PMC free article] [PubMed] [Google Scholar]
- 6. Ghannoum M. A. (2000) Potential role of phospholipases in virulence and fungal pathogenesis. Clin. Microbiol. Rev. 13, 122–143 [DOI] [PMC free article] [PubMed] [Google Scholar]
- 7. Köhler G. A., Brenot A., Haas-Stapleton E., Agabian N., Deva R., Nigam S. (2006) Phospholipase A2 and phospholipase B activities in fungi. Biochim. Biophys. Acta 1761, 1391–1399 [DOI] [PMC free article] [PubMed] [Google Scholar]
- 8. Patton-Vogt J. (2007) Transport and metabolism of glycerophosphodiesters produced through phospholipid deacylation. Biochim. Biophys. Acta 1771, 337–342 [DOI] [PubMed] [Google Scholar]
- 9. Leidich S. D., Ibrahim A. S., Fu Y., Koul A., Jessup C., Vitullo J., Fonzi W., Mirbod F., Nakashima S., Nozawa Y., Ghannoum M. A. (1998) Cloning and disruption of caPLB1, a phospholipase B gene involved in the pathogenicity of Candida albicans. J. Biol. Chem. 273, 26078–26086 [DOI] [PubMed] [Google Scholar]
- 10. Theiss S., Ishdorj G., Brenot A., Kretschmar M., Lan C. Y., Nichterlein T., Hacker J., Nigam S., Agabian N., Köhler G. A. (2006) Inactivation of the phospholipase B gene PLB5 in wild type Candida albicans reduces cell-associated phospholipase A2 activity and attenuates virulence. Int. J. Med. Microbiol. 296, 405–420 [DOI] [PMC free article] [PubMed] [Google Scholar]
- 11. Backshall A., Alferez D., Teichert F., Wilson I. D., Wilkinson R. W., Goodlad R. A., Keun H. C. (2009) Detection of metabolic alterations in non-tumor gastrointestinal tissue of the Apc(Min+) mouse by 1H MAS NMR spectroscopy. J. Proteome Res. 8, 1423–1430 [DOI] [PubMed] [Google Scholar]
- 12. Gallazzini M., Burg M. B. (2009) What's new about osmotic regulation of glycerophosphocholine. Physiology 24, 245–249 [DOI] [PMC free article] [PubMed] [Google Scholar]
- 13. Gallazzini M., Ferraris J. D., Burg M. B. (2008) GDPD5 is a glycerophosphocholine phosphodiesterase that osmotically regulates the osmoprotective organic osmolyte GPC. Proc. Natl. Acad. Sci. U.S.A. 105, 11026–11031 [DOI] [PMC free article] [PubMed] [Google Scholar]
- 14. Ilcol Y. O., Ozbek R., Hamurtekin E., Ulus I. H. (2005) Choline status in newborns, infants, children, breast-feeding women, breast-fed infants and human breast milk. J. Nutr. Biochem. 16, 489–499 [DOI] [PubMed] [Google Scholar]
- 15. Klein J., Gonzalez R., Köppen A., Löffelholz K. (1993) Free choline and choline metabolites in rat brain and body fluids: sensitive determination and implications for choline supply to the brain. Neurochem. Int. 22, 293–300 [DOI] [PubMed] [Google Scholar]
- 16. Paban V., Fauvelle F., Alescio-Lautier B. (2010) Age-related changes in metabolic profiles of rat hippocampus and cortices. Eur. J. Neurosci. 31, 1063–1073 [DOI] [PubMed] [Google Scholar]
- 17. Senar S., Recio M. N., Pérez-Albarsanz M. A. (1994) Lindane affects phosphoinositide turnover through a different mechanism of the phosphatidylinositol synthesis inhibition in rat renal proximal tubule cell culture. Cell. Signal. 6, 433–438 [DOI] [PubMed] [Google Scholar]
- 18. Walter A., Korth U., Hilgert M., Hartmann J., Weichel O., Hilgert M., Fassbender K., Schmitt A., Klein J. (2004) Glycerophosphocholine is elevated in cerebrospinal fluid of Alzheimer patients. Neurobiol. Aging 25, 1299–1303 [DOI] [PubMed] [Google Scholar]
- 19. Wang Y., Holmes E., Comelli E. M., Fotopoulos G., Dorta G., Tang H., Rantalainen M. J., Lindon J. C., Corthésy-Theulaz I. E., Fay L. B., Kochhar S., Nicholson J. K. (2007) Topographical variation in metabolic signatures of human gastrointestinal biopsies revealed by high-resolution magic-angle spinning 1H NMR spectroscopy. J. Proteome Res. 6, 3944–3951 [DOI] [PubMed] [Google Scholar]
- 20. Wang Y., Tang H., Holmes E., Lindon J. C., Turini M. E., Sprenger N., Bergonzelli G., Fay L. B., Kochhar S., Nicholson J. K. (2005) Biochemical characterization of rat intestine development using high-resolution magic-angle-spinning 1H NMR spectroscopy and multivariate data analysis. J. Proteome Res. 4, 1324–1329 [DOI] [PubMed] [Google Scholar]
- 21. Romanowski K., Zaborin A., Valuckaite V., Rolfes R. J., Babrowski T., Bethel C., Olivas A., Zaborina O., Alverdy J. C. (2012) Candida albicans isolates from the gut of critically ill patients respond to phosphate limitation by expressing filaments and a lethal phenotype. PLoS One 7, 1–11 [DOI] [PMC free article] [PubMed] [Google Scholar]
- 22. Bishop A. C., Sun T., Johnson M. E., Bruno V. M., Patton-Vogt J. (2011) Robust utilization of phospholipase-generated metabolites, glycerophosphodiesters, by Candida albicans: role of the CaGit1 permease. Eukaryot. Cell 10, 1618–1627 [DOI] [PMC free article] [PubMed] [Google Scholar]
- 23. Gaur M., Puri N., Manoharlal R., Rai V., Mukhopadhayay G., Choudhury D., Prasad R. (2008) MFS transportome of the human pathogenic yeast Candida albicans. BMC Genomics 9, 579. [DOI] [PMC free article] [PubMed] [Google Scholar]
- 24. Patton J. L., Pessoa-Brandao L., Henry S. A. (1995) Production and reutilization of an extracellular phosphatidylinositol catabolite, glycerophosphoinositol, by Saccharomyces cerevisiae. J. Bacteriol. 177, 3379–3385 [DOI] [PMC free article] [PubMed] [Google Scholar]
- 25. Ganguly S., Mitchell A. P. (2012) Mini-blaster-mediated targeted gene disruption and marker complementation in Candida albicans. Methods Mol. Biol. 845, 19–39 [DOI] [PMC free article] [PubMed] [Google Scholar]
- 26. Wilson R. B., Davis D., Enloe B. M., Mitchell A. P. (2000) A recyclable Candida albicans URA3 cassette for PCR product-directed gene disruptions. Yeast 16, 65–70 [DOI] [PubMed] [Google Scholar]
- 27. Hama H., Takemoto J. Y., DeWald D. B. (2000) Analysis of phosphoinositides in protein trafficking. Methods 20, 465–473 [DOI] [PubMed] [Google Scholar]
- 28. Hanes C. S. (1932) Studies on plant amylases: The effect of starch concentration upon the velocity of hydrolysis by the amylase of germinated barley. Biochem. J. 26, 1406–1421 [DOI] [PMC free article] [PubMed] [Google Scholar]
- 29. Dowd S. R., Bier M. E., Patton-Vogt J. L. (2001) Turnover of phosphatidylcholine in Saccharomyces cerevisiae. The role of the CDP-choline pathway. J. Biol. Chem. 276, 3756–3763 [DOI] [PubMed] [Google Scholar]
- 30. Cook S. J., Wakelam M. J. (1989) Analysis of the water-soluble products of phosphatidylcholine breakdown by ion-exchange chromatography. Bombesin and TPA (12-O-tetradecanoylphorbol 13-acetate) stimulate choline generation in Swiss 3T3 cells by a common mechanism. Biochem. J. 263, 581–587 [DOI] [PMC free article] [PubMed] [Google Scholar]
- 31. Elion E. A., Warner J. R. (1984) The major promoter element of rRNA transcription in yeast lies 2 kb upstream. Cell 39, 663–673 [DOI] [PubMed] [Google Scholar]
- 32. Pfaffl M. W. (2001) A new mathematical model for relative quantification in real-time RT-PCR. Nucleic Acids Res. 29, e45. [DOI] [PMC free article] [PubMed] [Google Scholar]
- 33. Taff H. T., Nett J. E., Andes D. R. (2012) Comparative analysis of Candida biofilm quantitation assays. Med. Mycol. 50, 214–218 [DOI] [PMC free article] [PubMed] [Google Scholar]
- 34. Larkin M. A., Blackshields G., Brown N. P., Chenna R., McGettigan P. A., McWilliam H., Valentin F., Wallace I. M., Wilm A., Lopez R., Thompson J. D., Gibson T. J., Higgins D. G. (2007) Clustal W and Clustal X version 2.0. Bioinformatics 23, 2947–2948 [DOI] [PubMed] [Google Scholar]
- 35. Tamura K., Peterson D., Peterson N., Stecher G., Nei M., Kumar S. (2011) MEGA5: molecular evolutionary genetics analysis using maximum likelihood, evolutionary distance, and maximum parsimony methods. Mol. Biol. Evol. 28, 2731–2739 [DOI] [PMC free article] [PubMed] [Google Scholar]
- 36. Johnson M., Zaretskaya I., Raytselis Y., Merezhuk Y., McGinnis S., Madden T. L. (2008) NCBI BLAST: a better web interface. Nucleic Acids Res. 36, W5–W9 [DOI] [PMC free article] [PubMed] [Google Scholar]
- 37. Almaguer C., Cheng W., Nolder C., Patton-Vogt J. (2004) Glycerophosphoinositol, a novel phosphate source whose transport is regulated by multiple factors in Saccharomyces cerevisiae. J. Biol. Chem. 279, 31937–31942 [DOI] [PubMed] [Google Scholar]
- 38. Fernández-Murray J. P., McMaster C. R. (2005) Glycerophosphocholine catabolism as a new route for choline formation for phosphatidylcholine synthesis by the Kennedy pathway. J. Biol. Chem. 280, 38290–38296 [DOI] [PubMed] [Google Scholar]
- 39. Fisher E., Almaguer C., Holic R., Griac P., Patton-Vogt J. (2005) Glycerophosphocholine-dependent growth requires Gde1p (YPL110c) and Git1p in Saccharomyces cerevisiae. J. Biol. Chem. 280, 36110–36117 [DOI] [PubMed] [Google Scholar]
- 40. Mouillon J. M., Persson B. L. (2006) New aspects on phosphate sensing and signalling in Saccharomyces cerevisiae. FEMS Yeast Res. 6, 171–176 [DOI] [PubMed] [Google Scholar]
- 41. Persson B. L., Lagerstedt J. O., Pratt J. R., Pattison-Granberg J., Lundh K., Shokrollahzadeh S., Lundh F. (2003) Regulation of phosphate acquisition in Saccharomyces cerevisiae. Curr. Genet. 43, 225–244 [DOI] [PubMed] [Google Scholar]
- 42. Heimburger D. C., Koethe J. R., Nyirenda C., Bosire C., Chiasera J. M., Blevins M., Munoz A. J., Shepherd B. E., Potter D., Zulu I., Chisembele-Taylor A., Chi B. H., Stringer J. S., Kabagambe E. K. (2010) Serum phosphate predicts early mortality in adults starting antiretroviral therapy in Lusaka, Zambia: a prospective cohort study. PLoS One 5, e10687. [DOI] [PMC free article] [PubMed] [Google Scholar]
- 43. Ghosh S., Sengupta A., Sharma S., Sonawat H. M. (2012) Metabolic fingerprints of serum, brain, and liver are distinct for mice with cerebral and noncerebral malaria: a 1H NMR spectroscopy-based metabonomic study. J. Proteome Res. 11, 4992–5004 [DOI] [PubMed] [Google Scholar]
- 44. Santos M. A., Ueda T., Watanabe K., Tuite M. F. (1997) The non-standard genetic code of Candida spp.: an evolving genetic code or a novel mechanism for adaptation? Mol. Microbiol. 26, 423–431 [DOI] [PubMed] [Google Scholar]
- 45. Farn J. L., Strugnell R. A., Hoyne P. A., Michalski W. P., Tennent J. M. (2001) Molecular characterization of a secreted enzyme with phospholipase B activity from Moraxella bovis. J. Bacteriol. 183, 6717–6720 [DOI] [PMC free article] [PubMed] [Google Scholar]
- 46. Jiang F., Huang S., Imadad K., Li C. (2012) Cloning and expression of a gene with phospholipase B activity from Pseudomonas fluorescens in Escherichia coli. Bioresour. Technol. 104, 518–522 [DOI] [PubMed] [Google Scholar]
- 47. Xu S., Zhao L., Larsson A., Venge P. (2009) The identification of a phospholipase B precursor in human neutrophils. FEBS J. 276, 175–186 [DOI] [PubMed] [Google Scholar]
- 48. Cheng L., Bucciarelli B., Liu J., Zinn K., Miller S., Patton-Vogt J., Allan D., Shen J., Vance C. P. (2011) White lupin cluster root acclimation to phosphorus deficiency and root hair development involve unique glycerophosphodiester phosphodiesterases. Plant Physiol. 156, 1131–1148 [DOI] [PMC free article] [PubMed] [Google Scholar]
- 49. Cheng Y., Zhou W., El Sheery N. I., Peters C., Li M., Wang X., Huang J. (2011) Characterization of the Arabidopsis glycerophosphodiester phosphodiesterase (GDPD) family reveals a role of the plastid-localized AtGDPD1 in maintaining cellular phosphate homeostasis under phosphate starvation. Plant J. 66, 781–795 [DOI] [PubMed] [Google Scholar]
- 50. Ohshima N., Yamashita S., Takahashi N., Kuroishi C., Shiro Y., Takio K. (2008) Escherichia coli cytosolic glycerophosphodiester phosphodiesterase (UgpQ) requires Mg2+, Co2+, or Mn2+ for its enzyme activity. J. Bacteriol. 190, 1219–1223 [DOI] [PMC free article] [PubMed] [Google Scholar]
- 51. Brzoska P., Boos W. (1988) Characteristics of a ugp-encoded and phoB-dependent glycerophosphoryl diester phosphodiesterase which is physically dependent on the ugp transport system of Escherichia coli. J. Bacteriol. 170, 4125–4135 [DOI] [PMC free article] [PubMed] [Google Scholar]
- 52. Overduin P., Boos W., Tommassen J. (1988) Nucleotide sequence of the ugp genes of Escherichia coli K-12: homology to the maltose system. Mol. Microbiol. 2, 767–775 [DOI] [PubMed] [Google Scholar]
- 53. Mariggiò S., Iurisci C., Sebastià J., Patton-Vogt J., Corda D. (2006) Molecular characterization of a glycerophosphoinositol transporter in mammalian cells. FEBS Lett. 580, 6789–6796 [DOI] [PubMed] [Google Scholar]
- 54. Bruno V. M., Wang Z., Marjani S. L., Euskirchen G. M., Martin J., Sherlock G., Snyder M. (2010) Comprehensive annotation of the transcriptome of the human fungal pathogen Candida albicans using RNA-seq. Genome Res. 20, 1451–1458 [DOI] [PMC free article] [PubMed] [Google Scholar]
- 55. Yanaka N. (2007) Mammalian glycerophosphodiester phosphodiesterases. Biosci. Biotechnol. Biochem. 71, 1811–1818 [DOI] [PubMed] [Google Scholar]
- 56. Hunter S., Jones P., Mitchell A., Apweiler R., Attwood T. K., Bateman A., Bernard T., Binns D., Bork P., Burge S., de Castro E., Coggill P., Corbett M., Das U., Daugherty L., Duquenne L., Finn R. D., Fraser M., Gough J., Haft D., Hulo N., Kahn D., Kelly E., Letunic I., Lonsdale D., Lopez R., Madera M., Maslen J., McAnulla C., McDowall J., McMenamin C., Mi H., Mutowo-Muellenet P., Mulder N., Natale D., Orengo C., Pesseat S., Punta M., Quinn A. F., Rivoire C., Sangrador-Vegas A., Selengut J. D., Sigrist C. J., Scheremetjew M., Tate J., Thimmajanarthanan M., Thomas P. D., Wu C. H., Yeats C., Yong S. Y. (2012) InterPro in 2011: new developments in the family and domain prediction database. Nucleic Acids Res. 40, D306–D312 [DOI] [PMC free article] [PubMed] [Google Scholar]
- 57. Chrisman C. J., Albuquerque P., Guimaraes A. J., Nieves E., Casadevall A. (2011) Phospholipids trigger Cryptococcus neoformans capsular enlargement during interactions with amoebae and macrophages. PLoS Pathog. 7, e1002047. [DOI] [PMC free article] [PubMed] [Google Scholar]
- 58. Davis D. A., Bruno V. M., Loza L., Filler S. G., Mitchell A. P. (2002) Candida albicans Mds3p, a conserved regulator of pH responses and virulence identified through insertional mutagenesis. Genetics 162, 1573–1581 [DOI] [PMC free article] [PubMed] [Google Scholar]
- 59. Homann O. R., Dea J., Noble S. M., Johnson A. D. (2009) A phenotypic profile of the Candida albicans regulatory network. PLoS Genet. 5, e1000783. [DOI] [PMC free article] [PubMed] [Google Scholar]