

Abstract
Creatine (Cr), phosphocreatine (PCr) and adenosine-5-triphosphate (ATP) are the major metabolites of the enzyme creatine kinase (CK). The exchange rate of amine protons of CK metabolites at physiological conditions has been limited so far. In the current study, the exchange rate and logarithmic dissociation constant (pKa) of amine protons of CK metabolites were calculated. Further, the chemical exchange saturation transfer effect (CEST) of amine protons of CK metabolites with bulk water was explored. At physiological temperature and pH, the exchange rate of amine protons in Cr was found to be 7–8 times higher than PCr and ATP. Higher exchange rate in Cr is associated with lower pKa value suggesting the faster dissociation of its amine protons when compared to PCr and ATP. CEST MR imaging of these metabolites in vitro in phantoms displayed predominant CEST contrast from Cr and negligible contribution from PCr and ATP with the saturation pulse parameters used in the current study. These results provide a new method to perform high resolution proton imaging of Cr without any contamination from PCr. Potential applications of these finding in biomedical imaging are discussed.
Keywords: Creatine, Phosphocreatine, Adenosine-5-triphosphate, Chemical shift, Exchange rate, Acid dissociation constant, Chemical exchange saturation transfer, Magnetic resonance imaging
Introduction
Creatine kinase (CK) is an important enzyme in the biological system and catalyses the reversible conversion of creatine (Cr) into phosphocreatine (PCr) by utilizing adenosine-5’-triphosphate (ATP) (1).
Non-invasive measurements of these CK metabolites in vivo both in normal and pathological conditions were performed previously using magnetic resonance spectroscopy (MRS). While 1H MRS has been widely used to quantify the total Cr (Cr + PCr) concentration,(2–4) 31P MRS has been used to study kinetics of CK by measuring the PCr and ATP (5–9). Even though MRS is able to provide accurate concentration of these metabolites in vivo, it suffers from low resolution and long acquisition times. Furthermore, there is no MR method available at present to quantify free Cr separately from PCr at high resolution. Earlier, Gruetter and coworkers had described the differentiation of N-methylene protons of Cr and PCr using a 9.4T MRI scanner (10,11). However, at lower field strengths (<9.4T) it is not possible to resolve these two resonances.
Here, we explore chemical exchange saturation transfer (CEST) magnetic resonance (MR) to image these CK metabolites in phantoms based on their exchangeable amine (-NH2) protons. In the CEST experiment, saturation of the exchangeable amine protons by radiofrequency pulse and simultaneous exchange transfer of their magnetization to bulk water results in proportionate decrease in bulk water signal (12–14). The CEST technique has been widely used to map different metabolites and macromolecules in vivo. Briefly, chemical exchange between bulk water and amide/amine/hydroxyl protons from different amino acids, proteins and other molecules have been exploited to measure pH, hepatic glycogen, cartilage glycosaminglycans, gene expression, myoinositol and glutamate in vivo (15–19).
To image and differentiate these CK metabolites from each other in a CEST experiment, not only should their amine proton exchange rates (k) be lower than their chemical shift difference (Δω) between water (Δω > k) but also should differ significantly. However, the information on exchange rates of the amine protons from the CK metabolites at physiological temperature and pH is limited. Therefore, in the current study, using high resolution NMR (nuclear magnetic resonance) spectroscopy we have first defined the exchangeable amine resonances from Cr, PCr and ATP phantoms. Exchange rate of amine protons for each of the CK metabolite was then measured. We demonstrate that, by appropriate choice of saturation pulse parameters, it is feasible to image free Cr without appreciable contamination from other CK metabolites under physiological conditions.
Materials and Methods
Theory
In CEST experiments, frequency selective saturation of solute spins that are in exchange with solvent spins (e.g., water) leads to the transfer of saturated magnetization to the solvent thus decreasing the signal intensity of the solvent spins. Subsequently, longitudinal relaxation returns each nuclear spin system to its equilibrium values and eventually the system reaches a steady state. The steady state magnetization is given as:
| [1] |
where Msat∞ is the steady-state amplitude of the water proton magnetization during the irradiation of exchangeable solute spins; M0 is the amplitude of the water proton magnetization in the absence of saturation, k1 is the pseudo first order exchange rate constant, and T1w is the longitudinal relaxation time of water protons (13,14,20). This magnetization is then imaged to detect the CEST effect from solute nuclear spins. In order for the CEST effect to be efficiently observed, the slow to intermediate exchange condition (Δω > k) must be fulfilled where Δω is the chemical shift (or offset frequency) of the exchanging spins and k is the exchange rate. In general the CEST effect of the solute spins is computed using following equation:
| [2] |
where, M0 is the water equilibrium magnetization, Msat (±Δω) are the water magnetizations obtained with saturation at a ‘+’ or ‘−’ Δω offset of the water resonance. In interpreting the CEST effect, other factors that play role are the amplitude and duration of the saturation pulse. These effects can be incorporated into a general solution obtainable from a theoretical analysis of a two-site exchange model in the presence of solute saturation. An analytical expression for the CEST effect can be derived (16,21–23) as:
| [3] |
where k is exchange rate (s−1 or Hz), α is an efficiency factor with α = 1 describing complete saturation (obtained with a sufficiently high amplitude saturation pulse), f is the fraction of exchangeable protons with respect to the total number of protons including water, R1w (=1/T1w) is the longitudinal relaxation rate of water protons and tsat is the length of the saturation pulse.
Phantom Experiments
Phantom experiment at 9.4T
To identify the amine protons resonances, 100 mM of each CK metabolite was prepared in PBS buffer (pH 7.0) and 99.9% D2O. One dimensional 1H NMR spectra were recorded at different temperatures (10, 25 and 37 °C) using a 9.4T vertical bore magnet with 5mm 1H probe (Varian, Palo Alto, CA). The exchange rate for CK metabolites at physiological temperature was determined using the method described elsewhere (22,24). We have also measured the pKa (=−log Ka, where Ka is dissociation constant) values of exchangeable amine proton from each metabolite at 37 °C. To measure the pKa value, 100mM solution of each metabolite was prepared at different pH and 1D 1H MRS was performed. The area of the amine exchangeable peaks were calculated and plotted as a function of pH. The resulting sigmoid curves were fitted using s-curve function and the point of maximum derivative was identified as pKa value.
Phantom experiment at 3T
For CEST imaging, Cr (10, 20 and 30 mM), PCr (10mM) and ATP and ADP (5mM) solutions were prepared in PBS at pH 7.0. These samples were added to small test tubes (10mm diameter), and immersed inside a large PBS phantom. During the course of experiment temperature was maintained at 37±1 °C using a custom designed stryrofoam chamber. CEST imaging was performed on a 3T Siemens whole body MRI scanner (Siemens Medical Systems, Erlangen, Germany) with a specially optimized saturation pulse train that had 20 Hanning windowed rectangular pulses of 49 ms duration each with a 1 ms delay between them. The saturation pulse excitation bandwidth was 5 Hz for 1 s pulse with 1% bandwidth of 20 Hz. The sequence parameters used were: slice thickness = 10 mm, GRE flip angle=10°, GRE readout TR=5.6 ms, TE =2.7 ms, field of view =100×100 mm2, matrix size =192×192, with one saturation pulse and an acquisition of 64 segments for every 10 s. CEST images were collected using different combinations of saturation pulse amplitude (B1rms) and saturation duration of 1 s. B0 and B1 maps were also acquired to correct for any inhomogeneity. CEST maps were computed using the equation [2]. Where Msat (−Δω) and Msat (Δω) are the B0 corrected MR signals acquired while saturating at −1.8 ppm, +1.8 ppm from water resonance. For the normalization we used Msat (−Δω) instead of M0 to account the direct saturation effect (25). The CEST contrast map was further corrected for any B1 inhomogeneity (17).
In order to determine sensitivity of Cr CEST over 1H MRS, single voxel point resolved spectroscopy (PRESS), water suppressed spectrum (TR=10s, TE=16ms, 16averages) was acquired for 10 mM Cr phantom. The water 1H resonance spectra for the same voxel were obtained by saturating at ±1.8ppm using the same saturation parameters as described above in the case of phantom CEST imaging.
All image processing and data analysis was performed using in-house programs written in MATLAB (version 7.5, R2007b).
Results and Discussion
At 9.4T well-resolved amine proton resonances from Cr (1.8 ppm), PCr (2.5 ppm and ~1.8 ppm), and ATP (2.0ppm) are visible in the 1H NMR spectra at temperatures < 25 °C (Fig. 1, Water peak was referenced to 0 ppm). The ionic form of Cr contains two groups of amine protons (NH2+ and NH2) which show single resonance at 1.8 ppm where as ionic form of PCr contains one amide (resonates at 2.5 ppm) and one amine group (resonates at 1.8 ppm) (Fig. 1). These peaks were broadened with the increase in temperature. At 37 °C, while amine protons from Cr exhibit a broad resonance, those from PCr and ATP still show the presence of sharp peaks but with reduced intensity. Exchangeable amine protons from the CK metabolites were further confirmed from complete line broadening of these resonances in the Hydrogen-Deuterium exchange experiments (Fig. 1). The line broadening of the amine exchangeable protons for Cr at 37 °C clearly suggests a higher exchange rate when compared to PCr and ATP. The exchange rates determined for amine protons from Cr, PCr, and ATP were (950±100 s−1), (140±60 s−1 for 2.5 ppm peak, and 120±50 s−1 for 1.8 ppm peak) and (120±50 s−1), respectively. In PCr, the pKa for the exchangeable amine peak at ~2.5 ppm was 7.96 while for the peak at ~1.8 ppm it was 8.14. The pKa values for the ATP (~2.0 ppm) and Cr (~1.8 ppm) amine exchangeable peaks were 8.17 and 6.6 respectively (Fig. 2). Lower pKa (−log Ka) value for the amine proton suggests its faster dissociation and hence faster exchange with bulk water spins. The higher dissociation constant (lower pKa) in Cr denotes its faster exchange rate when compared to PCr and ATP. Compared to the chemical shift difference at 3T [Cr; Δω= 1300 rad s−1] the exchange rate of Cr amine protons is in slow to intermediate exchange regime while it is in slow exchange regime for PCr and ATP (PCr; Δω = 1900 rad s−1 and ATP; Δω =1500 rad s−1). Exchange rate and pKa value of amine protons of ADP is similar to that of ATP (data not shown).
Figure 1.

High resolution 1H NMR spectra obtained at 9.4T showing sharp amine proton resonances of Cr (1.8ppm), PCr (2.5ppm and ~1.8ppm) and ATP (2.0ppm) at lower temperatures while broadening was observed at higher temperature due to exchange with bulk water. Complete line broadening of these peaks in Hydrogen-Deuterium exchange experiment confirms that these resonances are from exchangeable protons. The chemical structure of Cr, PCr and ATP is shown in figure.
Figure 2.
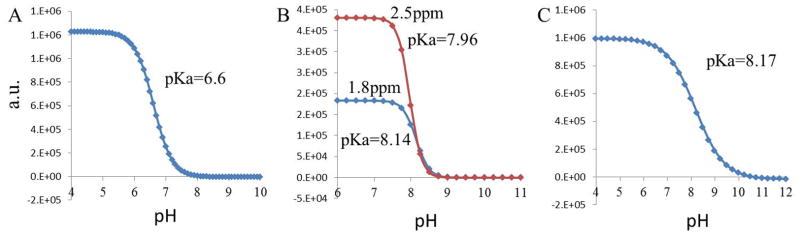
The fitted curves show the plotted integration value of amine exchangeable peak from Cr (A), PCr (B) and ATP (C) as a function of varying pH. The calculated pKa values for each metabolite are shown in figure. The experiment was performed at 9.4T.
Z-spectra and Z-spectra asymmetry curves gathered at 3T showed a broad resonance from Cr centered at ~1.8ppm (Fig. 3). The broadening in the Cr could be due to the higher exchange rate of Cr –NH2 protons. Figure 4A shows the CEST map from Cr, PCr, and ATP at 1.8ppm obtained at 3T. Predominant CEST contrast was observed from Cr. The graph (Fig.4B) shows a linear relationship between Cr CEST and Cr concentration with a slope of 0.6% per mM. The optimal B1rms for Cr CEST mapping with negligible contribution from PCr, ATP and ADP was 155 Hz (Fig.4C). The slow exchange rate of amine protons in PCr, and ATP potentially preclude their CEST detection with these saturation pulse parameters.
Figure 3.
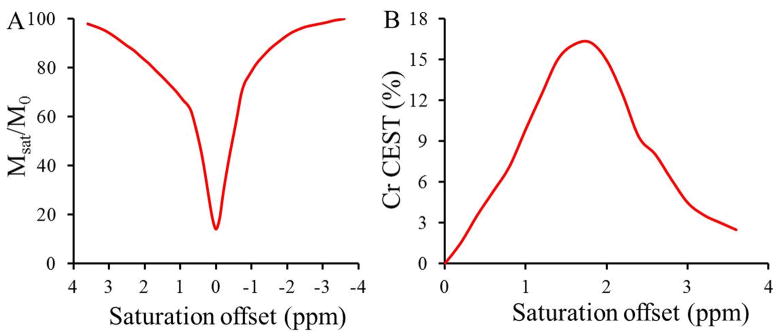
The Z spectra and Z-spectra asymmetry curve gathered on a 3T show a broad resonance from creatine amine protons centered at ~1.8 ppm.
Figure 4.
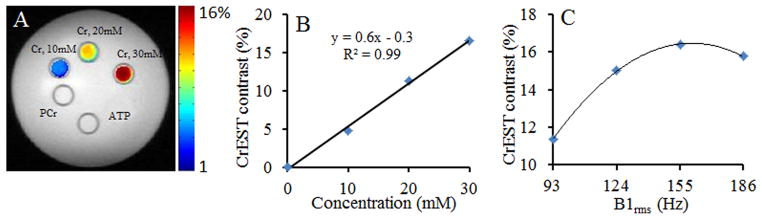
CEST mapping on a 3T MRI scanner. CEST map obtained at 1.8 ppm from different concentration of creatine, phosphocreatine, adenosine-5-triphosphate and adenosine-5-diphosphate overlaid on the anatomical proton image shows the predominant CEST contrast from Cr (A). Negligible CEST contrast was observed from PCr (<0.5%). Figure B shows the linear relationship between Cr CEST and [Cr] with a slope of 0.6%. Graph in figure C shows the B1rms dependent CEST contrast from Cr (30 mM). The optimal B1rms for Cr CEST imaging was 155Hz.
With the experimental parameters used, the actual sensitivity of Cr CEST is ~1500 times higher than 1HMRS at 3T (Fig. 5). This amplification in sensitivity should be good enough to detect relatively small changes in Cr levels at high resolution (voxel size of 0.02 cc).
Figure 5.

Sensitivity of Cr CEST over 1H MRS at 3T MRI scanner. A. Image showing the single voxel localization from a phantom of 30 mM creatine. B. 1H MRS PRESS water suppressed spectrum from the single voxel shown in the image A. The measured amplitude of Cr peak at 3.02 ppm is 1.5 × 10⁵ units. C. Water 1H resonance spectra obtained when a saturation pulse is applied at ±1.8ppm. The subtracted spectrum is shown in D. The amplitude of the difference spectrum is 2.3 × 10⁸ units. With experimental parameters used, the actual sensitivity of Cr CEST is ~ 1500 times higher than 1H MRS.
In summary, the faster amine protons exchange rate in Cr is due to its higher dissociation constant compared to PCr and ATP. The high resolution proton imaging of Cr is possible using CEST technique without any contamination, especially from PCr. Results from this preliminary study potentially provide a new method to measure the changes in [Cr] as well as monitor the kinetics of CK in-vivo in various pathological conditions.
Acknowledgments
This work was performed at an NIH supported resource with funding from P41RR002305. The authors acknowledge Drs. Weixia Liu and Steve Pickup for their technical assistance in using the 9.4 T NMR spectrometer.
Abbreviations
- ADP
Adenosine-5- diphosphate
- ATP
Adenosine-5- triphosphate
- CEST
Chemical Exchange Saturation Transfer
- CK
Creatine Kinase
- Cr
Creatine
- D2O
Deuterium oxide
- MRI
Magnetic Resonance Imaging
- MRS
Magnetic Resonance Spectroscopy
- NMR
Nuclear Magnetic Resonance
- PCr
Phosphocreatine
- PBS
Phosphate Buffer Saline
References
- 1.Goldblatt H. The effect of high salt intake on the blood pressure of rabbits. Lab Invest. 1969;21(2):126–128. [PubMed] [Google Scholar]
- 2.Gill SS, Thomas DG, Van Bruggen N, Gadian DG, Peden CJ, Bell JD, Cox IJ, Menon DK, Iles RA, Bryant DJ, et al. Proton MR spectroscopy of intracranial tumours: in vivo and in vitro studies. J Comput Assist Tomogr. 1990;14(4):497–504. doi: 10.1097/00004728-199007000-00001. [DOI] [PubMed] [Google Scholar]
- 3.Fenstermacher MJ, Narayana PA. Serial proton magnetic resonance spectroscopy of ischemic brain injury in humans. Invest Radiol. 1990;25(9):1034–1039. doi: 10.1097/00004424-199009000-00016. [DOI] [PubMed] [Google Scholar]
- 4.Narayana PA, Johnston D, Flamig DP. In vivo proton magnetic resonance spectroscopy studies of human brain. Magn Reson Imaging. 1991;9(3):303–308. doi: 10.1016/0730-725x(91)90415-i. [DOI] [PubMed] [Google Scholar]
- 5.Schmidt HC, Gooding CA, James TL, Gonzalez-Mendez R, James JL. Comparison of in vivo 31P-MR spectra of the brain, liver, and kidney of adult and infant animals. Pediatr Radiol. 1986;16(2):144–149. doi: 10.1007/BF02386640. [DOI] [PubMed] [Google Scholar]
- 6.Stubbs M, Rodrigues LM, Gusterson BA, Griffiths JR. Monitoring tumor growth and regression by 31P magnetic resonance spectroscopy. Adv Enzyme Regul. 1990;30:217–230. doi: 10.1016/0065-2571(90)90019-x. [DOI] [PubMed] [Google Scholar]
- 7.Kemp GJ, Taylor DJ, Radda GK. Control of phosphocreatine resynthesis during recovery from exercise in human skeletal muscle. NMR Biomed. 1993;6(1):66–72. doi: 10.1002/nbm.1940060111. [DOI] [PubMed] [Google Scholar]
- 8.Cadoux-Hudson TA, Blackledge MJ, Radda GK. Imaging of human brain creatine kinase activity in vivo. FASEB J. 1989;3(14):2660–2666. doi: 10.1096/fasebj.3.14.2629743. [DOI] [PubMed] [Google Scholar]
- 9.Koretsky AP, Brosnan MJ, Chen LH, Chen JD, Van Dyke T. NMR detection of creatine kinase expressed in liver of transgenic mice: determination of free ADP levels. Proc Natl Acad Sci U S A. 1990;87(8):3112–3116. doi: 10.1073/pnas.87.8.3112. [DOI] [PMC free article] [PubMed] [Google Scholar]
- 10.Gruetter R, Weisdorf SA, Rajanayagan V, Terpstra M, Merkle H, Truwit CL, Garwood M, Nyberg SL, Ugurbil K. Resolution improvements in in vivo 1H NMR spectra with increased magnetic field strength. J Magn Reson. 1998;135(1):260–264. doi: 10.1006/jmre.1998.1542. [DOI] [PubMed] [Google Scholar]
- 11.Pfeuffer J, Tkac I, Provencher SW, Gruetter R. Toward an in vivo neurochemical profile: quantification of 18 metabolites in short-echo-time (1)H NMR spectra of the rat brain. J Magn Reson. 1999;141(1):104–120. doi: 10.1006/jmre.1999.1895. [DOI] [PubMed] [Google Scholar]
- 12.Wolff SD, Balaban RS. NMR imaging of labile proton exchange. J Magn Reson. 1990;86:164–169. [Google Scholar]
- 13.Ward KM, Aletras AH, Balaban RS. A new class of contrast agents for MRI based on proton chemical exchange dependent saturation transfer (CEST) J Magn Reson. 2000;143(1):79–87. doi: 10.1006/jmre.1999.1956. [DOI] [PubMed] [Google Scholar]
- 14.Sherry AD, Woods M. Chemical exchange saturation transfer contrast agents for magnetic resonance imaging. Annu Rev Biomed Eng. 2008;10:391–411. doi: 10.1146/annurev.bioeng.9.060906.151929. [DOI] [PMC free article] [PubMed] [Google Scholar]
- 15.Zhou J, Payen JF, Wilson DA, Traystman RJ, van Zijl PC. Using the amide proton signals of intracellular proteins and peptides to detect pH effects in MRI. Nat Med. 2003;9(8):1085–1090. doi: 10.1038/nm907. [DOI] [PubMed] [Google Scholar]
- 16.van Zijl PC, Jones CK, Ren J, Malloy CR, Sherry AD. MRI detection of glycogen in vivo by using chemical exchange saturation transfer imaging (glycoCEST) Proc Natl Acad Sci U S A. 2007;104(11):4359–4364. doi: 10.1073/pnas.0700281104. [DOI] [PMC free article] [PubMed] [Google Scholar]
- 17.Singh A, Haris M, Cai K, Kassey VB, Kogan F, Reddy D, Hariharan H, Reddy R. Chemical exchange saturation transfer magnetic resonance imaging of human knee cartilage at 3 T and 7 T. Magn Reson Med. 2011 doi: 10.1002/mrm.23250. [DOI] [PMC free article] [PubMed] [Google Scholar]
- 18.Haris M, Cai K, Singh A, Hariharan H, Reddy R. In vivo mapping of brain myo-inositol. Neuroimage. 2011;54(3):2079–2085. doi: 10.1016/j.neuroimage.2010.10.017. [DOI] [PMC free article] [PubMed] [Google Scholar]
- 19.Cai K, Haris M, Singh A, Kogan F, Greenberg JH, Hariharan H, Detre JA, Reddy R. Magnetic Resonance Imaging of Glutamate. Nat Med. 2011 doi: 10.1038/nm.2615. In Press. [DOI] [PMC free article] [PubMed] [Google Scholar]
- 20.Ward KM, Balaban RS. Determination of pH using water protons and chemical exchange dependent saturation transfer (CEST) Magn Reson Med. 2000;44(5):799–802. doi: 10.1002/1522-2594(200011)44:5<799::aid-mrm18>3.0.co;2-s. [DOI] [PubMed] [Google Scholar]
- 21.Woessner DE, Zhang S, Merritt ME, Sherry AD. Numerical solution of the Bloch equations provides insights into the optimum design of PARACEST agents for MRI. Magn Reson Med. 2005;53(4):790–799. doi: 10.1002/mrm.20408. [DOI] [PubMed] [Google Scholar]
- 22.McMahon MT, Gilad AA, Zhou J, Sun PZ, Bulte JW, van Zijl PC. Quantifying exchange rates in chemical exchange saturation transfer agents using the saturation time and saturation power dependencies of the magnetization transfer effect on the magnetic resonance imaging signal (QUEST and QUESP): Ph calibration for poly-L-lysine and a starburst dendrimer. Magn Reson Med. 2006;55(4):836–847. doi: 10.1002/mrm.20818. [DOI] [PMC free article] [PubMed] [Google Scholar]
- 23.Zhou J, Wilson DA, Sun PZ, Klaus JA, Van Zijl PC. Quantitative description of proton exchange processes between water and endogenous and exogenous agents for WEX, CEST, and APT experiments. Magn Reson Med. 2004;51(5):945–952. doi: 10.1002/mrm.20048. [DOI] [PubMed] [Google Scholar]
- 24.Gutowsky HS, Saika A. Dissociation, chemical exchange, and the proton magnetic resonance in some aqueous electrolytes. J Chem Phys. 1953;21:1688–1694. [Google Scholar]
- 25.Liu G, Gilad AA, Bulte JW, van Zijl PC, McMahon MT. High-throughput screening of chemical exchange saturation transfer MR contrast agents. Contrast Media Mol Imaging. 2010;5(3):162–170. doi: 10.1002/cmmi.383. [DOI] [PMC free article] [PubMed] [Google Scholar]