

Abstract
Objective
Early biomarkers of Alzheimer’s disease (AD) are needed for developing therapeutic interventions. Measures of attentional control in Stroop-type tasks discriminate healthy aging from early stage AD (Hutchison et al., 2010) and predict future development of AD (Balota et al., 2010) in cognitively normal individuals. Disruption in resting state functional connectivity magnetic resonance imaging (rs-fcMRI) has been reported in AD (Greicius et al., 2004), and in healthy controls at risk for AD (Sheline et al, 2010a). We explored the relationship among Stroop performance, rs-fcMRI, and CSF Aβ42 levels in cognitively normal older adults.
Methods
A computerized Stroop task (along with standard neuropsychological measures), rs-fcMRI, and CSF were obtained in 237 cognitively normal older adults. We compared the relationship between Stroop performance, including measures from reaction distributional analyses, and composite scores from four resting state networks (RSNs) [default mode (DMN), salience (SAL), dorsal attention (DAN), and sensory motor (SMN)], and the modulatory influence of CSF Aβ42 levels.
Results
A larger Stroop effect in errors was associated with reduced rs-fcMRI within the DMN and SAL. Reaction time distributional analyses indicated the slow tail of the reaction time distribution was related to reduced rs-fcMRI functional connectivity within the SAL. Standard psychometric measures were not related to RSN composite scores. A relationship between Stroop performance and DMN (but not SAL) functional connectivity was stronger in CSF Aβ42 positive individuals.
Conclusions
A link exists between RSN composite scores and specific attentional performance measures. Both measures may be sensitive biomarkers for AD.
Keywords: resting state functional connectivity, Stroop, Alzheimer’s disease
Introduction
Accumulating evidence indicates that pathological changes of Alzheimer’s disease (AD) are present several years prior to the appearance of clinical symptoms (e.g., Price & Morris, 1999; Storandt, Mintun, Head, & Morris, 2009). Early discrimination of AD from healthy aging is important for the development of early therapeutic interventions. Hence, considerable emphasis has been placed on the search for preclinical markers of AD in older individuals who appear to be clinically “normal” but are at increased risk for developing the disease.
Episodic memory loss has long been considered the hallmark symptom of early stage AD (e.g., Albert, Moss, Blacker, Tanzi, & McArdle, 2007; Albert, Moss, Tanzi, & Jones, 2001; Storandt, Grant, Miller, & Morris, 2006). However, there is also clear evidence of deficits in attentional control systems in both healthy aging and early stage AD (for reviews, see Balota & Faust, 2001; Faust & Balota, 2007; Perry & Hodges, 1999). It has been argued that impaired attention may be related to the observed episodic memory changes in these individuals (e.g., Balota, Burgess, Cortese, & Adams, 2002; Balota et al., 1999; Castel, Balota, & McCabe, 2009; Sommers & Huff, 2003).
The classic Stroop color naming task, in which participants are told to name the color of the ink while ignoring the word itself, is the most studied attentional selection (MacLeod, 1992). Evidence suggests that performance in this task changes as a function of both healthy aging and early stage AD. Spieler, Balota, and Faust (1996) reported that cognitively normal older adults showed a relatively large Stroop interference effect in reaction time (RT) (incongruent-neutral), compared to young adults, whereas very mild AD individuals produced a relatively high error rate in the incongruent condition (i.e., intrusion errors), compared to age-matched older controls. We recently reported that intrusion errors in a Stroop Switching Task (Hutchison, Balota, & Duchek, 2010) discriminated age-matched cognitively normal controls from very mild AD individuals above and beyond 18 other standard psychometric tests. Furthermore, in a retrospective analysis of Stroop performance, we observed that Stroop intrusion errors in cognitively normal older adults predicted subsequent conversion to early stage AD over a 12-year period (Balota et al., 2010). Interestingly, psychometric measures of declarative memory did not predict conversion, again suggesting that Stroop intrusion errors may be a particularly sensitive early marker.
In addition to examining RT and error rates in Stroop performance, we have examined, using ex-Gaussian analyses (Spieler et al., 1996), the utility of RT distributional parameters in discriminating healthy aging from early stage AD. The ex-Gaussian distribution is operationally defined by three parameters: mu, sigma, and tau. The mu and sigma parameters reflect the mean and standard deviation, respectively, of the Gaussian component, and the tau parameter reflects any additional exponential contribution to the observed fit of an empirically obtained RT distribution1. Changes in mu and sigma reflect shifting of the RT distribution; whereas a change in tau is more reflective of the tail of the RT distribution (see Balota et al., 2008 for a discussion of this procedure). Tse et al. (2010) recently reported that healthy aging produced changes in mu, sigma, and tau across three attentional selection tasks (Stroop, Simon, and Task-switching), whereas, very mild AD participants primarily had increases in the tau parameter. Furthermore, structural equation modeling indicated that only the tau construct was strongly related to working memory measures (also see Schmiedek et al., 2007). Importantly, Balota et al. (2010) found that only the tau parameter in Stroop reliably predicted subsequent conversion. These results suggest that the tau parameter is a particularly sensitive early marker of AD and may indeed be reflective of a breakdown in attentional control very early in the disease process in cognitively normal individuals.
Blood oxygen level dependent (BOLD) functional magnetic resonance imaging (fMRI) has also been widely used to study the neural correlates of cognitive processes. Many fMRI studies have focused on the effects of healthy aging and AD on changes in the BOLD responses to particular cognitive tasks (e.g., Lustig et al., 2003; Sperling et al., 2009). However, altered task-evoked responses are interpretively ambiguous. Does a change in regional brain function associated with an abnormally performed task reflect dysfunction of that brain region or does it reflect the altered performance of the task? Resting state functional connectivity fMRI (rs-fcMRI) offers a means of assessing the status of functional systems within the brain without the interpretive confound of variable task performance. Numerous rs-fcMRI studies have demonstrated that AD is associated with reduced functional connectivity primarily within the default mode network (DMN) (Greicius et al., 2004; for recent review see Mevel et al., 2011). The DMN was first identified as a constellation of regions that are most active in the absence of goal-directed task performance (Binder, et al., 1999; Greicius, Krasnow, Reiss, & Menon, 2003; Raichle et al., 2001). Because the DMN has good overlap with regions having high amyloid burden as reflected by Pittsburgh compound B (PiB) imaging, dysfunction of the DMN has been implicated in both healthy aging and early-stage AD (e.g., Buckner, Andrews-Hanna, & Schacter, 2008; Andrews-Hanna et al, 2007; Lustig et al., 2003;Vaishnavi et al., 2010). Indeed, disruptions in resting state functional connectivity within the DMN have been reported in cognitively normal adults showing high levels of amyloid deposition with PiB (Hedden et al., 2009; Sheline et al., 2010b; Sperling et al., 2009), apolipoprotein E ε4 (APOE4) status (Sheline et al., 2010a), and family history for AD (Wang et al., 2012a).
Stroop performance has also been linked to specific neural correlates in MRI studies using functional tasks. One area that has been implicated across several studies is the anterior cingulate cortex (ACC) (see Nee, Wager, & Jonides, 2007 for a meta-analysis; Pardo et al., 1990). More specifically, it has been suggested that the ACC is critical for the monitoring and resolution of conflict during response selection (Braver, Barch, Gray, Molfese, & Snyder, 2001; Botvinick et al., 2001; Nee et al.). Thus, the status of the salience network, which includes the ACC (Seeley et al., 2007) may be particularly related to behavioral measures such as Stroop errors and Stroop tau. A breakdown in attentional control systems could be predictive, as discussed earlier, of subsequent progression to AD.
The primary goal of the present study was to explore the relationship between Stroop performance and rs-fcMRI in four distinct resting state networks (RSNs): the DMN, salience (SAL), dorsal attention (DAN) and sensory-motor (SMN), within a sample of cognitively normal older adults. Because the DMN has been linked to amyloid burden (Sheline et al., 2010b), APOE status (Sheline et al., 2010a) and a family history of AD (Wang et al., 2012a) in healthy controls and because specific measures of Stroop task performance (i.e., intrusion errors and the slow tail of the reaction time distributional analyses, i.e., Stroop tau) are predictive of early stage AD in healthy controls, we targeted the relationship between the DMN functional integrity and these specific measures of Stroop task performance in a large sample of cognitively normal older adults. We also examined whether Stroop intrusion errors and Stroop tau were related to rs-fcMRI in the SAL given that this network includes the ACC. The DAN and SMN were included as reference networks to test the specificity of these relationships.
In addition to investigating the relation among Stroop performance measures and rs-fcMRI, we also investigated the potential modulatory role of well-established cerebrospinal fluid (CSF) biomarkers for Alzheimer’s disease, including amyloid beta (Aβ42), ptau181, and total tau (t-tau (e.g., Fagan et al., 2007). In this regard, it is noteworthy that Wang et al. (2012b) found that decreased CSF Aβ42 and increased CSF ptau181 (but not increased CSF t-tau) were associated specifically with reduced DMN functional connectivity in a sample of cognitively normal controls. The present analyses will address whether there are any cognitive consequences of the relationship reported in Wang et al. in a group of nondemented healthy older adults.
Methods
Participants
A total of 237 healthy controls participated in this study (mean age = 67.59 years old, SD= 9.07; mean education = 15.64 years, SD = 3.23; gender = 89 males/148 females). Participants were recruited from the Charles and Joanne F. Knight Alzheimer’s Disease Research Center (ADRC) at Washington University in St. Louis (WUSTL). This study was approved by the Institutional Review Board at WUSTL; all participants provided informed consent at the beginning of the study. All participants were originally screened for depression, untreated hypertension, reversible dementias, and other disorders that are potential causes of cognitive impairment. The inclusionary and exclusionary criteria for AD were consistent with the NINCDS-ADRDA criteria (McKhann, Drachman, Folstein, Katzman, Price, & Stadlan, 1984). Importantly, all participants were screened for dementia using the Clinical Dementia Rating (CDR) scale (Morris, 1993), and all were at the CDR 0 level, which indicates no clinical dementia. The CDR is based on a 90-min interview that assesses both the participant and also relies on information from a collateral source (CS) concerning the participant. Both the reliability of the CDR (Burke et al., 1988) and the validation of the diagnosis (based upon autopsy) have previously been shown to be excellent (93% diagnostic accuracy) (Berg et al., 1998).
Psychometric Testing
Each participant was administered a standard neuropsychological battery in a separate testing session, by an examiner who was unaware of the participant’s CDR score. Memory was assessed with Logical Memory (recall of scoring units 0-23), Forward and Backward Digit Span (number of correct digits, 0-8 or 0-7, respectively), and Associate Memory (number correct 0-21) from the Wechsler Memory Scale (Wechsler & Stone, 1973) and the Selective Reminding Test (SRT) (number correct, range 0-48) (Grober, Buschke, Crystal, Bang, & Dresner, 1988). General intelligence was assessed with Information (scoring range 0-29), Block Design (scoring range 0-48), and Digit Symbol (scoring range 0-90) subtests of the Wechsler Adult Intelligence Scale (WAIS) and were scored according to the manual (Wechsler, 1955). Visual perceptual-motor performance was assessed with Parts A and B of the Trail Making Test (number of seconds to complete) (Armitage, 1946). The Word Fluency Test S-P (Thurstone & Thurstone, 1949), and the Animal Naming Test (number named in 1 min.) (Goodglass & Kaplan, 1983) were administered as tests of semantic/lexical retrieval.
Stroop Task
A computerized version of the Stroop task was administered on a Pentium II IBM computer (Armonk, NY) which controlled the display of the stimuli and recorded subject responses. A Gerbrands Model voice-operated relay was interfaced with the computer to measure voice onset latency in the Stroop task.
The word stimuli consisted of four color words (red, blue, green, yellow) and four neutral words (bad, poor, deep, legal). The neutral words were chosen to match the color words in phoneme onset and frequency. The task included a block of word naming trials and a block of color naming trials. There were 104 trials in each block (36 congruent, 36 incongruent, and 32 neutral). In the congruent condition, each color word appeared nine times. In the incongruent condition, each color word appeared three times in each of the different colors (e.g., blue appeared in red, green, or yellow three times). In the neutral condition, each word appeared twice in each of the four colors. The order of trials was randomized in each block with the restriction that a particular color or word was not presented more than twice in consecutive trials. The order of blocks (word or color) was counterbalanced across participants.
Participants were given 16 practice trials before each block. Before word naming trials, participants were instructed to read the words as quickly and accurately as possible. Before color naming trials, participants were instructed to name the color in which the word appeared as quickly and accurately as possible. At the beginning of each trial, a fixation point appeared for 500 ms followed by a blank screen for 50 ms. The stimulus word then appeared on the screen for 5 seconds or until the subject responded. The Experimenter recorded the response as correct, incorrect, or a voice key error (e.g., stutters, false starts, or any noise that triggered the voice key) by pressing one of three keys on the computer. Subjects were given breaks between trial blocks.
Neuroimaging data acquisition
Imaging was performed at a different session as previously described (Brier et al., 2012) using a 3T Siemens scanner (Erlangen, Germany) equipped with a standard 12-channel head coil. In brief, a high-resolution structural scan was acquired using a 3-dimensional sagittal T1-weighted magnetization-prepared rapid gradient echo (MPRAGE; echo time [TE] = 16 msec, repetition time [TR] = 2,400 msec, inversion time [TI] = 1,000 msec, flip angle = 8°, 256 × 256 acquisition matrix, 1 × 1 × 1 mm voxels). High-resolution 2-D multi-slice oblique axial spin density/T2-weighted (T2W) fast spin echo (FSE) structural images were also acquired using slice tilts and positions computed by slice preregistration (TE = 455 msec, TR = 3,200 msec, 256 × 256 acquisition matrix, 1 acquisition, 1 × 1 × 1 mm voxels). All rs-fcMRI scans were collected using a blipped 2D echo planar imaging sequence (TE = 27 msec, TR = 2200 msec, field of view = 256 mm, flip angle = 90°, 4 mm isotropic voxels) sensitive to BOLD contrast (T2* weighting).
Complete brain coverage was obtained using 36 contiguous slices acquired parallel to the anterior commissure/posterior commissure plane. Two six minute rs-fcMRI runs (164 volumes each) were acquired during which participants were instructed to fixate have eyes open and not fall asleep.
Preprocessing of rs-fcMRI
The fMRI data were preprocessed using conventional methods as previously described (Brier et al., 2012; Drzezga et al., 2011; Shulman et al., 2010). Briefly, this included compensation for slice-dependent time shifts, elimination of systematic odd-even slice intensity differences due to interleaved acquisition and rigid body correction for head movement within and across runs. rs-fcMRI data were intensity scaled (one multiplicative factor applied to all voxels of all frames within each run) to obtain a mode value of 1000 (Ojemann et al., 1997). This scaling facilitated assessment of voxel-wise variance for purposes of quality assurance but did not affect computed correlations. Both the MPRAGE and T2W FSE scans were used to enable rs-fcMRI spatial normalization to a previously-defined atlas derived from structural scans of older adults (Brier et al., 2012; Shulman et al., 2010). For each subject, rs-fcMRI runs were registered to the T2W scan, the T2W scan was registered to the high-resolution structural MPRAGE, and the MPRAGE was registered to the atlas. Each registration resulted in separate linear affine transformation matrices which were combined to yield one matrix representing the complete transformation of rs-fcMRI space to atlas space. Head movement correction and atlas transformation were subsequently applied to native-space rs-fcMRI runs in a single resampling that generated a volumetric time-series in 3mm3 atlas space.
Additional preprocessing in preparation of correlation mapping included (i) spatial smoothing (6 mm full width half maximum Gaussian blur in each direction), (ii) voxel-wise removal of linear trends over each run, (iii) temporal low-pass filtering that retained frequencies below 0.1 Hz and (iv) reduction of spurious variance by regression of nuisance waveforms derived from head motion correction (x, y, z displacement and first derivatives of each) and from regions (of “non-interest”) in white matter and cerebral spinal fluid (CSF). This regression step included the time-series averaged over the whole brain (Buckner et al., 2005; Fox et al., 2009).
Quality assurance (QA)
Care was taken to minimize head motion both at the individual and at the group levels. QA measures included root mean square (rms) head displacement (in mm) derived from the motion correction procedure and the voxel-wise time-series standard deviation (sd) averaged over the whole brain (de Calignon et al., 2012; Van Dijk et al., 2012). Individuals (n=10) with a mean preprocessed rs-fcMRI signal sd > 2.5% (after nuisance regression) or rms movement > 1.25 mm were excluded (Brier et al., 2012). In addition, frame censoring (“scrubbing”) excluded those rs-fcMRI computations frames (volumes) in which the preprocessed frame-to-frame rms intensity change exceeded 0.5% (Smyser et al., 2010; Power et al., 2012; Van Dijk et al., 2012).
Selection of Regions of Interest (ROIs)
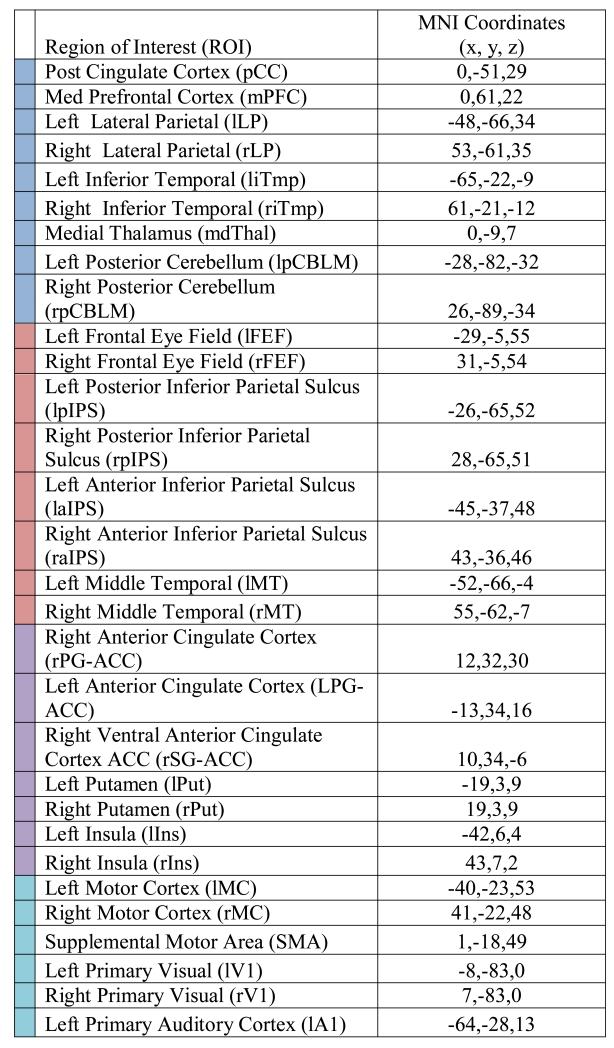
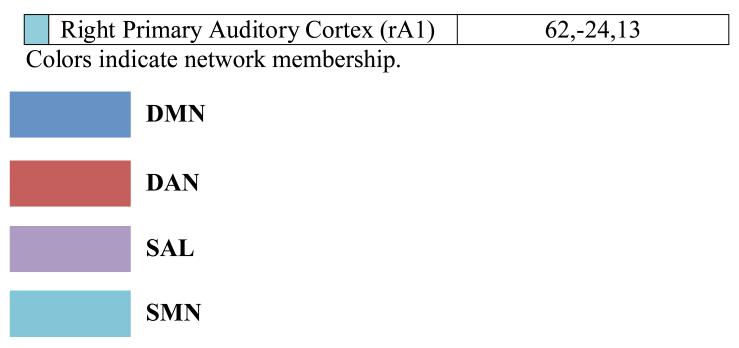
As previously described (Brier et al. 2012), 31 spherical (6 mm radius) regions of interest (ROIs) representing 4 RSNs were utilized (Table 1). These ROIs were derived by maximizing the topographic concordance between seed-based and spatial ICA analyses (Beckmann et al., 2005) from a dataset consisting of 17 healthy young adults (Fox & Raichle, 2007).
Table 1. Regions and MNI (Montreal Neurological Institute) Coordinates for Regions of Interest (ROIs).
|
Rs-fcMRI Post -Processing Procedures
Correlation maps were produced by extracting the time course from each of the 31 ROIs and computing the Pearson correlation coefficient (r) between the seed and all other brain voxels. Statistical tests of rs-fcMRI results were computed after application of Fisher’s z transform (z = 0.5ln[(1+r)/(1-r)]). Significance maps were computed by a random effects analysis of the Fisher z-transformed correlation maps (voxel-wise p<0.05).
Computation of RSN Composite Score
To assess relationships between behavioral measures and rs-fcMRI data while avoiding sampling error at the level of node pairs, we computed individual subject composite scores for the 4 RSNs (Brier et al.,2012). For example, the composite DMN score for subject k was computed as , where i and j refer to a ROI pair and zijk represents the Fisher z-transformed correlation between regions i and j in subject k. Similarly, cXk was computed as the average correlation within network X in subject k. This approach to statistical inference achieves data reduction and reduces the impact of sampling error across node pairs (Brier et al., 2012).
CSF Biomarkers
CSF biomarkers (Aβ42, t-tau, ptau181) were available for 189 healthy older adults. CSF samples were analyzed for Aβ42, t-tau, and ptau181 by plate-based enzyme- linked immunosorbent assay (Innotest; Innogenetics, Ghent, Belgium) according to the manufacturer’s instructions. The Innotest reagents included monoclonal capture/detection antibodies 21F12/3D6 for Aβ42 and AT120/HT7 and BT2 for t- and p-tau181 (Fagan et al., 2007).
Results
A series of Pearson product moment correlations were computed to examine relationships among composite scores from the DMN, SAL, DAN, and SMN and the targeted measures from the color naming trials of the Stroop task. Based on the extant literature reviewed above, the predicted a priori relationships between the DMN and SAL composite scores and Stroop effect errors and Stroop tau were tested. In addition, the relationships between DAN and SMN and the other measures of Stroop performance (Stroop effect RT, Stroop mu, Stroop sigma) were included as reference measures to test the specificity of these predicted relationships. In all of the following computed correlations, we controlled for age, education, gender, date of scan, and motion correction (rms of head displacement)2.
The mean Stroop effect in RT (Incongruent RT – Neutral RT) and the mean Stroop effect in errors (Incongruent errors – Neutral errors) were computed for each participant. Stroop errors only included those trials on which there was an intrusion error (i.e., an incorrect response) and did not include trials on which there were stutters, false starts, or any noise that triggered the voice key. In calculating RTs, we removed trials with incorrect responses, RTs shorter than 200 ms, or RTs that were 3 standard deviation units above or below each participant’s mean response latency. In addition, we obtained ex-Gaussian parameters (mu, sigma, tau) for each participant across all Stroop conditions using a quantile maximum likelihood estimation procedure in the quantile maximum probability estimator program (QMPE 2.18) (Cousineau, Brown, & Heathcote, 2004; Heathcote, Brown, & Mewhort, 2002). This procedure provides unbiased parameter estimates and has been shown to be more effective than continuous maximum likelihood estimation for small samples (Heathcote & Brown, 2004; Speckman & Rouder, 2004). All fits successfully converged within 500 iterations. The descriptive statistics for the Stroop measures are presented in Table 2.
Table 2. Means and Standard Deviations (SD) for Stroop Tests.
| Mean | SD | N | |
|---|---|---|---|
| Stroop effect RT | 108.43 | 75.85 | 237 |
| Stroop effect Errors | 1.67 | 2.58 | 237 |
| Stroop Mu | 690.10 | 126.72 | 237 |
| Stroop Sigma | 133.71 | 53.92 | 237 |
| Stroop Tau | 122.99 | 78.66 | 237 |
Stroop Performance and SAL, DMN, DAN, SMN networks
Table 3 presents the correlations between the SAL, DMN, DAN, SMN networks and measures of Stroop performance. As can see seen in Table 3, there were no significant relationships between any of the Stroop measures and the DAN and SMN networks (all p’s >.11). However, there were significant relationships between the SAL and DMN and Stroop performance. Most notably, as predicted, there were reliable negative correlations between the Stroop effect in errors and functional connectivity within the SAL and DMN (p’s < .006). In addition, there was a reliable negative correlation between overall Stroop tau and the SAL (p =.005). Scatterplots for reliable correlations are presented in Figure 1. These correlations remained significant when potential outliers were removed3.
Table 3. Relationship between Stroop performance measures and functional connectivity in the SAL, DMN, DAN, SMN.
| SAL | DMN | DAN | SMN | ||
|---|---|---|---|---|---|
| Stroop effect RT | Correlation | −.081 | −.011 | −.103 | .036 |
|
Significance
(2-tailed) |
.218 | .869 | .119 | .589 | |
|
Stroop effect
Errors |
Correlation | −.231 | −.181 | −.005 | −.004 |
|
Significance
(2-tailed) |
.000 | .006 | .939 | .958 | |
| Stroop Mu | Correlation | −.020 | .001 | −.013 | −.018 |
|
Significance
(2-tailed) |
.761 | .990 | .842 | .789 | |
| Stroop Sigma | Correlation | .071 | .011 | −.013 | −.032 |
|
Significance
(2-tailed) |
.281 | .868 | .841 | .630 | |
| Stroop Tau | Correlation | −.185 | −.087 | −.100 | .027 |
|
Significance
(2-tailed) |
.005 | .185 | .129 | .682 |
Figure 1.

Scatterplots of standardized residuals for Stroop errors and SAL and DMN (top row) and Stroop tau and SAL (bottom row) with potential outliers circled.
To further explore the relationship between Stroop errors and Stroop tau in the SAL and DMN, we divided participants by Stroop errors and Stroop tau scores into tertiles of 75 subjects each and constructed whole-brain rs-fcMRI images using seeds in the posterior cingulate cortex (pCC) (a DMN region) and ACC (a SAL region). Average pCC and ACC rs-fcMRI maps are shown for the top-third performers and bottom-third performers of Stroop effect error groups (left columns of Figure 2A and Figure 2B) and for the top-third and bottom-third performing Stroop tau groups (left columns Figure 3A and Figure 3B). Difference maps displaying the voxelwise Z-scores (Gaussianized t-statistic reflecting the group difference in Fisher z-transformed correlation) for the contrast between top-third and bottom-third groups for each Stroop measure for the two networks are also shown in the right columns of each panel of these figures (not corrected for multiple comparisons).
Figure 2.

Group average seed based correlation maps for ACC (A) and pCC (B) seed regions representing the top-third and bottom third performers as ranked by Stroop effect error. Voxelwise Top vs. Bottom contrast maps (Gaussianized t-statistic reflecting the group difference in Fisher z-transformed correlation, not corrected for multiple comparisons) are shown in the right column.
Figure 3.

Group average seed based correlation maps for ACC (A) and pCC (B) seed regions representing the top-third and bottom third performers ranked by Stroop tau. Voxelwise Top vs. Bottom contrast maps (Gaussianized t-statistic reflecting the group difference in Fisher z-transformed correlation, not corrected for multiple comparisons) are shown in the right column.
This analysis shows that positive within-SAL functional connectivity between the ACC and caudate (another SAL region marked by green circles) is lost for both the poor performing Stroop errors group (Figure 2A) and the group that produces the larger Stroop tau effect (Figure 3A). Positive functional connectivity between the ACC and superior frontal (purple circle) is also lost in the group that produces the larger Stroop tau effect. Positive functional connectivity between the pCC and medial prefrontal (another DMN region, marked by blue circle) is lower in the poor Stroop errors group (Figure 2B) and the group that produces the larger Stroop tau effect (Figure 3B).
Significant differences in functional connectivity composite scores for the SAL were present between the top-third and bottom-third Stroop error groups after controlling for age, education, gender, date of scan, and motion, F(1,167) = 7.81, p=.006, η2p = .05. A similar analysis was performed comparing the top-third and bottom-third groups for the Stroop tau effect. Again, significant differences in SAL functional connectivity were present between the top-third and bottom-third groups after controlling for age, education, gender, date of scan, and motion, F(1,151) = 10.04, p=.002, η2p = .062.
Psychometric Performance and Brain Networks
To further examine the specificity of these relationships in relation to the Stroop task, we also examined the correlations between standard psychometric task performance and DMN, SAL, DAN, and SMN composite scores. Descriptive statistics for the psychometric measures are presented in Table 4 and the correlations of the psychometric measures with the SAL, DMN, DAN, and SMN are presented in Table 5. There were no significant correlations between any of these RSNs and the psychometric measures (Table 5).
Table 4. Means and Standard Deviations (SD) for Psychometric Tests.
| Mean | SD | N | |
|---|---|---|---|
| Information | 21.37 | 4.33 | 158 |
| Block design | 31.96 | 8.32 | 157 |
| Animals | 21.23 | 5.65 | 216 |
| Word fluency | 29.67 | 9.81 | 159 |
| Associate memory | 13.78 | 3.53 | 159 |
| Digits forward | 6.62 | 1.11 | 159 |
| Digits backward | 4.69 | 1.12 | 159 |
| Digit symbol | 48.93 | 10.83 | 158 |
| Trailmaking A | 31.42 | 11.24 | 216 |
| Trailmaking B | 84.70 | 32.39 | 159 |
| Trails B correct | 23.89 | 1.51 | 175 |
| Logical memory | 13.47 | 3.54 | 154 |
| Memory Units * | 12.55 | 3.98 | 154 |
|
Selective
Reminding |
30.55 | 6.08 | 215 |
Memory Units = Logical memory - Delayed
Table 5. Psychometric Correlations with SAL, DMN, DAN, SMN.
| SAL | DMN | DAN | SMN | ||
|---|---|---|---|---|---|
| Information | Correlation | .013 | .001 | −.059 | .016 |
| n=156 | Significance | .872 | .988 | .472 | .846 |
| Blk design | Correlation | .074 | .053 | −.034 | .041 |
| n=155 | Significance | .363 | .518 | .680 | .615 |
| Animals | Correlation | .032 | .004 | −.071 | −.110 |
| n=217 | Significance | .645 | .954 | .307 | .113 |
|
Word
fluency |
Correlation | .127 | .062 | −.033 | −.090 |
| n=157 | Significance | .115 | .445 | .683 | .267 |
|
Associate
memory |
Correlation | .069 | −.030 | −.021 | .087 |
| n=157 | Significance | .395 | .715 | .793 | .285 |
|
Digits
forward |
Correlation | −.062 | −.114 | .067 | −.052 |
| n=157 | Significance | .443 | .160 | .407 | .524 |
|
Digits
backward |
Correlation | −.025 | −.078 | −.031 | −.031 |
| n=157 | Significance | .763 | .338 | .706 | .699 |
|
Digit
symbol |
Correlation | .119 | .057 | .055 | −.043 |
| n=156 | Significance | .142 | .486 | .503 | .680 |
|
Trailmaking
A |
Correlation | −.128 | .040 | .066 | .090 |
| n=217 | Significance | .063 | .560 | .338 | .155 |
|
Trailmaking
B |
Correlation | −.065 | −.092 | .102 | −.031 |
| n=157 | Significance | .421 | .257 | .208 | .706 |
|
Trailmaking
B correct |
Correlation | −.001 | −.024 | .020 | .072 |
| n=157 | Significance | .985 | .758 | .800 | .348 |
|
Logical
memory |
Correlation | .072 | −.053 | −.068 | −.027 |
| n=152 | Significance | .383 | .517 | .407 | .740 |
|
Memory
units |
Correlation | .062 | −.037 | −.084 | −.013 |
| n=152 | Significance | .452 | .655 | .309 | .876 |
|
Selective
Reminding |
Correlation | .105 | .112 | −.072 | −.022 |
| n=216 | Significance | .129 | .449 | .300 | .747 |
CSF Biomarkers, Stroop Performance, and Brain Networks
To further explore the link between attentional task performance, brain network functional connectivity, and risk for AD, we examined the association between CSF Aβ42, a well-established biomarker of amyloid pathology in AD (e.g., see Fagan et al, 2006), Stroop errors, Stroop tau and DMN and SAL functional connectivity. Participants were classified as CSF Aβ42 negative (>500 pg/ml; n=129) or positive (<500 pg/ml; n=60) based on previously published cutoffs (Morris et al., 2010). The results indicated that the correlation between Stroop errors and DMN connectivity was stronger for the CSF Aβ42 positive individuals (r = −.42, p=.001) than the Aβ42 negative individuals (r = −.11, p=.24). Likewise for Stroop tau, the correlation with DMN connectivity was stronger for the CSF Aβ42 positive individuals (r = −.36, p=.007) than the Aβ42 negative individuals (r = −.01, p=.94) (see Figure 4). Interestingly, these relationships were not observed for the SAL. Specifically, CSF Aβ42 status did not differentially influence the correlations between Stroop errors and SAL functional connectivity (CSF Aβ42 positive, r = −.17, p=.22; CSF Aβ42 negative, r = −.19, p=.04) or the correlations between Stroop tau and SAL functional connectivity (CSF Aβ42 positive, r = −.163, p=.24; CSF Aβ42 negative, r = −.158, p=.08). This pattern was not observed for CSF ptau181 (> 80 pg/ml) or CSF tau positive subjects (> 500 pg/ml), however, because the number of subjects was relatively small in this sample (n=26 and n=17, respectively), caution should be exercised interpreting the lack of an influence. Similar analyses with CSF Aβ42 were conducted for the psychometric measures. None of the correlations with DMN or SAL reached statistical significance, suggesting that CSF Aβ42 status did not modulate the relationships between DMN or SAL connectivity and psychometric test performance.
Figure 4.

Scatterplots of standardized residuals for cerebrospinal (CSF) Aβ42 positive (<500 ng/ml) and CSFAβ42 negative (<]>500 ng/ml) participants for Stroop errors and DMN (top row) and Stroop tau and DMN (bottom row).
Discussion
The purpose of the present study was to examine the relationship between Stroop performance and rs-fcMRI in cognitively normal older adults. This investigation was motivated by two lines of research related to potential preclinical markers for the onset of AD. First, regarding behavioral markers, there is evidence that Stroop performance, namely intrusion errors (Hutchison et al., 2010) and Stroop tau (Tse et al., 2010), discriminate healthy aging from very mild AD. Importantly, these two measures also predict conversion to AD in a longitudinal study of healthy controls (Balota et al., 2010). Second, regarding biomarkers, there is evidence that DMN functional connectivity is disrupted in AD (e.g., Buckner, Andrews-Hanna, & Schacter, 2008; Greicius et al., 2004; Lustig et al., 2003) and in cognitively normal individuals who are at increased risk for subsequently developing AD based on amyloid deposition (Sheline et al., 2010b; Sperling et al., 2009), APOE status (Sheline et al., 2010a), and family history (Wang et al., 2012a). Therefore, we explored the relationship between various targeted measures of Stroop performance and resting state functional connectivity within 4 RSNs: (1) DMN based on the above-mentioned findings, (2) SAL network based on the relationship between conflict resolution, as reflected in the Stroop task, in particular the ACC (Nee et al., 2007), and (3) DAN and SMN as reference networks to examine the specificity of these brain-behavior relationships.
As predicted, in a sample of well-characterized cognitively normal older adults, the Stroop effect in errors (incongruent – neutral errors) was indeed reliably related to both DMN and SAL functional connectivity. A larger Stroop effect in errors was associated with reduced functional connectivity in the two targeted RSNs. Likewise, Stroop tau was related to SAL functional connectivity, indicating an increased tail in the RT distribution was associated with reductions in network connectivity. Moreover, functional connectivity in the DAN and SMN was not related to any of the Stroop measures. Most importantly, the specificity of the Stroop relationships with the SAL and DMN was demonstrated in that none of the 14 psychometric measures were reliably associated with rs-fcMRI in any of the four RSNs. In this light, it is also noteworthy that in a Stroop fMRI experiment conducted in cognitively normal young adults, it was observed that high pre-stimulus BOLD signal in the dorsal ACC (a component of the SAL) preceded faster responses; conversely high pre-stimulus BOLD signal in the DMN preceded slower responses (Coste et al., 2011). Of course, further work will be needed to fully understand how these task-based results relate to the present resting state findings. However, it is noteworthy that the principal effects reported by Coste et al. localized to the same RSNs that constitute the present focus.
Our results are consistent with previous findings indicating that specific measures of Stroop task performance, namely Stroop intrusion errors and the Stroop tau parameter derived from ex-Gaussian analyses, may be particularly sensitive markers of cognitive changes in healthy aging and very mild AD (Balota et al., 2010; Hutchison et al., 2010; Tse et al., 2010). It has been argued that these measures are indeed reflective of a breakdown in attentional control systems (Balota & Faust, 2001; Faust & Balota, 2007; Perry & Hodges, 1999). The attentional control system needs to maintain the goals of a task and control competing pathways (e.g., Kane & Engle, 2003; Shallice & Burgess, 1996). In the case of the Stroop task, one has to maintain the task set (i.e., name the color) and control highly activated, but inappropriate pathways (i.e., inhibit the word code). The inability to stay tuned to the demands of the task and control prepotent pathways will result in intrusion errors (i.e., saying the word instead of the color) and/or slow response times (i.e., an increase in the tail of the RT distribution)4. Indeed, a breakdown in such attentional control systems may serve as an early behavioral marker for the onset of AD. As a cautionary note, we are not suggesting that Stroop performance per se is a marker for AD onset; rather measures that place high demands on attentional control (such as the present computerized Stroop task) may be as clinically useful in identifying cognitive decline as traditional neuropsychological measures that tap declarative memory.
In this light, the relationship between the functional connectivity of specific RSNs and specific measures of Stroop performance in a sample of well-characterized cognitively normal older adults is intriguing. In particular, our results suggest that the integrity of specific RSNs (DMN and SAL) may reflect attentional breakdowns in behavioral tasks. Again, it is important to note that none of the psychometric measures, including the declarative memory measures, were associated with altered functional connectivity in these networks5. In a similar vein, Kelly et al. (2008) have reported that the strength of the anti-correlations between the DMN and the DAN decreases with increased behavioral variability in an attention-demanding task in young adults. They further argue that the strength of these cross network anti-correlations mediate fluctuations in attentional performance. In addition, there is evidence that increased individual task variability discriminates healthy aging from early stage AD (e.g., Christensen et al., 2005; Dixon et al., 2007; Duchek et al., 2009). Furthermore, Duchek et al. have reported that increased variability in the Stroop task discriminated the performance of APOE ε4 carriers from noncarriers in cognitively normal older adults and increased variability in a switching task was related to CSF biomarkers in cognitively normal older adults. Thus, increased behavioral variability appears to be predictive of very mild AD and is also related to rs-fcMRI. It is noteworthy that increases in Stroop tau are strongly related to intra-individual standard deviations. Hence, it may be that simple variability per se is not the critical marker but increased variability due to an increase in the slow tail of the RT distribution, which has been shown to be a sensitive correlate of attentional control measures (see Balota & Yap, 2011, for further discussion).
We also explored the link between a well-established biomarker for AD, CSF Aβ42, and Stroop performance and rs-fcMRI. Interestingly, we found that the relationship between both Stroop errors and Stroop tau and reduced DMN integrity was strongest for the CSF Aβ42 positive group. In contrast to the DMN relationship, CSF Aβ42 status did not influence the relationship between Stroop performance and the SAL network functional connectivity. Thus, further exploration of the SAL network is clearly warranted in this population. However, these results are consistent with prior reports of reduced functional connectivity within the DMN in cognitively normal individuals at risk for AD (Sheline et al., 2010a; 2010b; Wang et al., 2012a). Thus, the relationship between attentional performance and DMN integrity may be a sensitive brain-behavioral marker for the onset of AD.
Several limitations of the current study should be mentioned. First, significant challenges exist in performing rs-fcMRI studies in older adults as this technique is particularly sensitive to even small amounts of head motion. We have attempted to correct for head movement using recently developed frame-censoring algorithms and by adding the rms of movement as a covariate in analyses, to control for group differences in the prevalence of head motion. Second, we chose the composite-score analysis method to limit the impact of multiple-comparisons in this study. Voxel-wise analysis did suggest that future studies employing restricted ROI-ROI pair-wise correlation analysis may be able to capture more specific changes in network correlations. Third, while disease-related alterations in brain structure may make it difficult to interpret the source of abnormalities in rs-fcMRI (i.e., decreases in functional connectivity may reflect atrophy in addition to primary functional changes), these issues should be minimized in our study because all individuals were cognitively normal (i.e., CDR=0). However, it should also be noted that the predicted specificity of the Stroop measures (intrusion rate and Stroop tau) across a battery of psychometric measures minimizes the plausibility of the above two alternative accounts of the present results. Finally, a common criticism of rs-fcMRI is that the information obtained is primarily correlational in nature. Clearly, further work is needed to test a causal link. In this light, the present study is only the first step in providing a link between targeted behavioral measures (Stroop errors and Stroop tau) and targeted RSNs in a group of non-demented older adults. Longitudinal study of these individuals will be critical in further testing this hypothesis.
Conclusions
The present results provide evidence that signature alterations in Stroop task performance in healthy controls that have been shown to be related to AD onset (i.e., intrusion errors and Stroop tau) are mirrored by specific changes in rs-fcMRI. Interestingly, these changes are modulated by the presence of CSF Aβ42 for AD. Decreased functional connectivity within the DMN and SAL may reflect decreased activity in these regions which may contribute to observed attentional breakdowns in task performance. A disruption in rs-fcMRI has been observed within DMN nodes of AD patients (Greicius et al., 2003), and in healthy control individuals at risk for developing AD (Sheline et al.; 2010b, 2010; Wang et al., 2012a). Compromised integrity of these functional brain networks in healthy aging may reflect a disruption of attentional control systems that are predictive of the subsequent onset of AD. Longitudinal analyses will be important in establishing this relationship.
Acknowledgments
Funding support came from the Cognitive, Computational and Systems Neuroscience Pathway (PR, JT), National Institute of Mental Health (NIMH) (K23MH081786) (BMA) P30NS048056 (AZS), National Institute of Nursing Research (NINR) (R01NR012907 and R01NR012657) (BMA), National Institute of Aging (NIA) (P01AG026276, P01AG03991 and P50 AG05681) (JCM), and National Institute of Neurological Disorders and Stroke (NINDS) (NS06833) (AZS), Alzheimer’s Association (BMA).
Financial Support: We thank the Clinical Core of the Knight Alzheimer’s Disease Research Center at Washington University for the clinical assessments.
Footnotes
It is crucial to avoid confusing tau protein, a molecular marker of AD neuropathology with parametric descriptions of RT distributions. Hence, in references to the latter we consistently use “Stroop tau.”
We did not correct for multiple comparisons when examining the Stroop performance and rs-fcMRI correlations because these relationships were predicted a priori based on the extant literature: (1) the sensitivity of Stroop errors and Stroop tau in discriminating healthy aging from early stage DAT (Hutchison et al., 2010; Tse et al., 2010) and predicting conversion to AD (Balota et al., 2010). In addition, disrupted DMN functional connectivity is well documented in AD (Greicius et al., 2004; Mevel et al., 2011) and in cognitively normal individuals who are at increased risk for developing AD (Sheline et al., 2010a; 2010b; Sperling et al., 2009); (2) Conflict resolution, as reflected in the Stroop task, is strongly linked to the ACC (Braver et al., 2001; Botvinick et al., 2001; Nee et al., 2007; Pardo et al., 1990), which is part of the SAL network (Seeley et al., 2007). Furthermore, all of these targeted correlations were highly reliable, all p’s < .007. It should also be noted that Figures 2 and 3 show group average seed based correlation maps and contrasts based on Stroop performance. We highlight loci that show group differences but we do not draw statistical inferences based on these images.
It appears that there might be an outlier for Stroop errors (circled on Figure 1), however when this outlier is removed, the correlation between Stroop errors and SAL remains significant (r = − .21, p=.001) and the reliable correlation between Stroop errors and DMN increases slightly (r = − .21, p=.001). Likewise, when the two potential outliers for Stroop tau (circled on Figure 1) are removed, the correlation between Stroop tau and SAL does not change (r = −.188, p = .004).
It is important to note that the Stroop tau parameter in the present study was collapsed across conditions (i.e., congruent, neutral, incongruent) because there are too few trials to obtain a stable estimate for each condition. Thus, one might question whether this overall tau is indeed a reflection of attentional control. However, there is evidence that the slow tail of the RT distribution as reflected by the tau parameter can affect attentional control, even in the congruent condition of the Stoop task (see Spieler, Balota, & Faust, 2000). Furthermore, the tau parameter in the present study is computed in the same manner as in the Tse et al. (2010) study wherein they reported that the tau construct across conditions in three attentional selection tasks was highly related to working memory measures, via the use of structural equation modeling. Thus, the overall tau estimate across conditions does appear to be related to attentional control measures.
One might be concerned that only the Stroop measures (errors and tau) were correlated with the DMN and SAL and not the psychometric measures because the measurement of RT and errors in Stroop yield more precise and sensitive measures. However, we have found that test-retest reliability for computerized Stroop performance is actually lower (intrusion rates = .47) or similar to (overall Mean RT = .71) the reliability estimates for psychometric measures of declarative memory (e.g., Logical Memory = .69; SRT = .70).
References
- Albert M, Moss MB, Tanzi R, Jones K. Preclinical prediction of AD using neuropsychological tests. Journal of the International Neuropsychological Society. 2001;7:631–639. doi: 10.1017/s1355617701755105. [DOI] [PubMed] [Google Scholar]
- Albert M, Moss MB, Blacker D, Tanzi R, McArdle JJ. Longitudinal change in cognitive performance among individuals with mild cognitive impairment. Neuropsychology. 2007;21:158–169. doi: 10.1037/0894-4105.21.2.158. [DOI] [PubMed] [Google Scholar]
- Andrews-Hanna JR, Snyder AZ, Vincent JL, Lustig C, Head D, Raichle ME, Buckner RL. Disruption of large-scale brain systems in advanced aging. Neuron. 2007;56(5):924–35. doi: 10.1016/j.neuron.2007.10.038. [DOI] [PMC free article] [PubMed] [Google Scholar]
- Armitage SG. An analysis of certain psychological tests used for the evaluation of brain injury. Psychological Monographs. 1945;60(1):1–48. Whole No. 177. [Google Scholar]
- Balota DA, Burgess GC, Cortese MJ, Adams DR. The word-frequency mirror effect in young, old, and early-stage Alzheimer’s disease: Evidence for two processes in episodic recognition performance. Journal of Memory & Language. 2002;46(1):199–226. [Google Scholar]
- Balota DA, Cortese MJ, Duchek JM, Adams D, Roediger HL, McDermott KB, Yerys BE. Veridical and false memory in healthy older adults and in Dementia of the Alzheimer’s Type. Cognitive Neuropsychology. 1999;16:361–384. [Google Scholar]
- Balota DA, Faust ME. Attention in dementia of the Alzheimer’s type. In: Boller F, Cappa S, editors. The Handbook of Neuropsychology. 2nd Ed. Elsevier Science; New York: 2001. pp. 51–80. [Google Scholar]
- Balota DA, Tse CS, Hutchison KA, Spieler DH, Duchek JM, Morris JC. Predicting conversion to dementia of the Alzheimer’s type in a healthy control sample: the power of errors in Stroop color naming. Psychol Aging. 2010;25(1):208–218. doi: 10.1037/a0017474. [DOI] [PMC free article] [PubMed] [Google Scholar]
- Balota DA, Yap MJ. Moving beyond the mean in studies of mental chronometry: The power of response time distributional analyses. Current Directions in Psychological Science. 2011;20:160–166. [Google Scholar]
- Balota DA, Yap MJ, Cortese MJ, Watson JM. Beyond mean response latency: Response time distributional analyses of semantic priming. Journal of Memory and Language. 2008;59(4):495–523. [Google Scholar]
- Beckmann CF, DeLuca M, Devlin JT, Smith SM. Investigations into resting-state connectivity using independent component analysis. Philos Trans R Soc Lond, B, Biol Sci. 2005;360:1001–1013. doi: 10.1098/rstb.2005.1634. [DOI] [PMC free article] [PubMed] [Google Scholar]
- Berg L, McKeel DW, Jr, Miller JP, Storandt M, Rubin EH, Morris JC, Baty J, Coats M, Norton J, Goate AM, Price JL, Gearing M, Mirra SS, Saunders AM. Clinicopathologic studies in cognitively healthy aging and Alzheimer’s disease: Relation of histologic markers to dementia severity, age, sex, and apolipoprotein E genotype. Archives of Neurology. 1998;55:326–335. doi: 10.1001/archneur.55.3.326. [DOI] [PubMed] [Google Scholar]
- Binder JR, Frost JA, Hammeke TA, Bellgowan PSF, Rao SM, Cox RW. Conceptual processing during the conscious resting state: a functional MRI study. Journal of Cognitive Neuroscience. 1999;11:80–93. doi: 10.1162/089892999563265. [DOI] [PubMed] [Google Scholar]
- Braver TS, Barch DM, Gray JR, Molfese DL, Snyder A. Anterior cingulate cortex and response conflict: Effects of frequency, inhibition, and errors. Cerebral Cortex. 2001;11:825–836. doi: 10.1093/cercor/11.9.825. [DOI] [PubMed] [Google Scholar]
- Brier MR, Thomas JB, Snyder AZ, et al. Loss of intranetwork and internetwork resting state functional connections with Alzheimer’s disease progression. J Neurosci. 2012;32(26):8890–9. doi: 10.1523/JNEUROSCI.5698-11.2012. 27. [DOI] [PMC free article] [PubMed] [Google Scholar]
- Botvinick MM, Braver TS, Barch DM, Carter CS, Cohen JD. Conflict monitoring and cognitive control. Psychological Review. 2001;108:624–652. doi: 10.1037/0033-295x.108.3.624. [DOI] [PubMed] [Google Scholar]
- Buckner RL, Snyder AZ, Shannon BJ, LaRossa G, Sachs R, Fotenos AF, Sheline YI, Klunk WE, Mathis CA, Morris JC, Mintun MA. Molecular, structural, and functional characterization of Alzheimer’s disease: evidence for a relationship between default activity, amyloid, and memory. Journal of Neuroscience. 2005;25:7709–7717. doi: 10.1523/JNEUROSCI.2177-05.2005. [DOI] [PMC free article] [PubMed] [Google Scholar]
- Buckner RL, Andrews-Hanna JR, Schacter DL. The brain’s default network: anatomy, function, and relevance to disease. Ann N Y Acad Sci. 2008;1124:1–38. doi: 10.1196/annals.1440.011. [DOI] [PubMed] [Google Scholar]
- Burke WJ, Miller JP, Rubin EH, Morris JC, Coben LA, Duchek JM, Wittels IG, Berg L. Reliability of the Washington University Clinical Dementia Rating. Archives of Neurology. 1988;45:31–32. doi: 10.1001/archneur.1988.00520250037015. [DOI] [PubMed] [Google Scholar]
- Castel AD, Balota DA, McCabe DP. Memory efficiency and the strategic control of attention at encoding: Impairments of value-directed remembering in Alzheimer’s disease. Neuropsychology. 2009;23(3):297–306. doi: 10.1037/a0014888. [DOI] [PMC free article] [PubMed] [Google Scholar]
- Christensen H, Dear KBG, Anstey KJ, Parslow RA, Sachdev P, Jorm AF. Within-occasion intraindividual variability and preclinical diagnostic status: Is intraindividual variability an indicator of Mild Cognitive Impairment? Neuropsychology. 2005;19:309–317. doi: 10.1037/0894-4105.19.3.309. [DOI] [PubMed] [Google Scholar]
- Coste CP, Sadaghiani S, Friston KJ, Kleinschmidt A. Ongoing brain activity fluctuations directly account for intertrial and indirectly for intersubject variability in Stroop task performance. Cerebral Cortex. 2011;21:2612–2619. doi: 10.1093/cercor/bhr050. [DOI] [PubMed] [Google Scholar]
- Cousineau D, Brown SD, Heathcote A. Fitting distributions using maximum likelihood: Methods and packages. Behavior Research Methods, Instruments, & Computers. 2004;36:742–756. doi: 10.3758/bf03206555. [DOI] [PubMed] [Google Scholar]
- de Calignon A, Polydoro M, Suárez-Calvet M, William C, Adamowicz DH, Kopeikina KJ, Pitstick R, Sahara N, Ashe KH, Carlson GA, Spires-Jones TL, Hyman BT. Propagation of tau pathology in a model of early Alzheimer’s disease. Neuron. 2012;73:685–697. doi: 10.1016/j.neuron.2011.11.033. [DOI] [PMC free article] [PubMed] [Google Scholar]
- Dixon RA, Garrett DD, Lentz TL, MacDonald SWS, et al. Neurocognitive markers of cognitive impairment: Exploring the roles of speed and inconsistency. Neuropsychology. 2007;21:381–399. doi: 10.1037/0894-4105.21.3.381. [DOI] [PubMed] [Google Scholar]
- Drzezga A, Becker JA, Van Dijk KR, Sreenivasan A, Talukdar T, Sullivan C, Schultz AP, Sepulcre J, Putcha D, Greve D, Johnson KA, Sperling RA. Neuronal dysfunction and disconnection of cortical hubs in non-demented subjects with elevated amyloid burden. Brain. 2011;134:1635–1646. doi: 10.1093/brain/awr066. [DOI] [PMC free article] [PubMed] [Google Scholar]
- Duchek JM, Balota DA, Tse CS, Holtzman DM, Fagan AM, Goate AM. The utility of intraindividual variability in selective attention tasks as an early marker for Alzheimer’s disease. Neuropsychology. 2009;23(6):746–758. doi: 10.1037/a0016583. [DOI] [PMC free article] [PubMed] [Google Scholar]
- Fagan AM, Mintun MA, Mach RH, Lee SY, Dence CS, Shah AR, LaRossa GN, Spinner ML, Klunk WE, Mathis CA, DeKosky ST, Morris JC, Holtzman DM. Inverse relation between in vivo amyloid imaging load and cerebrospinal fluid Abeta42 in humans. Annals of Neurology. 2006;59:512–519. doi: 10.1002/ana.20730. [DOI] [PubMed] [Google Scholar]
- Fagan AM, Roe CM, Xiong C, Mintun MA, Morris JC, Holtzman DM. Cerebrospinal fluid tau/_-amyloid-sub-4-sub-2 ratio as a prediction of cognitive decline in nondemented older adults. Archives of Neurology. 2007;64:343–349. doi: 10.1001/archneur.64.3.noc60123. [DOI] [PubMed] [Google Scholar]
- Faust ME, Balota DA. Inhibition, facilitation, and attentional control in dementia of the Alzheimer type: The role of unifying principles in cognitive theory development. In: Gorfein DS, McLeod C, editors. Inhibition in Cognition. APA; Washington DC: 2007. pp. 213–238. [Google Scholar]
- Fox MD, Greicius MD. Clinical applications of functional resting state connectivity. Frontiers in Systems Neuroscience. 2010;4:1–13. [Google Scholar]
- Fox MD, Raichle ME. Spontaneous fluctuations in brain activity observed with functional magnetic resonance imaging. Nat Rev Neurosci. 2007;8(9):700–711. doi: 10.1038/nrn2201. [DOI] [PubMed] [Google Scholar]
- Fox MD, Zhang D, Snyder AZ, Raichle ME. The global signal and observed anticorrelated resting state brain networks. J Neurophysiol. 2009;101:3270–3283. doi: 10.1152/jn.90777.2008. [DOI] [PMC free article] [PubMed] [Google Scholar]
- Goodglass H, Kaplan E. Boston Naming Test. Lea & Febiger; PA: 1983. [Google Scholar]
- Greicius MD, Krasnow B, Reiss AL, Menon V. Functional connectivity in the resting brain: a network analysis of the default mode hypothesis. Proc Natl Acad Sci U S A. 2003;100(1):253–258. doi: 10.1073/pnas.0135058100. [DOI] [PMC free article] [PubMed] [Google Scholar]
- Greicius MD, Srivastava G, Reiss AL, Menon V. Default-mode network activity distinguishes Alzheimer’s disease from healthy aging: evidence from functional MRI. Proceedings of the National Academy of Sciences. 2004;101(13):4637–42. doi: 10.1073/pnas.0308627101. [DOI] [PMC free article] [PubMed] [Google Scholar]
- Grober E, Buschke H, Crystal H, Bang S, Dresner R. Screening for dementia by memory testing. Neurology. 1988;38:900–903. doi: 10.1212/wnl.38.6.900. [DOI] [PubMed] [Google Scholar]
- Heathcote A, Brown SD. Reply to Speckman and Rouder: A theoretical basis for QML. Psychonomic Bulletin & Review. 2004;11:577–578. doi: 10.3758/bf03196613. [DOI] [PubMed] [Google Scholar]
- Heathcote A, Brown S, Mewhort DJK. Quantile maximum likelihood estimation of response time distributions. Psychonomic Bulletin & Review. 2002;9:394–401. doi: 10.3758/bf03196299. [DOI] [PubMed] [Google Scholar]
- Hedden T, Van Dijk KR, Becker JA, et al. Disruption of functional connectivity in clinically normal older adults harboring amyloid burden. Journal of Neuroscience. 2009;29(40):12686–94. doi: 10.1523/JNEUROSCI.3189-09.2009. [DOI] [PMC free article] [PubMed] [Google Scholar]
- Hutchison KA, Balota DA, Duchek JM. The utility of Stroop task switching as a marker for early stage Alzheimer’s Disease. Psychology & Aging. 2010;25:545–559. doi: 10.1037/a0018498. [DOI] [PMC free article] [PubMed] [Google Scholar]
- Kane MJ, Engle RW. Working-memory capacity and the control of attention: The contributions of goal maintenance, response competition, and task set to Stroop interference. Journal of Experimental Psychology: General. 2003;132:47–70. doi: 10.1037/0096-3445.132.1.47. [DOI] [PubMed] [Google Scholar]
- Kelly CAM, Uddin LQ, Biswal BB, Castellanos FX, Milham MP. Competition between functional brain networks mediates behavioral variability. Neuroimage. 2008;39(1):527–537. doi: 10.1016/j.neuroimage.2007.08.008. [DOI] [PubMed] [Google Scholar]
- Lustig C, Snyder AZ, Bhakta M, O’Brien KC, McAvoy M, Raichle ME, Morris JC, Buckner RL. Functional deactivations: change with age and dementia of the Alzheimer type. Proc Natl Acad Sci. 2003;100:14504–14509. doi: 10.1073/pnas.2235925100. [DOI] [PMC free article] [PubMed] [Google Scholar]
- MacLeod CM. The Stroop task: The “gold standard” of attentional measures. Journal of Experimental Psychology: General. 1992;121:12–14. [Google Scholar]
- McKhann G, Drachman D, Folstein M, Katzman R, Price D, Stadlan EM. Clinical diagnosis of Alzheimer’s disease: Report of the NINCDS-ADRDA work group under the auspices of the Department of Health and Human Services Task Force on Alzheimer’s disease. Neurology. 1984;34:939–944. doi: 10.1212/wnl.34.7.939. [DOI] [PubMed] [Google Scholar]
- Mevel K, Chetelat G, Eustache F, Desgranges B. The default mode network in healthy aging and Alzheimer’s disease. International Journal of Alzheimer’s Disease. 2011:535816. doi: 10.4061/2011/535816. [DOI] [PMC free article] [PubMed] [Google Scholar]
- Morris JC. The Clinical Dementia Rating (CDR): current version and scoring rules. Neurology. 1993;43(11):2412–2414. doi: 10.1212/wnl.43.11.2412-a. [DOI] [PubMed] [Google Scholar]
- Morris JC, Roe CM, Xiong C, et al. APOE predicts amyloid-beta but not tau Alzheimer pathology in cognitively normal aging. Ann Neurol. 2010;67(1):122–131. doi: 10.1002/ana.21843. [DOI] [PMC free article] [PubMed] [Google Scholar]
- Nee D, Wager T, Jonides J. Interference resolution: Insights from a meta-analysis of neuroimaging tasks. Cognitive, Affective & Behavioral Neuroscience. 2007;7(1):1–17. doi: 10.3758/cabn.7.1.1. [DOI] [PubMed] [Google Scholar]
- Ojemann JG, Buckner RL, Corbetta M, Raichle ME. Imaging studies of memory and attention. Neurosurg Clin N Am. 1997;8(3):307–319. [PubMed] [Google Scholar]
- Pardo JV, Pardo PJ, Janer KW, Raichle ME. The anterior cingulate cortex mediates processing selection in the Stroop attentional conflict paradigm. Proc Natl Acad Sci. 1990;87:256–259. doi: 10.1073/pnas.87.1.256. [DOI] [PMC free article] [PubMed] [Google Scholar]
- Perry RJ, Hodges JR. Attention and executive deficits in Alzheimer’s disease: A critical review. Brain. 1999;122:383–404. doi: 10.1093/brain/122.3.383. [DOI] [PubMed] [Google Scholar]
- Price JL, Morris JC. Tangles and plaques in nondemented aging and “preclinical” Alzheimer’s disease. Annals of Neurology. 1999;45:358–368. doi: 10.1002/1531-8249(199903)45:3<358::aid-ana12>3.0.co;2-x. [DOI] [PubMed] [Google Scholar]
- Power JD, Barnes KA, Snyder AZ, Schlaggar BL, Petersen SE. Spurious but systematic correlations in functional connectivity MRI networks arise from subject motion. Neuroimage. 2012;59:2142–2154. doi: 10.1016/j.neuroimage.2011.10.018. [DOI] [PMC free article] [PubMed] [Google Scholar]
- Raichle ME, MacLeod AM, Snyder AZ, Powers WJ, Gusnard DA, Shulman GL. A default mode of brain function. PNAS. 2001;98(2):676–682. doi: 10.1073/pnas.98.2.676. [DOI] [PMC free article] [PubMed] [Google Scholar]
- Schmiedek F, Oberauer K, Wilhelm O, Süß H-M, Wittmann WW. Individual differences in components of reaction time distributions and their relations to working memory and intelligence. Journal of Experimental Psychology: General. 2007;136:414–429. doi: 10.1037/0096-3445.136.3.414. [DOI] [PubMed] [Google Scholar]
- Seely WW, Menon V, Schatzberg AF, Keller J, Glover GH, Kenna H, Reiss AL, Greicius MD. Dissociable intrinsic connectivity networks for salience processing and executive control. Journal of Neuroscience. 2007;27:2349–2356. doi: 10.1523/JNEUROSCI.5587-06.2007. [DOI] [PMC free article] [PubMed] [Google Scholar]
- Shallice T, Burgess PW. The domain of supervisory processes and temporal organization of behavior. Philosophical transactions of the Royal Society of London. Series B: Biological Sciences. 1996;351(1346):1405–1412. doi: 10.1098/rstb.1996.0124. [DOI] [PubMed] [Google Scholar]
- Sheline YI, Morris JC, Snyder AZ, Price JL, Yan Z, D’Angelo G, et al. APOE4 allele disrupts resting state fMRI connectivity in the absence of amyloid plaques or decreased CSF AB42. Journal of Neuroscience. 2010a;30:17035–17040. doi: 10.1523/JNEUROSCI.3987-10.2010. [DOI] [PMC free article] [PubMed] [Google Scholar]
- Sheline YI, Raichle ME, Snyder AZ, Morris JC, Head D, Wang S, et al. Amyloid plaques disrupt resting state default mode network connectivity in cognitively normal elderly. Biol Psychiatry. 2010b;67(6):584–587. doi: 10.1016/j.biopsych.2009.08.024. [DOI] [PMC free article] [PubMed] [Google Scholar]
- Shulman GL, Pope DL, Astafiev SV, McAvoy MP, Snyder AZ, Corbetta M. Right hemisphere dominance during spatial selective attention and target detection occurs outside the dorsal frontoparietal network. Journal of Neuroscience. 2010;30:3640–3651. doi: 10.1523/JNEUROSCI.4085-09.2010. [DOI] [PMC free article] [PubMed] [Google Scholar]
- Smyser CD, Inder TE, Shimony JS, Hill JE, Degnan AJ, Snyder AZ, Neil JJ. Longitudinal analysis of neural network development in preterm infants. Cerebral Cortex. 2010;20:2852–2862. doi: 10.1093/cercor/bhq035. [DOI] [PMC free article] [PubMed] [Google Scholar]
- Speckman PL, Rouder JN. A comment on Heathcote, Brown, and Mewhort’s QMLE method for response time distributions. Psychonomic Bulletin & Review. 2004;11:574–576. doi: 10.3758/bf03196613. [DOI] [PubMed] [Google Scholar]
- Sperling RA, Laviolette PS, O’Keefe K, O’Brien J, Rentz DM, Pihlajamaki M, Marshall G, Hyman BT, Selkoe DJ, Hedden T, Buckner RL, Becker JA, Johnson KA. Amyloid deposition is associated with impaired default network function in older persons without dementia. Neuron. 2009;63(2):178–88. doi: 10.1016/j.neuron.2009.07.003. 30. [DOI] [PMC free article] [PubMed] [Google Scholar]
- Spieler DH, Balota DA, Faust ME. Stroop performance in healthy younger and older adults and in individuals with dementia of the Alzheimer’s type. J Exp Psychol Hum Percept Perform. 1996;22(2):461–479. doi: 10.1037//0096-1523.22.2.461. [DOI] [PubMed] [Google Scholar]
- Spieler DH, Balota DA, Faust ME. Levels of selective attention revealed through analyses of response time distributions. J Exp Psychol Hum Percept Perform. 2000;26:506–526. doi: 10.1037//0096-1523.26.2.506. [DOI] [PubMed] [Google Scholar]
- Sommers MS, Huff LM. The effects of age and dementia of the Alzheimer’s type on phonological false memories. Psychology and Aging. 2003;18(4):791–806. doi: 10.1037/0882-7974.18.4.791. [DOI] [PubMed] [Google Scholar]
- Storandt M, Grant EA, Miller JP, Morris JC. Longitudinal course and neuropathologic outcomes in original vs. revised MCI and in pre-MCI. Neurology. 2006;67:467–473. doi: 10.1212/01.wnl.0000228231.26111.6e. [DOI] [PubMed] [Google Scholar]
- Storandt M, Mintun MA, Head D, Morris JC. Cognitive decline and brain volume loss as signatures of cerebral amyloid-beta peptide deposition identified with Pittsburgh compound B: cognitive decline associated with Abeta deposition. Arch Neurol. 2009;66(12):1476–1481. doi: 10.1001/archneurol.2009.272. [DOI] [PMC free article] [PubMed] [Google Scholar]
- Thurstone LE, Thurstone TG. Examiner manual for the SRA Primary Mental Abilities Test. Science Research Associates; Chicago: 1949. [Google Scholar]
- Tse C-S, Balota DA, Yap MJ, Duchek JM, McCabe DP. Effects of healthy aging and early-stage dementia of the Alzheimer’s type on components of response time distributions in three attention tasks. Neuropsychology. 2010;24:300–315. doi: 10.1037/a0018274. [DOI] [PMC free article] [PubMed] [Google Scholar]
- Van Dijk KRA, Sabuncu MR, Buckner RL. The influence of head motion on intrinsic functional connectivity MRI. Neuroimage. 2012;59:431–438. doi: 10.1016/j.neuroimage.2011.07.044. [DOI] [PMC free article] [PubMed] [Google Scholar]
- Vaishnavi SN, Vlassenko AG, Rundle MM, Snyder AZ, Mintun MA, Raichle ME. Regional aerobic glycolysis in the human brain. Proc Natl Acad Sci U S A. 2010;107(41):17757–62. doi: 10.1073/pnas.1010459107. [DOI] [PMC free article] [PubMed] [Google Scholar]
- Wang L, Roe CM, Snyder AZ, Brier MR, Thomas JB, Xiong C, Benzinger TL, Morris JC, Ances BM. Alzheimer’s disease family history impacts resting state functional connectivity. Annals of Neurology. 2012a;72:571–577. doi: 10.1002/ana.23643. [DOI] [PMC free article] [PubMed] [Google Scholar]
- Wang L, Brier MR, Snyder AZ, Thomas JB, Fagan AM, Xiong C, et al. Cerebrospinal fluid Aβ42, ptau181, and resting state functional connectivity. 2012b doi: 10.1001/jamaneurol.2013.3253. Submitted. [DOI] [PMC free article] [PubMed] [Google Scholar]
- Wechsler D. Wechsler Adult Intelligence Scale (Manual) Psychological Corp.; San Antonio, TX: 1955. [Google Scholar]
- Wechsler D, Stone CP. Wechsler Memory Scale (Manual) Psychological Corp.; San Antonio, TX: 1973. [Google Scholar]
- Zhang D, Raichle ME. Disease and the brain’s dark energy. Nat Rev Neurology. 2010;6:15–28. doi: 10.1038/nrneurol.2009.198. [DOI] [PubMed] [Google Scholar]