

Summary
Using an instrumented vehicle, we have studied several aspects of the on-road performance of healthy and diseased elderly drivers. One goal from such studies is to ascertain the type and frequency of driving safety errors. Because the judgment of such errors is somewhat subjective, we applied a taxonomy system of 15 general safety error categories and 76 specific safety error types. We also employed and trained professional driving instructors to review the video data of the on-road drives. In this report, we illustrate our rating system on a group of 111 drivers, ages 65 to 89. These drivers made errors in 13 of the 15 error categories, comprising 42 of the 76 error types. A mean (SD) of 35.8 (12.8) safety errors per drive were noted, with 2.1 (1.7) of them being judged as serious. Our methodology may be useful in applications such as intervention studies, and in longitudinal studies of changes in driving abilities in patients with declining cognitive ability.
OBJECTIVES
We have used an instrumented vehicle (IV) to observe driver performance during normal driving, as well as during a variety of secondary tasks. During such drives, our protocols require a research staff member to be in the passenger seat of the vehicle, to give instructions and, if necessary, to operate the dual controls of the vehicle. Because the research staff member is occupied with such duties, we have found it unfeasible for this person to concurrently measure safety outcomes during the drive. Hence, we have found it necessary to perform safety ratings retrospectively based on video review of the entire drive. In this paper, we describe the methodology for such a rating system, including the taxonomy of errors and the method of video review. We also illustrate our methods in a group of 111 elderly drivers.
METHODS
Instrumented vehicle
The IV we used is known as ARGOS (the Automobile for Research in Ergonomics and Safety), a mid-sized automatic transmission car with hidden instrumentation and sensors (Rizzo et al, 1997). The on-road test was preceded by driver screening at curbside to test several important requirements for driving, including: (1) locating the vehicle controls and signals, (2) inserting the key in the ignition, (3) starting the car, (4) shifting from park to drive, (5) driving forward 20 meters, and (6) stopping. The driving assessment consisted of a 35-mile route, incorporating essential maneuvers such as left and right turns, stopping at a stop sign, and maintaining vehicle control. The route was a mix of in-town and rural segments, and generally requited about 45 minutes to complete. During approximately 20% of the route, we introduced standardized challenges that stress critical cognitive abilities during the driving task, including landmark identification, route-finding, and numerical computations (Rizzo et al, 2004; Uc et al, 2004; 2005).
Performance data (steering wheel position, accelerator and brake pedal position, lateral and longitudinal acceleration, and vehicle speed) were digitized at 10 Hz. Four miniature cameras captured black-and-white video information during the drive at 10 frames per second. The four views often included: A) Head and shoulders of driver, B) Steering wheel and hands of driver, C) Forward view of road and oncoming traffic, and D) Forward view of center line. For some drives, the steering wheel camera (view “B”) was repositioned to view the foot pedal area. Figure 1 shows an example of the information captured by videotape (identity masked for this report). Note that the digitized information of steering wheel position, accelerator position, brake pedal position, speed, and lateral acceleration are imposed on the four-view video, facilitating the judgment of certain types of errors. Sound was also recorded.
Figure 1.
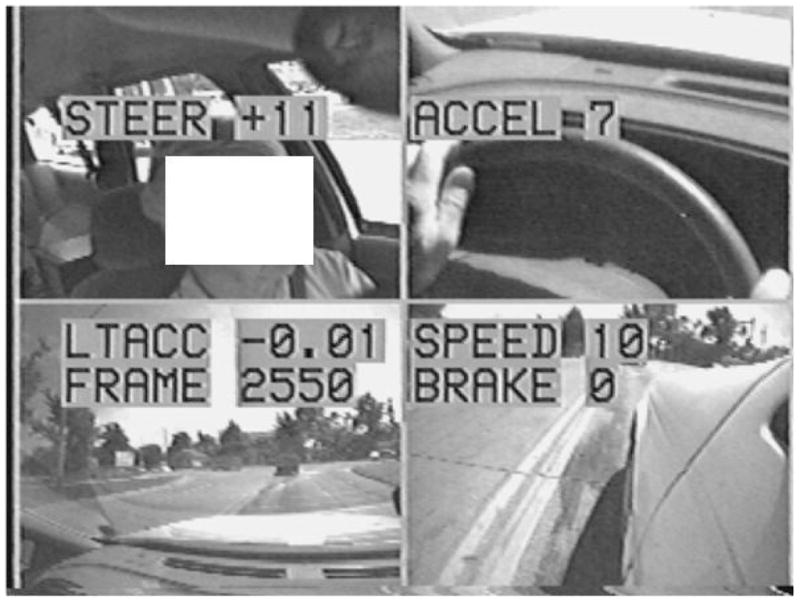
Example of the multiplexed views from the video of a driver in the IV.
At frame 2550, superimposed data show steering wheel position (STEER +11 degrees clockwise), slight lateral acceleration toward the center line (LTACC −0.01 g), slight accelerator pedal application (ACCEL 7%), SPEED of 10 mph, and no brake pedal application (BRAKE 0%).
Taxonomy
We based our evaluation tool on the Iowa Department of Transportation (IDOT) Drive Test Scoring Standards (September 7, 2005), incorporating a few minor modifications based on feedback from a professional driving instructor and our research staff. Our research focus is on the number and types of errors committed by drivers in our studies. There were 15 major categories of errors: Starting & Pulling Away from Curb, Traffic Signals, Stop Signs, Other Signs, Turns, Lane Observance, Lane Changes & Merging, Overtaking, Control of Speed, Backing Up, Parallel Parking, Angle or Head-in Parking, Curves, Railroad Crossings, and Miscellaneous. Each of these 15 general categories had between two and nine specific error types defined, giving a total of 76 possible errors. Among these 76 error types, there were 30 that were judged by a committee of five investigators as being “serious”. See Table 1 for details. Because our drive did use the exact components of the state on-road test used for licensure, we did not assign pass/fail grades.
Table 1.
Classification system for on-road errors, containing 15 categories (in bold) and 76 specific types.
| Starting & Pulling Away from Curb | |
| SP1 | Failure to turn on signal to indicate entering the road way (F or P) * |
| SP2 | Failure to check mirrors before entering the road way |
| SP3 | Failure to check blind spot (Head check) before entering the road way |
| Traffic Signals | |
| TS1 | Stops in intersection (FA) (S) |
| TS2 | Fails to make a complete stop before turning right on red: The “speed” indicator must reach 0 (FA) * |
| TS3 | Stops completely over crosswalk or after stop line (FA) * |
| TS4 | Enters intersection on red light (FA) (S) * |
| TS5 | Proceeds through the intersection on a yellow light even though a safe stop could have been made (FA) * |
| TS6 | Fails to proceed through intersection even though the light had turned green (FA) (S) * |
| TS7 | Premature or abrupt stop at traffic signal * |
| Stop Signs | |
| SS1 | Stops complete across crosswalk or stop line (FA) * |
| SS2 | Fails to make a complete stop: The “speed” indicator must reach 0 (FA) * |
| SS3 | Stops in intersection (original stop, not creeping) (FA) (S) * |
| SS4 | Fails to stop when entering a public roadway from a private roadway (FA) * |
| SS5 | Fails to yield the right of way (S) |
| SS6 | Premature or abrupt stop at stop sign * |
| Other Signs | |
| OS1 | Fails to observe “No Turning on Red” sign |
| OS2 | Fails to observe “One Way” sign (S) |
| OS3 | Failure to “Yield to Pedestrians” |
| OS4 | Fails to observe “No Passing” signs (S) |
| Turns | |
| T1 | Turns into the wrong lane. (P) * |
| T2 | Failure to signal or inadequate signal before a turn. (FA) * |
| T3 | Turns from the wrong lane. (FA) (S) * |
| T4 | Drives one or more wheel over the curb (FA) (S) |
| T5 | When turning left, right wheels are left of the center of road entering or leaving intersection. (FA) (S) |
| T6 | Turn too wide: Car should not cross into other lanes when turning * |
| T7 | Turn too sharp: Vehicle should not cross into other lanes when turning * |
| T8 | Fails to yield to oncoming vehicles or cross traffic when turning (S) * |
| Lane Observance | |
| LO1 | Lane Deviations (Use only when other lane deviation codes not applicable) * |
| LO2 | Touches Lane line when not overtaking * |
| LO3 | Straddles lane line (P) * |
| LO4 | Touches center line when not overtaking (F) * |
| LO5 | Straddles the center line (FA) (S) * |
| LO6 | Hits curb (FA) (S) |
| LO7 | Drives on the wrong side of the road-- right wheel left of centerline(FA) (S) |
| LO8 | Gives indication of possibly striking parked or oncoming vehicles (FA) (S) |
| Lane Changes & Merging: applies to all road types (highway, business, residential, etc.) | |
| LC1 | Failure to cancel signal after making lane change or merge (P) * |
| LC2 | Failure to signal or inadequate signal prior to change lane or merge/exit (P) * |
| LC3 | Executes a lane change while approaching an intersection (P) * |
| LC4 | Does not maintain proper speed while changing lanes or merging (P) * |
| LC5 | Decelerating on highway / interstate instead of on off ramp (P) * |
| LC6 | Executes a lane change while in an intersection (P) * |
| LC7 | Failure to yield when changing lanes or merging (FA) (S) * |
| LC8 | Excessive ramp speed. Exceeds advisory speed by >5mph (P) |
| LC9 | No head check (checking blind spot) before changing lanes or merging * |
| Overtaking (passing other vehicles) | |
| O1 | Overtakes a vehicle at an intersection in violation of the law (FA) (S) |
| O2 | Failure to signal or inadequate signal (P) * |
| O3 | Overtakes a vehicle on the right in violation of the law (FA) |
| O4 | Overtakes a vehicle on the left side of any road at the blind crest of the curve (FA) (S) |
| O5 | Drives over the solid yellow line when overtaking a vehicle (FA) (S) |
| O6 | Unsafe pass (S) * |
| Control of Speed | |
| CS1 | Exceeds the speed limit by 5 mph or more over (FA) * |
| CS2 | Excessively low speed: speed 10 mph or less below the posted speed limit * |
| Backing Up a Vehicle | |
| B1 | Does not look towards the rear (FA) (S) * |
| B2 | Uses excessive speed (FA) (S) |
| Parallel Parking | |
| PP1 | Unable to back vehicle or has no degree of control or sense of direction (FA) (S) |
| PP2 | Bumps other vehicles (FA) (S) |
| PP3 | Does not signal intent to park (P) * |
| PP4 | One wheel over curb (P) |
| Angle or Head – In parking | |
| AP1 | Does not signal intent to park (P) |
| AP2 | Hits curb (P) |
| Curves | |
| C1 | Lane Deviation during curve (Use only when other lane deviation codes not applicable) |
| C2 | Touches Lane line during curve |
| C3 | Straddles lane line curing curve (P) |
| C4 | Touches center line during curve (F) * |
| C5 | Straddles the center line during curve (FA) (S) |
| C6 | Hits curb or drives off of roadway during curve (FA) (S) |
| C7 | Drives on the wrong side of the road during curve-- right wheel left of centerline(FA) (S) |
| C8 | Gives indication of possibly striking parked or oncoming vehicles during curve (FA) (S) |
| Railroad Crossings | |
| RR1 | Fails to verify tracks are safe to cross * |
| RR2 | Approaches or crosses railroad too fast |
| RR3 | Fails to cross railroad tracks at an appropriate speed (should cross with adequate momentum to coast through crossing) |
| Miscellaneous | |
| MIS01 | Stops too close to vehicle ahead: should be able to see the bottom of the tires in the car in front |
| MIS02 | Fails to move over or slow down for roadside hazards, emergency vehicles or merging traffic * |
| MIS03 | Unsafe maneuver: this is a general catch-all category for errors that cannot be otherwise classified. (S) * |
| MIS04 | Follows too closely (Tailgating) (S) * |
F = Fair Performance as designated by the Iowa Department of Transportation (when traffic is not present), P = Poor Performance as designated by the Iowa Department of Transportation (when traffic is present), and FA = Failure as designated by the Iowa Department of Transportation. S = Serious error, as judged by our research team. Errors that were seen in our dataset of 111 elderly drivers are marked with *.
Video review
A certified driving instructor was employed to review the videotapes in order to assess the number and type of safety errors committed by the drivers. The instructor was already highly familiar with the IDOT evaluation from which our scoring system was derived, and was further trained by us to become familiar with the format of our video data and video review equipment. This instructor viewed each videotape carefully, using the forward, fast-forward, reverse, and pause features as seen fit. The soundtrack also was used, and provided information regarding whether or not the turn signal was used. When a safety error was observed, the error type was recorded, along with the beginning and ending frame numbers of the error. Most videotapes were approximately 45 minutes in length, and typically required 60–90 minutes to review. A set of 30 videotapes across multiple protocols were sampled to be read twice by the primary rater, and once by the secondary rater who was also a certified driving instructor. When assessing the total number of errors per driver, we found a 95% intra-rater correlation and a 73% inter-rater correlation (Dawson, Anderson, et al, 2009).
Data Example
Subjects were healthy elderly driver that were originally used as comparison subjects in studies of Alzheimer’s disease and Parkinson’s disease. Data were obtained on 111 drivers (58 males and 53 females), ages 65 to 89 years. Descriptive statistics included means, standard deviations, and proportions.
RESULTS
The mean (SD) age of the subjects was 72.2 (5.2) years, while the mean (SD) level of education was 15.9 (2.7) years. All subjects safely passed the screening protocol. During the drive, an average of 35.8 (12.8) errors per drive were noted, with 2.1 (1.6) errors per drive being judged as serious. Errors were observed in 13 of the 15 general categories. The only categories where errors were not observed were Angle or Head-in Parking (which was not part of the route) and Other Signs. The most common category of errors was Lane Observance (an average of 12.4 per drive), followed by Turns (5.5), Lane Change (5.1), Stop Signs (4.2), Control of Speed (3.7), and Traffic Signals (2.4). Of the 76 specific error types, there were 42 types with at least one occurrence noted. The most common specific types of errors were L04 (touching center line), LC9 (no head check when changing lanes), and SS2 (failing to completely stop at stop sign).
In a post-study interview, our primary rater suggested that the camera showing the centerline and the front left tire gave the most important view (“D”), followed by the general forward view (“C). The head and shoulder view (“A”) was less important, used primarily to determine whether the driver was checking mirrors and blind spots. The view of the steering wheel or the pedal area (“B”) was rarely helpful. Instead, our rater suggested that it would have been more useful to have a camera mounted on the right side of the vehicle looking down at the right-hand lane marking and shoulder. If more than four views could be available, it may have been beneficial having cameras pointing to the right and left so that cross-traffic could be seen. Other suggestions for improvement included cleaning the external camera (view “D”) more often, using color video (to help identify the lane markings and the traffic lights), and having on-screen indicators of turn signals.
CONCLUSIONS
Using videotape recordings to assess driver safety in an instrumented vehicle is feasible and reliable. There are advantages and disadvantages of this approach compared to an in-person real-time rating system. Advantages include having standardized views of the driving environment, so that every subject is treated equally. It is also beneficial to have an archived record of the entire drive. Among the potential disadvantages is the fact that our rater may miss errors that would be easier to detect if he were in the vehicle during the drive or if additional views were available. Another is that if there are interruptions in the capture video and audio streams, such information may be lost forever. Overall, the video surveillance system has worked well, but might be modified to further accommodate expert rater needs.
Other taxonomies have been developed for other aspects of driving. In the Indiana tri-level study, Treat et al (1977) categorized the different factors that lead to crashes. More recently, Blower and Campbell (2005) examined the contributing causes to large-truck crashes. These two studies focused on instances where crashes occurred, rather than examining driving safety in a cohort of subjects in generally normal conditions. Consequently, the nature, scope, and organization of their taxonomies were quite different than ours.
Note that the video data and analysis protocol described in this report can be integrated and correlated with the other sources of electronic data from vehicle sensors as in our IVs as well as from the CAN (controlled area network) bus of many modern vehicles. These data may be sampled continuously or intermittently using event related triggers, such as lateral or longitudinal acceleration beyond a critical value (say 0.5g). The intermittent approach may be advantageous in studies that take samples of driver data in unstructured (“naturalistic”) settings over extended time intervals.
Driving safety is affected by actual driving skills (some of which may be measured by neuropsychological tests), as well as a variety of factors involving driving strategy, such as decisions made regarding where to drive, when to drive, what distractions are allowed in the vehicle (e.g., eating, cell phone use, loud music), and the relative emphasis that drivers put on safety versus performance. The fixed-route, fixed-task nature of our study design may have standardized some of the strategic factors across drivers, implying that the observed safety was likely due to actual driving skills and the drivers’ emphasis of safety versus performance. By contrast, safety levels observed in naturalistic driving studies would need to be interpreted more broadly, as so many factors are allowed to vary widely.
We have found that safety errors measured in the manner described herein can be predicted by neuropsychological tests of cognitive, visual, and motor skills in subjects with Alzheimer’s disease (Dawson, Anderson, et al, 2009) and Parkinson’s disease (Dawson, Rizzo, et al, 2009). These results support the validity of the safety outcomes measured using our methodology. This also suggests that such outcomes may be useful when testing for the efficacy of an intervention, or when monitoring longitudinal changes in driver safety in subjects with declining cognitive ability. Overall, the use of video review of recorded drives can lead to a better understanding of the impact of neuropsychological impairments on driver’s safety.
Acknowledgments
This work was supported by NIH awards AG17177, AG15071, and NS044930.
References
- Blower D, Campbell KL. Methodology of the large truck crash causation study. Federal Motor Carrier Safety Administration. 2005:FMCSA-RI-05-035. [Google Scholar]
- Dawson JD, Anderson SW, Uc EY, Dastrup E, Rizzo M. Predictors of driving safety in early Alzheimer’s disease. Neurology. 2009;72:521–527. doi: 10.1212/01.wnl.0000341931.35870.49. [DOI] [PMC free article] [PubMed] [Google Scholar]
- Dawson JD, Rizzo M, Dastrup E, Anderson SW, Ergun Uc. Road Safety in Drivers with Parkinson’s Disease. Presented at the Transportation Research Board’s 88th Annual Meeting; January, 2009. [Google Scholar]
- Rizzo M, McGehee D, Petersen AD, Dingus TA. Development of an unobtrusively instrumented field research vehicle for objective assessments of driving performance. In: Rothengatter T, Carbonnel VE, editors. Traffic and Transport Psychology: Theory and Application. New York: Pergamon; 1997. pp. 203–208. [Google Scholar]
- Rizzo M, Stierman L, Skaar N, Dawson JD, Anderson SW, Vecera SP. Effects of acontrolled auditory-verbal distraction task on older driver vehicle control. Transportation Research Record: Journal of the Transportation Research Board. 2004;1865:1–6. [Google Scholar]
- Treat JR, Tumbas NS, McDonald ST, Shinar D, Hume RD, Mayer RE, Stanisfer RL, Castillan NJ. Tri-level study of the causes of traffic accidents. Indiana University; 1977. DOT-HS 034-3-535-77. [Google Scholar]
- Uc EY, Rizzo M, Shi Q, Anderson SW, Dawson J. Driver route-following and safety errors by drivers with stroke. Transportation Research Record: Journal of the Transportation Research Board. 2004;1899:90–95. [Google Scholar]
- Uc EY, Rizzo M, Anderson SW, Shi Q, Dawson JD. Driver landmark and traffic sign identification in early Alzheimer’s disease. J Neurol Neurosurg Psychiatry. 2005;76:764–768. doi: 10.1136/jnnp.2004.049338. [DOI] [PMC free article] [PubMed] [Google Scholar]