Abstract
Metabolite profiles of bronchoalveolar lavage fluid (BALF) from pediatric patients with cystic fibrosis (CF) were correlated to the degree of airway inflammation using nuclear magnetic resonance spectroscopy-based metabolomics. BALF was collected from 11 children with CF during clinically indicated bronchoscopy. The spectra from BALF with high levels of neutrophilic airway inflammation displayed signals from numerous metabolites, whereas the spectra from subjects with low levels of inflammation were very sparse. The metabolites identified in samples taken from subjects with high inflammation include known markers of inflammation such as amino acids and lactate, as well as many novel signals. Statistical analysis highlighted the most important metabolites that distinguished the high- from the low-inflammation groups. This first demonstration of metabolomics of human BALF shows that clear distinctions in the metabolic profiles can be observed between subjects experiencing high versus low inflammation and is a first step toward the goal of discovering novel biomarkers of airway inflammation.
Keywords: metabolomics, airway inflammation, nuclear magnetic resonance spectroscopy, pediatric, biomarkers
Introduction
Respiratory diseases such as cystic fibrosis (CF) are characterized by chronic airway inflammation that causes progressive lung injury, morbidity and mortality (Rowe et al. 2005). This inflammation leads to a number of physiological changes, not all of which are well understood. A better understanding of the metabolic changes that accompany inflammation could provide new insights into disease pathophysiology and potentially identify new biomarkers of disease severity (Sagel 2003).
Metabolomics involves the holistic profiling of metabolites within a biological matrix such as urine, serum or tissue. Using spectroscopic methods such as nuclear magnetic resonance (NMR) or mass spectrometry (MS), combined with multivariate statistics and pattern recognition, unique metabolic signatures can be elucidated that correlate with a clinical or phenotypic outcome (Nicholson et al. 1999). NMR-based metabolomics has several advantages over other analytical platforms such as MS, including the lack of any required sample preparation, the inherently quantitative signals and the non-targeted nature of NMR (Serkova & Niemann 2006). This latter feature of NMR is very important when looking at samples from a fluid such as bronchoalveolar lavage fluid (BALF) in which the metabolite profiles are expected to be quite complex as a result of the interplay between the metabolome of the host and the microbial communities. The spectra are often very crowded, containing signals from hundreds of the most abundant metabolites. Using multivariate statistical analyses those signals that are most significantly altered by the pathophysiological changes under study are highlighted. The spectra are then carefully interrogated to identify key metabolites. The identification process includes searches of NMR metabolite databases and the application of multidimensional NMR methods to confirm the structures of known metabolites or determine the structure of new ones. Identification of these key metabolites provides potential new biomarkers to track disease severity and generates insights into the metabolic pathways altered by disease pathophysiology.
The main disadvantage of NMR is that it is relatively insensitive and therefore is limited to the higher concentration metabolites. While MS offers a significantly lower limit of detection, disadvantages of MS methods include the potential biases introduced by sample preparation and differential ionization effects which can affect the detection and quantitation of metabolites. For an initial metabolomic study in which the composition of the metabolite pool is not known, an NMR approach is useful and can inform future studies by targeted MS metabolomics or other approaches to look for specific lower concentration metabolites.
Although metabolomic analyses have been applied numerous times to biofluids such as urine and blood, few studies have applied these techniques to respiratory samples. To date, metabolomics methods have been applied to BALF in only one study, which involved a rat model of 1-nitronapthaline toxicity (Azmi et al. 2005). More recently, an NMR-based approach was used to identify metabolites in exhaled breath condensate that could aid in the diagnosis of asthma, although identification of specific metabolites in the study was limited (Carraro et al. 2007).
In this study, we utilized 1H NMR-based metabolomic techniques to detect the metabolic profiles in BALF collected from 11 pediatric patients with CF with varying levels of inflammation. Statistical methods were then used to identify patterns of metabolites in BALF that distinguish the metabolite profiles from subjects with high versus low airway inflammation. This study represents the first application of NMR-based metabolomic technologies to human BALF.
Methods
Study subjects, collection of BALF, microbial analysis
Subjects were children with CF followed in the pediatric pulmonology clinic at the University of North Carolina who were scheduled for clinically indicated bronchoscopy. Indications for bronchoscopy included diagnostic evaluation (n = 1), surveillance bronchoscopy in conjunction with other scheduled procedures (n = 2) and exacerbation of pulmonary symptoms (n = 9). Subjects were prescribed a variety of CF-related medications, but none received antibiotics in the 48 h prior to the procedure. The average age was 10.8 ± 3.2 years; six subjects were female, five male. All were diagnosed with CF using CFF diagnostic criteria (Rosenstein & Cutting 1998). BALF was collected using standardized protocols, typically one to three lavages of 1 ml kg−1 of sterile normal saline and recovery by aspiration. All BALF samples were analyzed as previously described for cell counts and differential and bacterial culture (Muhlebach et al. 1999). BALF samples were placed on ice post-collection, centrifuged 16 200 g for 5 min at 4°C to remove cellular debris and bacteria, then the supernatant frozen at −80° C until they were analyzed. All human subject studies were approved by the institutional IRB, and informed consent was obtained from all subjects.
NMR measurements
The BALF samples were removed from −80°C storage and allowed to thaw at room temperature. Aliquots of 200 μl were added to 400 μl of a D2O solution containing 0.33 mM trimethylsilylpropionate (TSP) for a concentration and chemical shift reference. The solution was transferred to 5 mm NMR tubes. NMR spectra were acquired on a Varian Inova 400 MHz NMR using a 5 mm pulsed field gradient, inverse detection probe (Varian, Inc., Palo Alto, CA, USA). The spectra were acquired with 512 transients and took 1 h 8 min per sample. The pulse sequence included a 2 s water presaturation period followed by a 20 ms Carr–Purcel–Meiboom–Gill (CPMG) spin-echo sequence. The CPMG sequence provided a narrowing of the residual water signal by reducing the contributions to the line width from chemical exchange (Connor et al. 1987). The brief duration of the CPMG sequence insured a negligible effect on the quantitative nature of the experiment. A sweep width of 4406 Hz was acquired with 32 000 data points with an acquisition time of 3.7 s.
Metabolite identification was aided by the use of two-dimensional NMR experiments including the pulsed-field gradient versions of the DQCOSY, HSQC and HMBC. These experiments were run on the Inova 400 MHz NMR.
Data were processed using ACD software version 9 (Advanced Chemistry Development, Toronto, Canada). A 0.1 Hz exponential line broadening was applied to the data. The spectra were phased, baseline corrected and integrated using the ACD intelligent binning protocol and normalized based on the TSP integral. The regions from 0.5 to 4.7 ppm and 4.9 to 9.0 were included in the integration. The regions below 0.5 and above 9.0 contained only noise and the region from 4.7 to 4.9 contained the residual solvent peak.
Statistical analysis
The statistical analyses, including principal components analysis (PCA) and orthogonal partial least squares (OPLS), were performed using SimcaP+ version 11.5 (Umetrics, Umea, Sweden). Pareto scaling was applied to the NMR integration data prior to principal component analysis.
Results
BALF samples were obtained from 11 subjects with CF undergoing clinically indicated bronchoscopy, and cell counts and differential were used to divide the samples into low-inflammation (<1 neutrophils cells ml−1, n = 5) and high-inflammation (>5 million neutrophils ml−1, n = 6) groups. All high-inflammation group samples had >75% neutrophils on cell differential, and cultures of BALF all grew significant quantities of pathogenic bacteria including Haemophilus, Staphylococcus or Alcaligenes species. In contrast, the low-inflammation group samples all had <60% neutrophils on differential and none of the BALF cultures grew significant numbers of pathogens. All of the subjects from the high-inflammation group had an increase in clinical symptoms (cough and or drop in lung function) at the time of bronchoscopy, whereas increase in clinical symptoms was the indication for bronchoscopy in only two of the low-inflammation group subjects (p = 0.06).
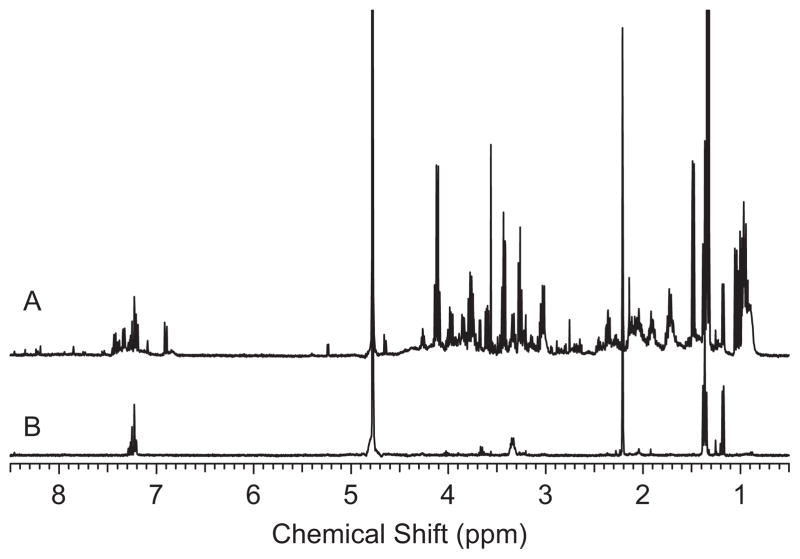
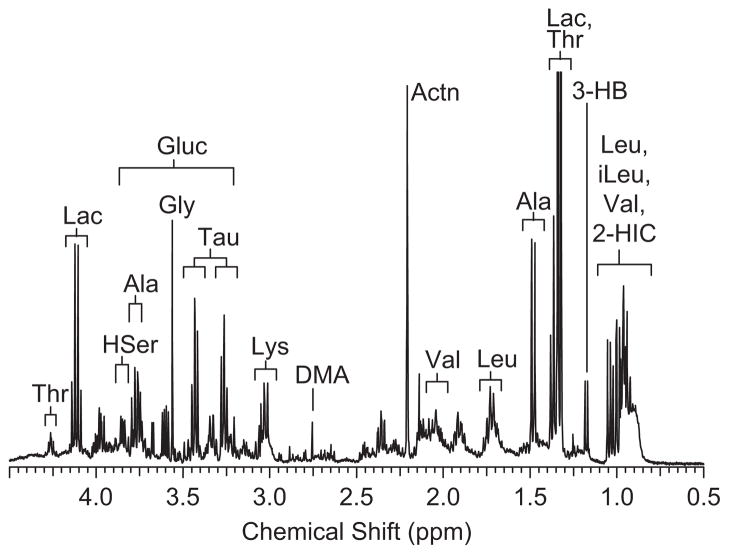
The differences in the NMR spectra of the BALF samples from low- versus high-inflammation subjects were apparent from visual inspection of the spectra. Figure 1 shows an example spectrum of each. Quite simply, the spectra from subjects with high inflammation were complex with a large number of metabolites present whereas the spectra from subjects with low inflammation were relatively featureless. Figure 2 shows an expansion of one of the spectra from a high-inflammation subject with some of the metabolites identified.
Figure 1.
Examples of 400 MHz 1H NMR spectra of bronchoalveolar lavage fluid (BALF) from (A) a subject with high inflammation and (B) a subject with low inflammation. These spectra exemplify the large difference in the number of metabolites observed in the BALF from subjects with high and low inflammation.
Figure 2.
Expansion of the 1H NMR spectrum of bronchoalveolar lavage fluid (BALF) from the high-inflammation group with metabolite assignments. Thr, threonine; Lac, lacate; HSer, homoserine; Ala, alanine; Gluc, glucose; Gly, glycine; Tau, taurine; EtOH, ethanol; Leu, leucine; DMA, dimethylamine; Actn, acetone; Val, valine; 3-HB, 3-hydroxybutyrate; iLeu, isoleucine; 2-HIC, 2-hydroxyisocaprate.
To confirm the differences between groups, we sought to analyze the data using multivariate statistical methods. However, we recognized that these analyses could be affected by the known variability in dilution of airway secretions in BALF and there is currently no commonly accepted method to correct for the extent of this dilution. While setting the sum of all integrals to a constant value for all spectra is commonly used for normalization, this assumes that the composition of the metabolite profiles is relatively constant. In the case of BALF, given the greatly increased number of metabolites present in the high-inflammation samples, normalization using an integral sum would result in artificially increasing the signals in the low-inflammation samples. Initially the spectra were referenced to the concentration of the TSP added to the samples. This did not account for the dilution inherent in the lavage process, but did provide a normalization based on sample preparation. In a next step, the spectra were examined for an endogenous metabolite that was present in all samples that appeared to be unrelated to the level of inflammation. The peak for acetone at 2.1 ppm was found in all spectra and this was used as the normalizing factor. The presence of acetone within the BALF samples was not surprising, as this compound is known to be present at relatively high and stable concentrations within the human airway (Anderson et al. 2006). While airway acetone levels can be affected by diabetic ketoacidosis, none of the subjects in this study had diabetes and all had normal blood sugars (<140 mg dl−1) measured at or around the time of bronchoscopy. All statistical models of the data were performed using acetone normalization. However, we note that the statistical models created with the acetone normalization still displayed some segregation of samples based on concentration and therefore it appears that this does not completely account for the dilution factor.
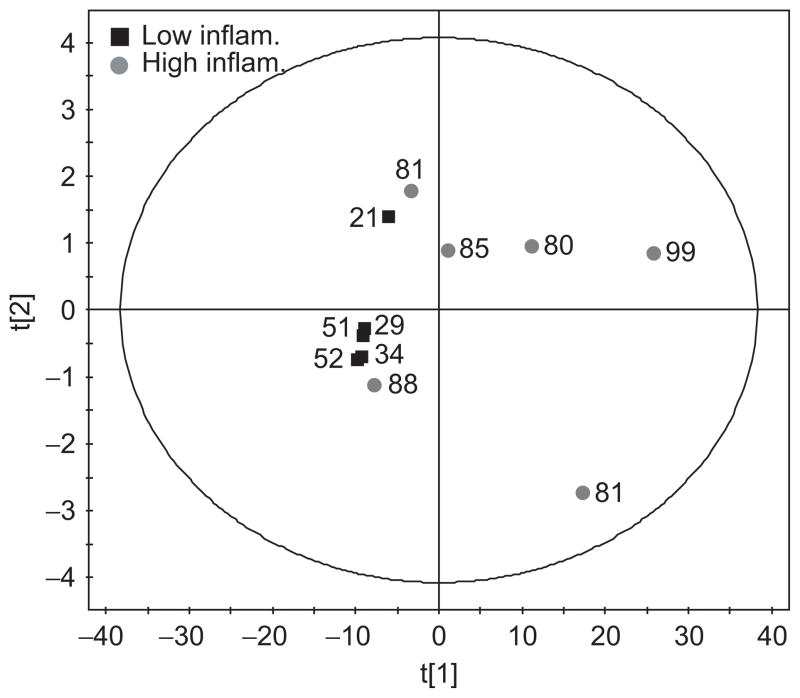
A PCA was performed to examine the correlation of the data with the level of inflammation. In this analysis the biochemical variation in the data is modelled without knowledge of the class membership (i.e. high vs low inflammation) of each sample. The PCA scores plot is shown in Figure 3. Most of the variance was found within the first principal component, which explained 97% of the variance in the data. Spectra from subjects with low inflammation cluster along a narrow region of the first principal component axis whereas the spectra from subjects with higher inflammation span the range from very close to the low-inflammation subjects across to the right of the plot. The points on the PCA plot are annotated with the percentage neutrophil level in the sample and there appears to be little correlation between this value and the separation from the low-inflammation group. In spite of the attempted normalization, two of the spectra from subjects with high inflammation lie close to the low-inflammation group due these samples being very dilute. Vertical expansions of these spectra (not shown) confirm that, in contrast to the spectra from low-inflammation subjects, there are indeed metabolites present, albeit at lower concentrations.
Figure 3.
Principal components analysis scores plot of the spectra from subjects with low inflammation (■) and high inflammation (●). Each point is annotated with the percentage neutrophil level of that sample.
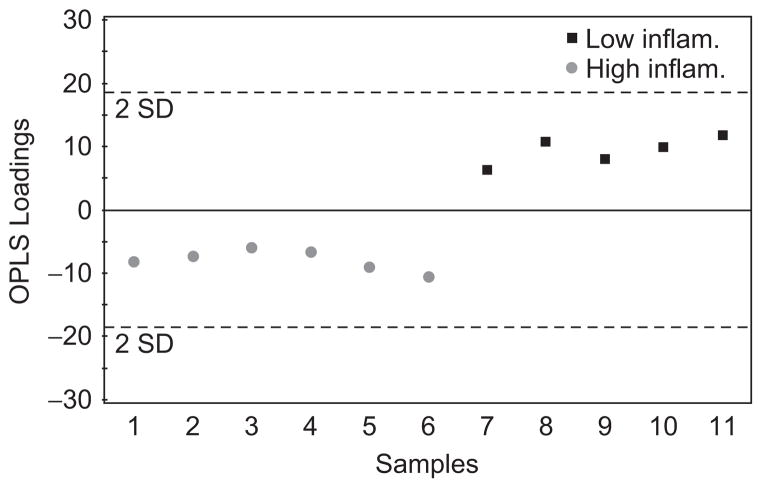
Given the separation of the groups in the PCA model the next question was whether or not a model could be built which could predict the inflammation level based on the NMR spectra. To do this an OPLS model was created. This is a ‘supervised’ model in that the knowledge of class membership is used to create a partial least squares model (PLS) that best explains the variation in the data that is directly correlated to class membership. Figure 4 shows the OPLS scores plot of the data indicating that complete discrimination between the groups was achieved. The R2Y for this model was 96% indicating that the variation in the data is well explained by the model. The Q2 is the percentage of variation of the training set predicted by the model with cross validation. Considering the first two components of the model the Q2 value was 80% indicating very good predictivity. A PLS analysis of the spectral data was carried out to see if a correlation between the neutrophil count or percentage increases could be found, but the models were not statistically valid by virtue of the cross-validation statistics.
Figure 4.
Orthogonal partial least squares (OPLS) scores plot of the spectra from subjects with high and low inflammation. The discrimination between the groups is clear using only the first principal component. All points are within the two standard deviation lines indicative of a good model. Using the first two components the cross-validated R2Y = 96% and the Q2 = 80%.
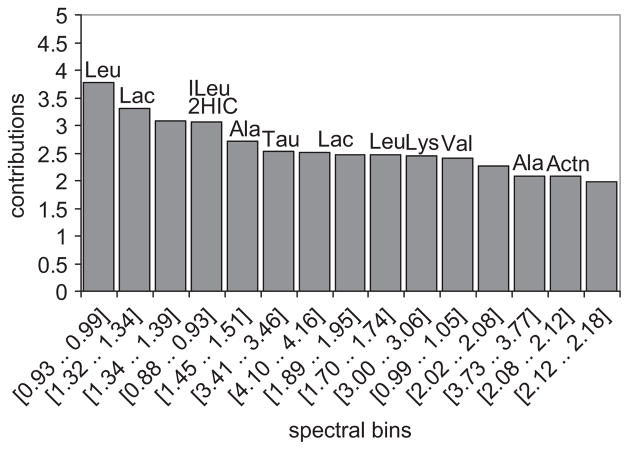
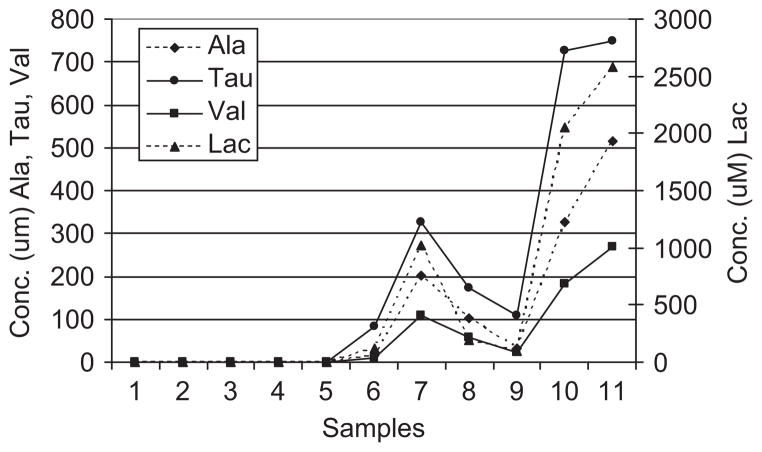
To determine which metabolites were most consistently elevated in the samples from high-inflammation subjects, a scores contributions analysis was performed. The scores contributions are derived from the PCA model and indicate which spectral bins were most significantly different between the spectra from the subjects with low and high inflammation. Figure 5 shows the contributions plot in which the magnitude of the contributions correlates to the importance of that bin to the group separation. The plot is labelled with the metabolites that are present in those bins. To further explore the discriminatory power, we performed quantitative fitting of four metabolites: alanine, valine, taurine and lactate. These metabolites were chosen as they are important to the discrimination and readily quantifiable by virtue of simple multiplet patterns and minimal peak overlap. Each of these metabolites was undetectable in the low-inflammation samples, but easily quantifiable in the high-inflammation samples (Figure 6). These data demonstrate the ability of NMR metabolomics to distinguish high- from low-inflammation samples, even in samples that are more dilute.
Figure 5.
Score contributions plot between the high- and low-inflammation group spectra. This plot provides a ranked list of the 15 most important spectra bins which lead to the distinction between the two groups. Metabolite assignments are as follows: Leu, leucine; Lac, lactate; ILeu, isoleucine; 2HIC, 2-hydroxyisocaprate; Ala, alanine; Val, valine; Actn, acetone. The metabolites in the unlabelled bins are as yet unidentified.
Figure 6.
Quantitative analysis of selected metabolites. The absolute concentrations of four selected metabolites were determined using quantitative spectral fitting. Samples 1–5 are from the low-inflammation group and samples 6–11 are from the high-inflammation group. Ala, alanine; Val, valine; Tau, taurine; Lac, lacate.
Discussion
The most obvious finding in this study was the stark contrast between the number of metabolites present in the spectra of the subjects with high inflammation compared with the subjects with low inflammation. Indeed, a large number of metabolites were present in detectable concentrations exclusively within the high-inflammation group. The lack of a linear correlation between either neutrophil count or percentage increases suggests that once the inflammation reaches a critical level there are abrupt pathophysiological changes that manifest in the more complex metabolite profiles.
Through the use of an unbiased NMR metabolomics analysis we were able to determine that the dominant signals in the BALF from the subjects with high inflammation were in large part derived from amino acids, lactate and acetone. These findings indicate that the inflamed CF airway is highly enriched for amino acids, a conclusion consistent with higher levels of proteolytic activity found in CF airway secretions (Lieberman & Kurnick 1963). Indeed, several studies have shown that proteolytic activity in CF sputum correlates with disease severity (Sagel et al. 2002), and CF sputum contains elevated levels of amino acids that rise with pulmonary exacerbation (Thomas et al. 2000). The fact that much of the discrimination derived from branched-chain amino acids (valine, leucine, isoleucine) is particularly interesting, as previous studies have identified changes in branched-chain amino acid levels with inflammatory states such as sepsis (Freund et al. 1978). However, further exploration of this finding will require analysis of a larger cohort of samples.
Detection of lactate was not surprising, since the lung is known to produce lactate (O’Neil & Tierney 1974), and this metabolite has been previously detected in airway secretions (Effros et al. 2002). Interestingly, our studies suggest that lactate is elevated in the presence of inflammation, consistent with other studies which suggest that lung inflammation triggers an increase in lactate production (De Backer et al. 1997). The increased lactate levels in the high-inflammation group may also reflect the hypoxic environment present in the infected CF lung, with low oxygen concentrations present in the deepest layers of infected airway biofilms (Worlitzsch et al. 2002). As airway epithelia reside at these deepest layers, they are probably forced to rely on anaerobic metabolism for energy, which could result in increased generation of the lactate detected in our samples.
Several other metabolites present at relatively lower concentrations have also been linked to CF airways inflammation. For example, taurine was detected in the spectra from the high-inflammation subjects but not in the spectra from the low-inflammation subjects. While chemically related to amino acids, taurine is not incorporated into proteins and therefore would be not generated by proteolysis. However, taurine does accumulate in the cytoplasm of neutrophils and other leukocytes (Fukuda et al. 1982), and its presence may reflect the presence of these cells in the inflamed airways. Indeed, previous studies have shown that taurine concentrations are elevated in CF sputum and correlate with the severity of inflammation (Witko-Sarsat et al. 1995). Taurine also accumulates intracellularly in airway epithelia and other cell types where it functions to regulate osmotic balance (Musante et al. 1999), and its elevated concentrations within the high-inflammation samples could reflect inflammation-induced osmotic stresses or epithelial cell damage.
The detection and identification of metabolites predicted to be elevated in CF airways inflammation verifies the NMR metabolomic approach. In addition, we also identified several discriminatory signals that could not be definitively assigned to known metabolites. These metabolites could represent novel biomarkers resulting from the complex interplay between the human and bacterial processes that occur within the inflamed CF airway. The detection of signals from such unknown metabolites highlights the value of the untargeted NMR approach to detect potentially new and novel biomarkers. Assigning metabolites to these signals awaits further characterization via higher-resolution NMR techniques.
Although we were able to identify a metabolic signature related to inflammation, we were not able to distinguish whether or not the identified metabolites were of host or microbial origin. There are several challenges to that discrimination, including the heterogeneous population of pathogens in CF airways disease and the fact that many metabolites are not unique to either the host or microbial metabolome. Indeed, the host–microbial interactions are so complex in CF, it is probable that animal model studies with defined pathogens will be necessary to identify specific biomarkers that correlate with either defined pathogens or human inflammatory responses.
The results from this study demonstrate that distinct changes in the metabolite profiles of airway fluid occur in subjects with low versus high level of airway inflammation. In the future, such changes in metabolite profiles may be detectable in less-invasive airway samples such as exhaled breath condensate. Indeed, a recent metabolomics analysis of exhaled breath condensate showed its potential for clinical diagnosis of asthma (Carraro et al. 2007), and such studies may be applicable for evaluation of CF airways disease. These results not only establish the value of NMR as a diagnostic modality itself, but also demonstrate the potential for NMR analyses to identify established and novel biomarkers for further investigation.
Acknowledgments
C.R.E. was supported by the North Carolina Program for Translational Science and the Cystic Fibrosis Foundation (ESTHER07G0). The metabolomics studies were supported in part by the General Clinical Research Center Grant RR000046 from the National Institutes of Health and a grant from the National Institute of Environmental Health Sciences (P30ES10126).
Footnotes
Declaration of interest: The authors report no conflicts of interest.
References
- Anderson JC, Lamm WJE, Hlastala MP. Measuring airway exchange of endogenous acetone using a single-exhalation breathing maneuver. J Appl Physiol. 2006;100:880–889. doi: 10.1152/japplphysiol.00868.2005. [DOI] [PubMed] [Google Scholar]
- Azmi J, Connelly J, Holmes E, Nicholson JK, Shore RF, Griffin JL. Characterization of the biochemical effects of 1-nitronaphthalene in rats using global metabolic profiling by NMR spectroscopy and pattern recognition. Biomarkers. 2005;10:401–416. doi: 10.1080/13547500500309259. [DOI] [PubMed] [Google Scholar]
- Carraro S, Rezzi S, Reniero F, Heberger K, Giordano G, Zanconato S, Guillou C, Baraldi E. Metabolomics applied to exhaled breath condensate in childhood asthma. Am J Respir Crit Care Med. 2007;175:986–990. doi: 10.1164/rccm.200606-769OC. [DOI] [PubMed] [Google Scholar]
- Connor S, Everett J, Nicholson JK. Spin-echo proton NMR spectroscopy of urine samples. Water suppression via a urea-dependent T2 relaxation process. Magn Reson Med. 1987;4:461–470. doi: 10.1002/mrm.1910040507. [DOI] [PubMed] [Google Scholar]
- De Backer D, Creteur J, Zhang H, Norrenberg M, Vincent J-L. Lactate production by the lungs in acute lung injury. Am J Respir Crit Care Med. 1997;156:1099–1104. doi: 10.1164/ajrccm.156.4.9701048. [DOI] [PubMed] [Google Scholar]
- Effros RM, Hoagland KW, Bosbous M, Castillo D, Foss B, Dunning M, Gare M, Lin W, Sun F. Dilution of respiratory solutes in exhaled condensates. Am J Respir Crit Care Med. 2002;165:663–669. doi: 10.1164/ajrccm.165.5.2101018. [DOI] [PubMed] [Google Scholar]
- Freund HR, Ryan JA, Jr, Fischer JE. Amino acid derangements in patients with sepsis: treatment with branched chain amino acid rich infusions. Ann Surg. 1978;188:423–430. doi: 10.1097/00000658-197809000-00017. [DOI] [PMC free article] [PubMed] [Google Scholar]
- Fukuda K, Hirai Y, Yoshida H, Nakajima T, Usui T. Free amino acid content of lymphocytes and granulocytes compared. Clin Chem. 1982;28:1758–1761. [PubMed] [Google Scholar]
- Lieberman J, Kurnick NB. Proteolytic enzyme activity and the role of deoxyribose nucleic acid (DNA) in cystic fibrosis sputum. Pediatrics. 1963;31:1028–1032. [PubMed] [Google Scholar]
- Muhlebach MS, Stewart PW, Leigh MW, Noah TL. Quantitation of inflammatory responses to bacteria in young cystic fibrosis and control patients. Am J Respir Crit Care Med. 1999;160:186–191. doi: 10.1164/ajrccm.160.1.9808096. [DOI] [PubMed] [Google Scholar]
- Musante L, Zegarra-Moran O, Montaldo PG, Ponzoni M, Galietta LJ. Autocrine regulation of volume-sensitive anion channels in airway epithelial cells by adenosine. J Biol Chem. 1999;274:11701–11707. doi: 10.1074/jbc.274.17.11701. [DOI] [PubMed] [Google Scholar]
- Nicholson JK, Lindon JC, Holmes E. ‘Metabonomics’: understanding the metabolic responses of living systems to pathophysiological stimuli via multivariate statistical analysis of biological NMR spectroscopic data. Xenobiotica. 1999;29:1181–1189. doi: 10.1080/004982599238047. [DOI] [PubMed] [Google Scholar]
- O’Neil JJ, Tierney DF. Rat lung metabolism: glucose utilization by isolated perfused lungs and tissue slices. Am J Physiol. 1974;226:867–873. doi: 10.1152/ajplegacy.1974.226.4.867. [DOI] [PubMed] [Google Scholar]
- Rosenstein BJ, Cutting GR. The diagnosis of cystic fibrosis: a consensus statement. Cystic Fibrosis Foundation Consensus Panel. J Pediatr. 1998;132:589–595. doi: 10.1016/s0022-3476(98)70344-0. [DOI] [PubMed] [Google Scholar]
- Rowe SM, Miller S, Sorscher EJ. Cystic fibrosis. N Engl J Med. 2005;352:1992–2001. doi: 10.1056/NEJMra043184. [DOI] [PubMed] [Google Scholar]
- Sagel SD. Noninvasive biomarkers of airway inflammation in cystic fibrosis. Curr Opin Pulm Med. 2003;9:516–521. doi: 10.1097/00063198-200311000-00012. [DOI] [PubMed] [Google Scholar]
- Sagel SD, Sontag MK, Wagener JS, Kapsner RK, Osberg I, Accurso FJ. Induced sputum inflammatory measures correlate with lung function in children with cystic fibrosis. J Pediatr. 2002;141:811–817. doi: 10.1067/mpd.2002.129847. [DOI] [PubMed] [Google Scholar]
- Serkova NJ, Niemann CU. Pattern recognition and biomarker validation using quantitative 1H-NMR-based metabolomics. Expert Rev Mol Diagn. 2006;6:717–731. doi: 10.1586/14737159.6.5.717. [DOI] [PubMed] [Google Scholar]
- Thomas SR, Ray A, Hodson ME, Pitt TL. Increased sputum amino acid concentrations and auxotrophy of Pseudomonas aeruginosa in severe cystic fibrosis lung disease. Thorax. 2000;55:795–797. doi: 10.1136/thorax.55.9.795. [DOI] [PMC free article] [PubMed] [Google Scholar]
- Witko-Sarsat V, Delacourt C, Rabier D, Bardet J, Nguyen AT, Descamps-Latscha B. Neutrophil-derived long-lived oxidants in cystic fibrosis sputum. Am J Respir Crit Care Med. 1995;152:1910–1916. doi: 10.1164/ajrccm.152.6.8520754. [DOI] [PubMed] [Google Scholar]
- Worlitzsch D, Tarran R, Ulrich M, Schwab U, Cekici A, Meyer KC, Birrer P, Bellon G, Berger J, Weiss T, et al. Effects of reduced mucus oxygen concentration in airway Pseudomonas infections of cystic fibrosis patients. J Clin Invest. 2002;109:317–325. doi: 10.1172/JCI13870. [DOI] [PMC free article] [PubMed] [Google Scholar]


