

Abstract
Regulatory T cells (Treg) are important regulators of anti-cancer immune responses, and an increase in Treg frequency was observed in the blood of cancer patients. Blood samples from 112 patients with head and neck squamous cell carcinoma antigen (HNSCC) were obtained at the time of tumour diagnosis, and lymphocyte subpopulations (CD3+; CD3−CD16+CD56+; CD4+; CD8+; CD19+; CD4+CD45RA+) with emphasis on Treg counts (CD3+CD4+CD25+), complete blood count and tumour markers (squamous cell carcinoma [SCC]; CEA; α-1-antitrypsin [AAT]; Cyfra 21–1; C-reactive protein [CRP]) were analysed. The data were grouped according to TNM classification, and their significance for the course of the disease at an interval of 1 year after the end of the therapy was determined. The percentage of CD8+ cells increased and the CD/D8 ratio decreased with tumour grade. The ratio of B lymphocytes decreased in patients with locoregional metastases (11.25%versus 9.22%). Treg (15.2%) and CD4+ cells (45.3%) increased, while NK cells (11.8%) decreased in HNSCC patients compared to controls (9.0%, 38.1% and 15.8%, respectively). The data obtained at time of diagnosis were used to assess the significance of tumour markers (SCC, Cyfra 21–1 and AAT) for evaluation of prognosis. The erythrocyte counts (4.64 × 10¹²/l versus 4.45 × 10¹²/l) and haemoglobin levels (14.58 g/dl versus 14.05 g/dl) decreased, while Treg counts (8.91%versus 15.70%) increased in patients with early recurrence. Our results show that examination of these parameters could be helpful for prognostication in HNSCC patients and aid improvement of treatment strategy.
Keywords: regulatory T cells, head and neck squamous cell carcinoma, tumour markers, early recurrence, lymphocyte subpopulations
Introduction
Regulatory T lymphocytes (Treg) represent one of the most important mechanisms of peripheral immune tolerance, which is employed to safeguard any over-activations of the immune system. It has been shown that interleukin (IL)-2 is vital for growth and differentiation of Treg [1]. It is worth noting that surface expression of the IL-2 receptor α, CD25, is not unique for Treg, and that activated conventional T cells also express CD25. Nonetheless, Treg represent a major population within the CD4+CD25hi T cells repertoire in healthy individuals.
Transcriptional factor forkhead box P3 (Foxp3) is absolutely essential for Treg development. It is also the ‘master regulator’ of their regulatory functions. Furthermore, high levels of Foxp3 expression were found almost exclusively amidst the CD4+CD25+ compartment of thymocytes and peripheral Treg [2–6].
It is now known that Tregs play a critical role in the induction of tolerance to self-antigens, including those expressed by tumours. Recently, published findings have shown that immune regulation mediated by Treg, which is vital for preventing autoimmunity, represents a mechanism whereby the efficient antitumour response is inhibited [4, 7].
It was described that Treg frequency is increased in the peripheral circulation of patients with different types of tumours, and their accumulation in the tumour microenvironment may be a negative prognostic factor for some types of malignancies [8–11]. An increase in the number of T-regulatory lymphocytes in the peripheral circulation and at the tumour site has also been shown to correlate with progression of head and neck squamous cell carcinoma (HNSCC) [12–14].
Not only does increase in T-regulatory cell number interfere with the antitumour immune response, but at the same time, Treg cells may be the main obstacle undermining anti-cancer immunotherapy and active vaccination [15, 16].
Although significant advances in the treatment regimen for patients with HNSCC have been documented within the last 20 years, regrettably, survival rates for this disease have not improved for many years [17].
Thus, the development of new molecular markers, which could help to describe the biological and immunological status of patients and predict disease progression, may help with selecting the appropriate treatment modalities for individual patients [18–21].
Patients and methods
HNSCC patients
All patients diagnosed at the Department of Otorhinolaryngology and Head and Neck Surgery, 1st Faculty of Medicine, Charles University, University Hospital Motol with HNSCC without any previous oncological treatment between 2004 and 2006, and who were willing to participate in the study and sign the informed consent, were included in the study (n = 112; 97 males; 15 females; a median age of 59 years; range of 23–87 years). Samples of peripheral blood were obtained from each patient at the time of diagnosis. No other selection criteria in addition to those given above were applied. Patients subsequently underwent therapy with curative intent. Details of patient characteristics are shown in Table 1.
Table 1.
Patient characteristics
| Age | [Years] |
|---|---|
| Median age | 59 |
| Range | 23–87 |
| Sex | [n] |
| Male | 97 |
| Female | 15 |
| Total | 112 |
| Tumour site | |
| Oropharynx – base of tongue | 24 (21%) |
| Oropharynx – tonsillar region* | 41 (37%) |
| Hypopharynx | 13 (12%) |
| Larynx | 19 (17%) |
| Others ** | 15 (13%) |
| Tumour differentiation | |
| Poor (G 3–4) | 39 (35%) |
| Moderate (G 2) | 39 (35%) |
| Well (G 1) | 25 (22%) |
| Not determined | 9 (8%) |
| Tumour stage | |
| T1 | 17 (15%) |
| T2 | 37 (33%) |
| T3 | 34 (30%) |
| T4 | 21 (19%) |
| Unstaged | 3 (3%) |
| Nodal status | |
| N0 | 38 (34%) |
| N1 | 17 (15%) |
| N2 | 50 (45%) |
| N3 | 7 (6%) |
| M stage | |
| M0 | 112 |
| M1 | 0 |
| Unstaged | 0 |
| Therapy after blood draw | |
| Surgery | 14 (13%) |
| Surgery + radiotherapy | 63 (56%) |
| Radiotherapy | 27 (24%) |
| Radiochemotherapy | 8 (7%) |
| Smoking history | |
| Non-smoker | 18 (16%) |
| With history of smoking | 94 (84%) |
| Active (still smoking) | 52 (46%) |
| Former (denied smoking at time of diagnosis) | 42 (38%) |
| Alcohol history | |
| Total abstinence | 0 (0%) |
| Daily alcohol consumption | 31 (28%) |
Oropharynx – tonsillar region: tumours involving tonsillar region alone or with spread to the tonsillar pillars, soft palate or posterior wall of oropharynx
*Others: heterogeneous group of tumour localization – 4× carcinoma of the nasopharynx, 3× carcinoma of the nasal cavity, 3× carcinoma of the paranasal sinuses, 3× metastatic carcinoma with unknown primary localization, 2× carcinoma of the external auditory canal
Healthy volunteers – blood donors
Control samples of peripheral blood were obtained from 20 healthy volunteers (blood donors) comprising 12 males and 8 females with a median age of 58 years (range 23–68 years). All controls were examined at the Department of Hematology and Blood transfusion, Hospital of Rudolf and Stephania, Benesov.
All participants signed the informed consent approved by the Ethics Committee of the 2nd Medical Faculty of Charles University and University Hospital Motol.
Flow cytometry
Samples of peripheral blood were analysed by flow cytometry (FACSCalibur, BD, San Jose, CA, USA) after lysis of erythrocytes by FACS Lysing Solution (BD, San Jose, CA, USA) and staining with antibody-fluorochrome conjugates. We strictly adhered to instructions in the manufacturer’s protocol for respective reagents. Antibodies anti-CD45 FITC/CD14 PE (to correctly set the gates for lymphocytes), anti-CD3 FITC/CD19 PE, anti-CD3 FITC/ CD16CD56 PE, anti-CD4 FITC/ CD8 PE, anti-CD45RA FITC/anti-CD4 PE and anti-CD3 FITC/ CD4 PE/CD25 APC (Beckmann Coulter, Nyon, Switzerland) were used. A total of 10,000 cells in the lymphocyte gate were acquired for analysis and the data were analysed with CellQuest software. Results are expressed as the percentage of respective cell subpopulations of all lymphocytes.
Total blood count and biochemical and tumour makers were examined in the Department of Clinical Haematology and Institute for Clinical Biochemistry and Pathological Biochemistry, University Hospital Motol, according to standard protocols.
Statistical analysis
In order to analyse the relationship between the different categories studied, the data were evaluated using a frequency 2 × 2 table chi-square test with Danderar’s correction. All numerical data were presented as mean ± S.D., and were analysed statistically using Student’s t-test. The correlations between immunological parameters and early recurrence of disease were evaluated by nonparametric Spearman’s coefficient. P-values of less than 0.05 were considered significant. SPSS Software version 10.1 was used for all statistical calculations.
Results
We examined the peripheral blood of 112 patients with HNSCC. Blood samples were taken before the commencement of antitumour therapy. We focused on evaluation of lymphocyte subpopulations (CD3+; CD3−CD16+CD56+; CD4+; CD8+; CD19+; CD4+CD45RA+; CD3+CD4+CD25+), complete blood count and several tumour markers (SCC; CEA; AAT; Cyfra 21–1; CRP).
The levels of Treg and other lymphocyte populations were compared between HNSCC patients and those of healthy blood donors.
The absolute number of CD3+ lymphocytes in the group of HNSCC patients was 2.02 × 10⁹/l ± 0.67. The percentage of circulating CD3+CD4+CD25+ and CD4+ (Fig. 1A and B) cells significantly increased (both P < 0.01) in patients with HNSCC (15.2%± 8.9 and 45.3 ± 9.6, respectively) in comparison with values from the control group (9.0 ± 4.3 and 38.1 ± 5.9, respectively) at time of diagnosis. There was no significant difference (P= 0.05) in ratios of either total T lymphocytes (CD3+; 72.1%versus 65.8%) or effector T lymphocytes (CD8+; 28.0%versus 28.4%). On the other hand, naïve T lymphocytes (CD4+45RA+; 14.7%versus 18.0%), B lymphocytes (CD3−CD19+; 9.8%versus 11.1%) and NK cells decreased in HNSCC patients, but only the decrease of NK cells was statistically significant (CD3−CD16+CD56+; 11.8%± 6.5 versus 15.8%± 6.8; P < 0.05) (Fig. 1C).
Fig 1.
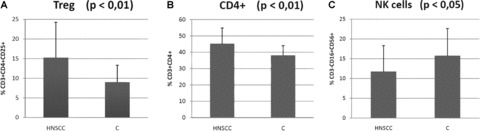
Comparison of Treg and other lymphocyte subpopulations in patients with HNSCC (head and neck squamous cell carcinoma) with those of healthy blood donors (C). (A) – regulatory T lymphocytes (CD3+CD4+CD25+); (B) – Th cells (CD3+CD4+); (C) – natural killers (CD3- CD16+CD56+).
The study included patients with tumours localized in different regions of the head and neck (Table 1). Despite the fact that all patients showed uniformly increased levels of Treg, we were able to provide further evidence for differences within patient groups based on the localization of primary tumour (oropharynx – tonsillar region 16.2% CD3+CD4+CD25+; oropharynx – base of the tongue 15.2% CD3+CD4+CD25+; hypopharynx 15.2% CD3+CD4+CD25+; larynx 15.0% CD3+CD4+CD25+; other localizations 12.9% CD3+CD4+CD25+). The differences between patients with tumours of the oropharynx – base of tongue and hypopharynx were statistically significant in several variables. The levels of tumour marker α-1-antitrypsin (AAT; 1.45 ± 0.32 g/l versus 1.8 ± 0.35 g/l; P= 0.008) and levels of platelets (PLT; 225.4 ± 61.54 versus 317.1 ± 93.95 × 10⁹/l; P= 0.047) in patients with tumours of the hypopharynx were higher. (There was no statistically significant difference between T- and N stages, and tumour differentiation grading, but there was a difference in distribution by gender: no females presented with tumour of the oropharynx – base of tongue, while three females presented with tumour of the hypopharynx.)
Relevance of Treg levels in relation to the stage of TNM classification was also evaluated. Patient groups were divided according to the size of the primary tumour (T1 to T4 stage), and the spread of tumour to the regional lymphatic nodes (N stage; N°versus N+) according to the standards of International Classification of Diseases for Oncology (ICD-O-3, 2000).
All stages (T1 – T4) were individually compared, and no significant differences in Treg were observed (14.77%versus 17.16%versus 13.91%versus 14.91%). There was however a statistically significant increase in the tumor marker SCC (SCC; 0.65 μg/l versus 0.78 μg/l versus 1.29 μg/l versus 1.76 μg/l; P= 0.0002); the ratio of naïve T lymphocytes (12.38%versus 12.05%versus 16.08%versus 19.49%) and the levels of C-reactive protein (CRP; 3.56 mg/l versus 10.18 mg/l versus 14.93 mg/l versus 20.49 mg/l; P= 0.008) (Fig. 2).
Fig 2.
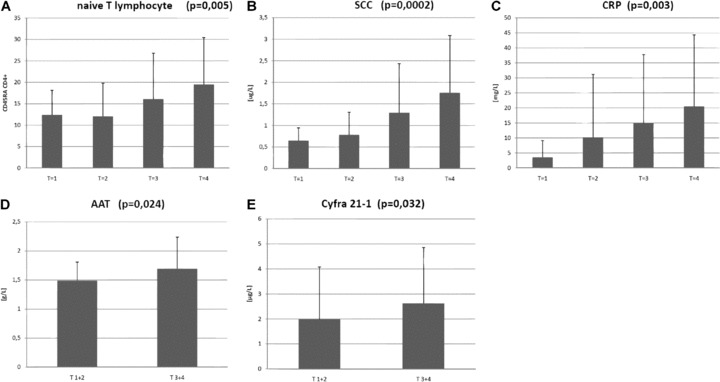
Statistically significant parameters that are in a positive correlation with the size of the tumour (T stage). (A) – naïve T lymphocytes (CD45RA+CD4+); (B) – SCC = squamous cell carcinoma antigen; (C) – CRP = C-reactive protein; (D) – AAT =α-1-antitrypsin; (E) – Cyfra 21–1.
When we combined results for both T1 and T2 stages, and T3 plus T4 stages, and compared T/versus T/, we found an increase of other two tumour markers in advanced stage patients, in particular, AAT (1.49 g/l versus 1.69 g/l; P= 0.024) and Cyfra-21–1 (1.99 μg/l versus 2.62 μg/l; P= 0.032) (Fig. 2).
The levels of tumour marker Cyfra-21–1 and CRP were higher in the N+ group than in the N0 group (1.39 μg/l versus 2.78 μg/l; P= 0.00004, respectively, 5.29 versus 16.18; P= 0.023). The percentage of B cells (CD3–19+) was significantly lower in the group of patients with locoregional metastases than in those patients with N0 stage disease (11.25%versus 9.22%; P= 0.019) (Fig. 3).
Fig 3.
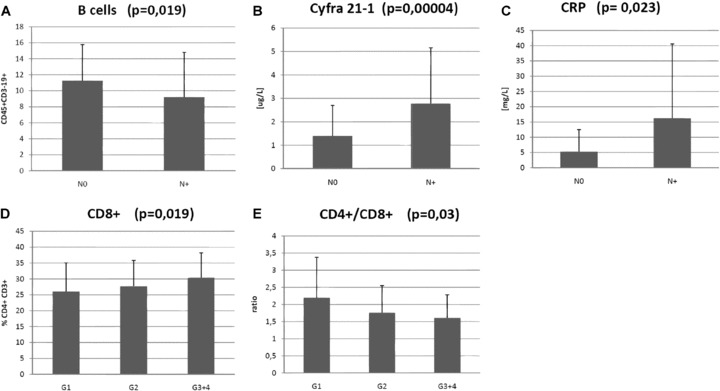
Statistically significant parameters that are in a correlation with the spread of tumour to the regional lymphatic nodes (N stage) and with differentiation of tumour cells (Grade). (A) – B cells (CD45+CD3-CD19+); (B) – Cyfra 21–1; (C) – CRP = C-reactive protein; (D) – Tc cells (CD3+ CD8+); (E) – ratio CD4+/CD8+.
Levels of Treg were evaluated based on differentiation of tumour cells according to histological grading (G stage, G1 versus G2 versus G3+4). There were no significant differences in levels of Treg (14.85%versus 15.84%versus 14.25%). In other subgroups of lymphocytes, differences in levels of cytotoxic T lymphocytes (CD8+; 26.04%versus 27.69%versus 30.41%; P= 0.019) and in CD/D8 ratio were observed (2.20 versus 1.76 versus 1.61; P= 0.03) (Fig. 3).
The group of patients with recurrent disease was compared with the group without evidence of the disease at an interval of 1 year after the end of the therapy. All of the following results were statistically significant: increase in levels of Treg (8.91%versus 15.70%; P= 0.044); increase in AAT (1.51 g/l versus 1.71 g/l; P= 0.006); decrease of erythrocyte count (4.64 × 10¹²/l versus 4.45 × 10¹²/l; P= 0.038) and increase in haemoglobin levels (14.58 g/dl versus 14.05 g/dl; P= 0.022) (Fig. 4).
Fig 4.
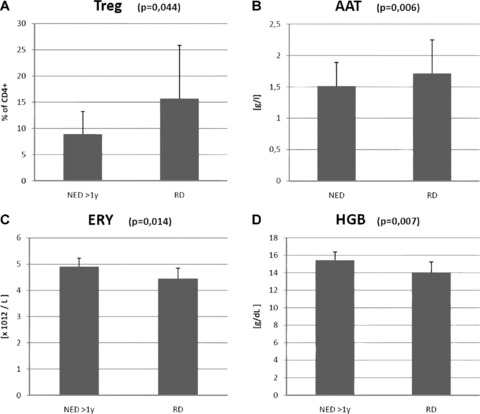
Comparison between groups of patients with recurrent disease (RD) and those without evidence of disease (NED) over a follow-up interval longer than 1 year. (A) – regulatory T lymphocytes (CD3+CD4+CD25+); (B) – AAT =α-1-antitrypsin; (C) – ERY = count of erythrocyte; (D) – HBG = haemoglobin level.
Discussion
It has been published that clinical prognosis of oncological patients is correlated with numerous changes in the peripheral blood. Furthermore, it has been proven that the poor prognosis of HNSCC patients is associated with cancer cachexia, T status, increased C-reactive protein and decreased haemoglobin levels [22]. In agreement with these findings, we have demonstrated a statistically significant difference in haemoglobin level and erythrocyte count between the group of patients without evidence of disease, and the group with cancer relapse.
The advantages of examining tumour markers for improvement of the clinical management of HNSCC have been discussed for many years, yet none of these markers have been found to be exclusively predictive. Hepatocyte growth factor, which correlates highly with tumour progression, and may be a strong predictor of HNSCC recurrence, has recently been reported as being quite promising [23]. It has been published that combined analysis of SCC and CEA leads to both a markedly increased sensitivity at primary diagnosis, and as a predictor of tumour relapse [24]. Our study demonstrates that serum levels of SCC, CRP, Cyfra 21–1 and AAT correlate with T stage of disease, and that serum levels of Cyfra 21–1 and CRP correlate with N stage.
Treg (CD4+CD25+FoxP3+), which are a subset of CD4+ cells, have considerable importance within the immunological homeostatic network. These cells possess suppressive activity against CD8+ effector and CD4+ helper T cells. The mechanism of suppression is still unclear and the subject of controversial debate [25–27]. An increase in T-regulatory cells in the peripheral circulation and at the tumour site was previously reported in patients with HNSCC, and these results seem to be in agreement with the majority of published data for other human cancers [8, 12, 28–30]. In addition, a positive association with infiltration by Treg and better locoregional control of the tumour or longer disease-free interval was also reported [31].
The data for this study were collected over more than 3 years, and initially, there was no readily available monoclonal antibody against Foxp3. We have therefore analysed the CD3+CD4+CD25+ cell population, which consists predominantly of regulatory T-cells.
Previous studies have indicated that patients with HNSCC have altered lymphocyte homeostasis, which persists for months or years after curative therapies [32, 33].
NK cells play one of the pivotal roles in antitumour immunity. Recently, it was published that NK cell numbers are reduced in the peripheral blood of cancer patients, and that a severe deficiency in circulating NK cells was related to the poor clinical outcome in HNSCC patients [34]. Our data confirmed these results. We found a significantly decreased proportion of NK cells in HNSCC patients compared with controls.
Other studies have reported that patients with HNSCC have significantly lower absolute numbers of CD3+, CD4+ and CD8+ T cells, but no differences in the percentages of T-cell subsets between patients and controls were observed [33, 35]. We did not observe any significant differences either in the absolute number of CD3+T cells or in percentages of T-cell subsets. Furthermore, Kuss et al.[32] described a decrease in absolute numbers of CD3+ and CD4+ (P= 0.06), and an increase in absolute numbers of CD8+ (P= 0.95) in the peripheral circulation of patients with recurrent HNSCC within 2 years after therapy. Kim et al. suggested that such altered homeostasis in CD8+ T cells in these patients is prevented as a consequence of cancer induced functional abnormalities and abnormal lymphocyte turnover [36]. Our data indicate that this alteration, which was first reported in patients who completed the course of therapy [32], could be inherent for HNSCC patients, as a significant increase of CD8+ T cells in patients with recurrent HNSCC (compared to NED patients) was demonstrated as early as at the time of diagnosis.
Moreover, we found that the significant increase in CD8+ subsets in patients directly correlated with the level of tumour cell differentiation, i.e. histological grading (Grading, G1 versus G2 versus G3+4). Similarly, a decrease in the CD/D8 ratio was found.
However, the exact relationship of elevated CD8+ cells (and changes in CD/D8 homeostasis, respectively) with disease progression is still not clear, and should be investigated in future studies.
Excessive peritumoural infiltration of B cells (CD19+) has been recently described, and a higher percentage of CD19+ cells were predictive of poor survival in patients with ovarian carcinoma [37]. We identified a lower level of B cells (CD3−CD19+) in the group of patients with locoregional metastases compared with patients in the N0 stage. The explanation for this could be that the B cells are chemotactically attracted to the microenvironment of the tumour and metastases [38].
Tumour production of growth factors and the immunological reaction within the tumour microenvironment causes mobilization of precursor cells with subsequent migration to the periphery and tumour site [39]. In agreement with the previously published data we found a statistically significant positive correlation with the T stage and percentage of naïve T lymphocytes.
In this study, we focused on the quantity of Treg in the peripheral blood of patients with head and neck cancer, and compared this data with controls in an effort to assess their prognostic importance for early recurrence of disease.
First, an increased percentage of circulating CD4+CD25+ T cells in the peripheral blood in patients with HNSCC was observed, which is in agreement with previously reported data [8, 9, 12–14]. All hitherto published data have shown that the total amount of Treg in the peripheral circulation of HNSCC is two-fold higher than in controls, although the exact numbers are slightly different among the different laboratories [12, 13].
In the 2-year long follow-up interval, we compared the group of patients with early recurrence of disease with the disease-free group. We found a striking difference in the levels of Treg at the time of primary diagnosis between patients in remission and in recurrence. The levels of Treg in the peripheral blood correlate with a higher probability of early recurrence of HNSCC. This finding helped us to select patients eligible for more extensive therapy and more meticulous follow-up.
In conclusion, it was observed that the percentage of CD8+ cells increased and CD/D8 ratio decreased with tumour grade. B lymphocyte proportion decreased in patients with locoregional metastases (N+ stage). Treg (CD3+CD4+CD25+) and CD4+ cells increased, while NK cells decreased in HNSCC patients compared to healthy controls. Based on the data obtained at the time of primary diagnoses, we assessed the significance of tumour markers (SCC, Cyfra 21–1 and AAT) for evaluation of prognosis of HNSCC patients. The erythrocyte count and haemoglobin level decreased, while the Treg increased in the group of patients with early recurrence of the disease. One may speculate that erythrocyte count, haemoglobin level and regulatory T-cell proportion may be useful as predictive factors in HNSCC.
Acknowledgments
The research was supported by the Internal Grant Agency of the Czech Ministry of Health (grant NR 8883–3), by the Ministry of Education, Youth and Sports of The Czech Republic (Grant MSM 0021620813 and No. 1M0505) and by Institutional Research Concept AV0Z50200510.
References
- 1.Groux H. Type 1 T-regulatory cells: their role in the control of immune responses. Transplantation. 2003;75:8S–12S. doi: 10.1097/01.TP.0000067944.90241.BD. [DOI] [PubMed] [Google Scholar]
- 2.Carrier Y, Yuan J, Kuchroo VK, et al. Th3 cells in peripheral tolerance. I. Induction of Foxp3-positive regulatory T cells by Th3 cells derived from TGF-beta T cell-transgenic mice. J Immunol. 2007;178:179–85. doi: 10.4049/jimmunol.178.1.179. [DOI] [PubMed] [Google Scholar]
- 3.Ladi E, Yin X, Chtanova T, et al. Thymic microenvironments for T cell differentiation and selection. Nature Immunol. 2006;7:338–43. doi: 10.1038/ni1323. [DOI] [PubMed] [Google Scholar]
- 4.Randolph DA, Fathman CG. CD4 + CD25+ regulatory T cells and their therapeutic potential. Ann Rev Med. 2006;57:381–402. doi: 10.1146/annurev.med.57.121304.131337. [DOI] [PubMed] [Google Scholar]
- 5.Sakaguchi S. Naturally arising Foxp3-expressing CD25+CD4+ regulatory T cells in immunological tolerance to self and non-self. Nature Immunol. 2005;6:345–52. doi: 10.1038/ni1178. [DOI] [PubMed] [Google Scholar]
- 6.Campbell DJ, Ziegler SF. FOXP3 modifies the phenotypic and functional properties of regulatory T cells. Nature Rev. 2007;7:305–10. doi: 10.1038/nri2061. [DOI] [PubMed] [Google Scholar]
- 7.Gallimore A, Godkin A. Regulatory T cells and tumour immunity – observations in mice and men. Immunology. 2008;123:157–63. doi: 10.1111/j.1365-2567.2007.02748.x. [DOI] [PMC free article] [PubMed] [Google Scholar]
- 8.Curiel TJ, Coukos G, Zou L, et al. Specific recruitment of regulatory T cells in ovarian carcinoma fosters immune privilege and predicts reduced survival. Nature Med. 2004;10:942–9. doi: 10.1038/nm1093. [DOI] [PubMed] [Google Scholar]
- 9.Wolf AM, Wolf D, Steurer M, et al. Increase of regulatory T cells in the peripheral blood of cancer patients. Clin Cancer Res. 2003;9:606–12. [PubMed] [Google Scholar]
- 10.Woo EY, Chu CS, Goletz TJ, et al. Regulatory CD4(+)CD25(+) T cells in tumors from patients with early-stage non-small cell lung cancer and late-stage ovarian cancer. Cancer Res. 2001;61:4766–72. [PubMed] [Google Scholar]
- 11.Strauss L, Bergmann C, Whiteside TL. Functional and phenotypic characteristics of CD4+CD25highFoxp3+ Treg clones obtained from peripheral blood of patients with cancer. Int J Cancer. 2007;121:2473–83. doi: 10.1002/ijc.23001. [DOI] [PubMed] [Google Scholar]
- 12.Schaefer C, Kim GG, Albers A, et al. Characteristics of CD4+CD25+ regulatory T cells in the peripheral circulation of patients with head and neck cancer. Br J Cancer. 2005;92:913–20. doi: 10.1038/sj.bjc.6602407. [DOI] [PMC free article] [PubMed] [Google Scholar]
- 13.Strauss L, Bergmann C, Gooding W, et al. The frequency and suppressor function of CD4+ CD25highFoxp3+ T cells in the circulation of patients with squamous cell carcinoma of the head and neck. Clin Cancer Res. 2007;13:6301–11. doi: 10.1158/1078-0432.CCR-07-1403. [DOI] [PubMed] [Google Scholar]
- 14.Alhamarneh O, Amarnath SM, Stafford ND, et al. Regulatory T cells: what role do they play in antitumor immunity in patients with head and neck cancer. Head Neck. 2008;30:251–61. doi: 10.1002/hed.20739. [DOI] [PubMed] [Google Scholar]
- 15.Whiteside TL. Anti-tumor vaccines in head and neck cancer: targeting immune responses to the tumor. Curr Cancer Drug Targets. 2007;7:633–42. doi: 10.2174/156800907782418310. [DOI] [PubMed] [Google Scholar]
- 16.Karcher J, Dyckhoff G, Beckhove P, et al. Antitumor vaccination in patients with head and neck squamous cell carcinomas with autologous virus-modified tumor cells. Cancer Res. 2004;64:8057–61. doi: 10.1158/0008-5472.CAN-04-1545. [DOI] [PubMed] [Google Scholar]
- 17.Forastiere A, Koch W, Trotti A, et al. Head and neck cancer. N Eng J Med. 2001;345:1890–900. doi: 10.1056/NEJMra001375. [DOI] [PubMed] [Google Scholar]
- 18.Plzak J, Betka J, Smetana K, Jr, et al. Galectin-3 – an emerging prognostic indicator in advanced head and neck carcinoma. Eur J Cancer. 2004;40:2324–30. doi: 10.1016/j.ejca.2004.06.025. [DOI] [PubMed] [Google Scholar]
- 19.Nestor M, Ekberg T, Dring J, et al. Quantification of CD44v6 and EGFR expression in head and neck squamous cell carcinomas using a single-dose radioimmunoassay. Tumour Biol. 2007;28:253–63. doi: 10.1159/000110898. [DOI] [PubMed] [Google Scholar]
- 20.Harper LJ, Piper K, Common J, et al. Stem cell patterns in cell lines derived from head and neck squamous cell carcinoma. J Oral Pathol Med. 2007;36:594–603. doi: 10.1111/j.1600-0714.2007.00617.x. [DOI] [PubMed] [Google Scholar]
- 21.Cada Z, Boucek J, Dvorankova B, et al. Nucleostemin expression in squamous cell carcinoma of the head and neck. Anticancer Res. 2007;27:3279–84. [PubMed] [Google Scholar]
- 22.Richey LM, George JR, Couch ME, et al. Defining cancer cachexia in head and neck squamous cell carcinoma. Clin Cancer Res. 2007;13:6561–7. doi: 10.1158/1078-0432.CCR-07-0116. [DOI] [PubMed] [Google Scholar]
- 23.Kim CH, Lee JS, Kang SO, et al. Serum hepatocyte growth factor as a marker of tumor activity in head and neck squamous cell carcinoma. Oral Oncology. 2007;43:1021–5. doi: 10.1016/j.oraloncology.2006.11.016. [DOI] [PubMed] [Google Scholar]
- 24.Wollenberg B, Jan V, Schmit UM, et al. Cyfra 21–1 is not superior to SCC antigen and CEA in head and neck squamous cell cancer. Anticancer Res. 1996;16:3117–24. [PubMed] [Google Scholar]
- 25.Scheffold A, Murphy KM, Hofer T. Competition for cytokines: T(reg) cells take all. Nature Immunol. 2007;8:1285–7. doi: 10.1038/ni1207-1285. [DOI] [PubMed] [Google Scholar]
- 26.Deaglio S, Dwyer KM, Gao W, et al. Adenosine generation catalyzed by CD39 and CD73 expressed on regulatory T cells mediates immune suppression. J Exp Med. 2007;204:1257–65. doi: 10.1084/jem.20062512. [DOI] [PMC free article] [PubMed] [Google Scholar]
- 27.Bopp T, Jonuleit H, Schmitt E. Regulatory T cells–the renaissance of the suppressor T cells. Ann Med. 2007;39:322–34. doi: 10.1080/07853890701379700. [DOI] [PubMed] [Google Scholar]
- 28.Liyanage UK, Moore TT, Joo HG, et al. Prevalence of regulatory T cells is increased in peripheral blood and tumor microenvironment of patients with pancreas or breast adenocarcinoma. J Immunol. 2002;169:2756–61. doi: 10.4049/jimmunol.169.5.2756. [DOI] [PubMed] [Google Scholar]
- 29.Albers AE, Ferris RL, Kim GG, et al. Immune responses to p53 in patients with cancer: enrichment in tetramer+ p53 peptide-specific T cells and regulatory T cells at tumor sites. Cancer Immunol Immunother. 2005;54:1072–81. doi: 10.1007/s00262-005-0670-9. [DOI] [PMC free article] [PubMed] [Google Scholar]
- 30.Shevach EM. Regulatory/suppressor T cells in health and disease. Arthritis Rheum. 2004;50:2721–4. doi: 10.1002/art.20500. [DOI] [PubMed] [Google Scholar]
- 31.Badoual C, Hans S, Rodriguez J, et al. Prognostic value of tumor-infiltrating CD4+ T-cell subpopulations in head and neck cancers. Clin Cancer Res. 2006;12:465–72. doi: 10.1158/1078-0432.CCR-05-1886. [DOI] [PubMed] [Google Scholar]
- 32.Kuss I, Hathaway B, Ferris RL, et al. Decreased absolute counts of T lymphocyte subsets and their relation to disease in squamous cell carcinoma of the head and neck. Clin Cancer Res. 2004;10:3755–62. doi: 10.1158/1078-0432.CCR-04-0054. [DOI] [PubMed] [Google Scholar]
- 33.Kuss I, Hathaway B, Ferris RL, et al. Imbalance in absolute counts of T lymphocyte subsets in patients with head and neck cancer and its relation to disease. Adv Otorhinolaryngol. 2005;62:161–72. doi: 10.1159/000082506. [DOI] [PubMed] [Google Scholar]
- 34.Molling JW, Langius JA, Langendijk JA, et al. Low levels of circulating invariant natural killer T cells predict poor clinical outcome in patients with head and neck squamous cell carcinoma. J Clin Oncol. 2007;25:862–8. doi: 10.1200/JCO.2006.08.5787. [DOI] [PubMed] [Google Scholar]
- 35.Chikamatsu K, Sakakura K, Whiteside TL, et al. Relationships between regulatory T cells and CD8+ effector populations in patients with squamous cell carcinoma of the head and neck. Head Neck. 2007;29:120–7. doi: 10.1002/hed.20490. [DOI] [PubMed] [Google Scholar]
- 36.Kim JW, Tsukishiro T, Johnson JT, et al. Expression of pro- and antiapoptotic proteins in circulating CD8+ T cells of patients with squamous cell carcinoma of the head and neck. Clin Cancer Res. 2004;10:5101–10. doi: 10.1158/1078-0432.CCR-04-0309. [DOI] [PubMed] [Google Scholar]
- 37.Dong HP, Elstrand MB, Holth A, et al. NK- and B-cell infiltration correlates with worse outcome in metastatic ovarian carcinoma. Am J Clin Pathol. 2006;125:451–8. [PubMed] [Google Scholar]
- 38.Palmesino E, Moepps B, Gierschik P, et al. Differences in CXCR4-mediated signaling in B cells. Immunobiology. 2006;211:377–89. doi: 10.1016/j.imbio.2005.12.003. [DOI] [PubMed] [Google Scholar]
- 39.Lathers DM, Lubbers E, Beal NM, et al. Cultures derived from peripheral blood CD34+ progenitor cells of head and neck cancer patients and from cord blood are functionally different. Hum Immunol. 1999;60:1207–15. doi: 10.1016/s0198-8859(99)00114-7. [DOI] [PubMed] [Google Scholar]