

Abstract
Theiler’s murine encephalomyelitis is an experimentally virus-induced inflammatory demyelinating disease of the spinal cord, displaying clinical and pathological similarities to chronic progressive multiple sclerosis. The aim of this study was to identify pathways associated with chronic demyelination using an assumption-free combined microarray and immunohistology approach. Movement control as determined by rotarod assay significantly worsened in Theiler’s murine encephalomyelitis -virus-infected SJL/J mice from 42 to 196 days after infection (dpi). In the spinal cords, inflammatory changes were detected 14 to 196 dpi, and demyelination progressively increased from 42 to 196 dpi. Microarray analysis revealed 1001 differentially expressed genes over the study period. The dominating changes as revealed by k-means and functional annotation clustering included up-regulations related to intrathecal antibody production and antigen processing and presentation via major histocompatibility class II molecules. A random forest machine learning algorithm revealed that down-regulated lipid and cholesterol biosynthesis, differentially expressed neurite morphogenesis and up-regulated toll-like receptor-4-induced pathways were intimately associated with demyelination as measured by immunohistology. Conclusively, although transcriptional changes were dominated by the adaptive immune response, the main pathways associated with demyelination included up-regulation of toll-like receptor 4 and down-regulation of cholesterol biosynthesis. Cholesterol biosynthesis is a rate limiting step of myelination and its down-regulation is suggested to be involved in chronic demyelination by an inhibition of remyelination.
Keywords: cholesterol, demyelination, immunohistology, microarray, multiple sclerosis, random forest machine learning algorithm, spinal cord, Theiler’s murine encephalomyelitis, toll-like receptor 4
Introduction
Multiple sclerosis (MS) is the major immune-mediated demyelinating human disease, affecting more than 2.5 million people [1]. It is characterized by varying amounts of demyelination, remyelination, inflammation, gliosis and axonal injury [1, 2]. In the majority of patients, the disease starts with a relapsing course (relapsing/remitting MS), followed by a progressive phase (secondary progressive MS) years later. In other patients, the relapsing form is missing and the disease is progressive right from the beginning (primary progressive MS). The mechanisms responsible for lesion induction and progression are complex and heterogeneous, and likely reflect different causes and immunopathogenetic mechanisms [3, 4]. A pathohistological comparison revealed that while focal, heavily inflamed, white matter plaques dominate in acute, relapsing MS, a more diffuse inflammatory process that affects the whole central nervous system is associated with massive cortical demyelination and diffuse axonal injury in progressive MS [5]. Based on these findings, Lassmann suggested that progression to progressive MS is associated with the development of a compartmentalized immune response, including intrathecal antibody production trapped behind a closed blood-brain barrier [6, 7]. The currently available anti-inflammatory, immunomodulatory or immunosuppressive therapies which successfully reduce the severity and rate of relapses, however, frequently fail to prevent clinical and pathological deterioration of patients with progressive MS [6].
Infection of susceptible mouse strains with low neurovirulent strains of Theiler’s murine encephalomyelitis virus (TMEV) results in a chronic progressive inflammatory demyelination of the spinal cord white matter, showing many clinical and pathohistological similarities to chronic progressive MS [8–10]. The recent demonstration of early onset axonal pathology in Theiler’s murine encephalomyelitis led to the conclusion, that Wallerian-type primary axonal pathology due to neuronal death in the acute polioencephalitic phase of the disease induces the first foci of inflammation and myelin breakdown in the spinal cord [11, 12]. Subsequently, a delayed-type hypersensitivity reaction develops against the virus [13], which triggers a cascade of events in which pro-inflammatory cytokines released from virus-specific CD4+ T cells cause macrophage-induced bystander demyelination and release of endogenous myelin antigens [14]. Tissue damage and demyelination are exacerbated due to epitope spreading of CD4+ T cells and delayed type hypersensitivity reaction against myelin epitopes [15]. It has been shown that macrophages are of special importance in the pathogenesis of demyelination in Theiler’s murine encephalomyelitis. They represent the main antigen presenting cells [16], important effector cells of the delayed type hypersensitivity reaction [17–19] and the main reservoir for virus persistence [20]. Similarly in many chronic MS cases, remyelination is sparse or absent in Theiler’s murine encephalomyelitis, despite the presence of intralesional oligodendroglial progenitor cells [10, 21]. In contrast to Theiler’s murine encephalomyelitis, a fast and complete remyelination occurs in most other models of MS [22–25]. Rodriguez suggested that the balance of de- and remyelination ultimately determines the outcome of an acute attack in MS and, possibly, the development of secondary progressive disease [3]. We recently reported that the failure of remyelination is due to an inhibited differentiation of oligodendroglial progenitor cells in Theiler’s murine encephalomyelitis [10]. Possible differentiation-inhibiting mechanisms include a non-permissive environment, axonal loss or the inability of chronically demyelinated axons to be remyelinated [26, 27].
The aims of the present investigation were to perform an assumption-free microarray analysis of the transcriptional changes in the time course of Theiler’s murine encephalomyelitis, and determine possible pathways contributing to remyelination failure and chronic progressive demyelination by combining data obtained by immunohistology and microarray analysis using a random forest machine learning algorithm.
Materials and methods
Experimental design
Five-week-old female SJL/JHanHsd-mice (Harlan Winkelmann, Borchen, Germany) were inoculated into the right cerebral hemisphere with 1.63 × 10⁶ PFU/mouse of the BeAn-strain of TMEV [10, 17]. Unless otherwise stated, all experiments were performed with groups of six TMEV- and mock-infected mice killed at 14, 42, 98 and 196 days after infection (dpi), except for five TMEV-infected mice at 98 dpi. The spinal cord segments encased within the first cervical vertebral body, third and fourth thoracic vertebral bodies and the first lumbar vertebral body of the spinal column were fixed in 10% formalin for 24 hrs, decalcified in 10% ethylenediaminetetraacetic acid solution for 48 hrs and embedded in paraffin wax. The remaining parts of the spinal cord were removed from the spinal canal and immediately snap-frozen and stored at −80°C. The animal experiments were authorized by the local authorities (Regierungspräsidium Hannover, Germany, permission number: 33–42502-0/63).
Rotarod analysis
The clinical course of Theiler’s murine encephalomyelitis was evaluated with a rotarod assay (RotaRod Treadmill, TSE Technical & Scientific Equipment, Bad Homburg, Germany), a special test for motor strength and control [28]. The mice were trained at –14 dpi and at –7 dpi for 10 min. at a constant speed of 5 or 10 rounds per minute (RPM), respectively. For the measurements, the rod speed was linearly increased from 5 RPM towards 55 RPM over a time period of 5 min. All living mice were repeatedly assayed at 0 dpi (pre-infection), 14, 28, 42, 56, 70, 98, 147 and 196 dpi. A mean score per mouse was calculated from three trials per day.
Histological and immunohistological examination
Transversal sections of formalin fixed, paraffin embedded cervical, thoracic and lumbar spinal cord were stained with haematoxylin and eosin and semi-quantitatively evaluated for meningitis and perivascular inflammation in the white matter (leukomyelitis) as follows: 0 = no change; 1 = scattered perivascular infiltrates; 2 = 2 to 3 layers of perivascular inflammatory cells; 3 = more than 3 layers of perivascular inflammatory cells. Furthermore, serial sections were stained with Luxol fast blue-cresyl violet and the degree of demyelination was semi-quantitatively evaluated as follows: 0 = no change; 1 = <25%; 2 = 25–50%; 3 = 50–100% of white matter affected [17, 29]. A mean score per mouse was calculated from all three locations evaluated.
Immunohistology was performed on formalin fixed, paraffin embedded spinal cord using the avidin-biotin-peroxidase complex (ABC) method (Vector Laboratories, Burlingame, CA, USA) as described [10, 29]. The applied antibodies were CD3 (polyclonal rabbit anti-human, diluted 1: 1000, Dako Diagnostika, Hamburg, Germany), CD45R/B220 (monoclonal rat antimouse biotinylated, clone RA3–6B2, diluted 1: 2000, BD Biosciences Pharmingen, Erembodegem, Belgium), IgG (H + L, polyclonal goat antimouse biotinylated, diluted 1: 200, Biologo, Kiel Germany), CD107b (monoclonal rat antimouse biotinylated, clone M/4, diluted 1: 800, Serotec, Oxford, UK) and myelin basic protein (MBP; polyclonal rabbit anti-human, diluted 1: 800, Chemicon Europe, Hofheim/Taunus, Germany). The density of CD3, CD45R/B220, IgG and CD107b+ cells per spinal cord was counted as described [10]. The MBP+ white matter area was measured employing the analysis 3.1 software package (SOFT Imaging system, Münster, Germany) as described [10, 17].
RNA isolation and microarray hybridization
RNA was isolated from quick frozen spinal cord specimens using the RNeasy Mini Kit (Qiagen, Hilden, Germany) including DNAse digestion followed by an additional purification step employing the RNeasy MinElute Cleanup Kit (Qiagen). RNA quality was controlled using the Agilent 6000 RNA Nano kit and an Agilent Bioanalyzer 2100 (Agilent, Böblingen, Germany). A total of 250 ng RNA of each sample was amplified and labelled with the MessageAmp II-Biotin Enhanced Kit (Ambion, Austin, TX, USA). A hybridization mixture containing 10 μg of fragmented and labelled cRNA was hybridized to Affymetrix mouse genome 430 2.0 arrays (Affymetrix, Santa Clara, CA, USA) in a rotating hybridization oven at 45°C for 16 hrs. Afterwards the arrays were washed and stained with a solution containing R-phycoerythrin-streptavidin employing the Affymetrix GeneChip Fluidics Station 450 (Affymetrix). Scanning was performed with an Affymetrix GeneChip Scanner 3000 (Affymetrix). MIAME compliant data sets will be published upon acceptance in the ArrayExpress database (http://www.ebi.ac.uk/microarray-as/ae/).
Detection of differentially expressed genes
Background adjustment and quantile normalization across all microarrays was performed with the robust multichip average (RMA) of RMAExpress [30]. Homogeneity of the data was checked by principal components analysis (PCA, Partek Genomics Suite 6.2, St. Louis, MO, USA). Six mice were used as biological replicates per group and time-point, except for five TMEV-infected mice at 98 dpi. The hybridization experiments were repeated once for all mice obtained 98 dpi, resulting in qualitatively similar results (data not shown). Statistical analysis was performed on log2-transformed expression values. Significant differential gene expression was determined employing the spline-based method embedded in EDGE (extraction of differential gene expression) [31, 32]. A q-value of ≤0.01 was selected to designate significant changes in gene expression, and simultaneously limit the maximally allowed false discovery rate to 1.0%. The differentially expressed genes were grouped by k-means clustering of the log2 mean fold changes using Euclidean distance (Cluster 3.0, Treeview 1.1.0) [33, 34].
Gene ontology information was assigned to the differentially expressed probe sets employing DAVID (database for annotation, visualization and integrated discovery) [35]. In those cases where multiple probe sets matched to a single official gene symbol, the probe set with the lowest q-value was selected for further analyses. Significantly enriched pathways were selected from the biological process category of the gene ontology database at a false discovery rate of 1.0%[35, 36].
Random forest machine learning algorithm
The LeFE (learner of functional enrichment) random forest machine learning algorithm was employed to link the gene expression profiles of the spinal cords to the amount of demyelination obtained by MBP immunohistology [37]. The 45,101 probe sets of the array were reduced to 19,238 unique official gene symbols using MatchMiner [38]. The biological processes of the gene ontology database were selected to arrange the genes into functionally related categories [36].
Results
TMEV-induced demyelinating disease
The TMEV-infected mice showed a progressively declining performance in the rotarod assay. At 196 dpi the rotarod performance was reduced to 53.4%± 4.4% of the baseline measurement at 0 dpi (Fig. 1). Mock-infected mice showed no significant change over the study period. Two-way repeated measures ANOVA revealed a significantly decreased rotarod performance in TMEV-infected compared to mock-infected mice from 42 dpi to 196 dpi (Fig. 1).
Fig 1.

Rotarod analysis. Rotarod analysis revealed a chronic progredient reduction of motor strength and control in TMEV-infected mice compared with mock-infected mice. Data are presented as the mean ± standard error of mean of the percent change compared with the pre-injection baseline measurement on day 0. The following number of animals was evaluated per group: n= 39 at 14 dpi; n= 33 at 28 and 42 dpi; n= 27 at 56, 70 and 98 dpi; n= 21 at 147 dpi; n= 15 at 196 dpi. A significant difference between the groups as detected by two-way repeated-measure anova with post hoc independent t-tests for the different time-points is marked as follows: *P≤ 0.05.
Pathohistological examination of the spinal cords revealed a mononuclear inflammation of the meninges and within the white matter (leukomyelitis) in TMEV-infected mice, beginning 14 dpi (Figs 2 and 3). The inflammatory changes increased towards 98 dpi, followed by a mild decline of the meningeal infiltrates towards 196 dpi. First demyelinated foci were detected in the ventrolateral funiculi at 42 dpi. The amount of demyelination progressively increased until 196 dpi. The inflammatory as well as the demyelinating changes were mainly found in the thoracic and cervical spinal cord, whereas the lumbal segments displayed only minor changes. The mock-infected mice showed no demyelinating lesions. Statistical comparisons employing Mann-Whitney U-tests displayed a significantly higher degree of meningitis and perivascular inflammation in the white matter from 14 to 196 dpi, and demyelination from 42 to 196 dpi in TMEV infected compared to mock-infected mice, respectively (Fig. 3).
Fig 2.

Inflammatory demyelination in the spinal cord 98 days after TMEV infection. (A) Transversal section of the thoracic spinal cord displaying multifocal mononuclear inflammatory infiltrates (arrowheads) within the meninges and perivascular spaces. Multiple demyelinated areas (arrows) are mainly present in the ventral and lateral funiculi of the thoracic spinal cord. (B) Higher magnification from (A) displaying perivascular mononuclear infiltrates (arrowheads) and macrophages/microglia displaying Gitter cell morphology (arrow) within the demyelinated white matter lesions. Luxol fast blue-cresyl violet. Scale bars = (A) 500 μm; (B) 20 μm.
Fig 3.

Pathohistological changes in the spinal cords. Semi-quantitative assessment of pathohistological changes in Theiler’s murine encephalomyelitis revealed early onset inflammatory changes followed by a chronic progressive demyelination in TMEV-infected mice. Box and whisker plots show the median and quartiles of the semi-quantitative scores. Extreme values are shown as circles. Six mice were evaluated per group and time-point, except for five TMEV-infected mice at 98 dpi. A significant difference between the groups as detected by the Mann-Whitney U-tests is marked as follows: *P≤ 0.05.
Analysis of major transcriptional changes in Theiler’s murine encephalomyelitis
To identify genes differentially expressed between TMEV- and mock-infected mice, we employed the spline-based method embedded in EDGE [31, 32]. A total of 1210 probe sets from the 45,101 probe sets of the Affymetrix mouse genome 430 2.0 array were identified to be differentially expressed over the study period at a false discovery rate of 1.0% (Table S1). These differentially expressed probe sets belonged to 1001 individual genes and expressed sequence tags with an official gene symbol.
Functional annotation clustering of all 1001 differentially expressed genes employing the web-accessible program DAVID revealed at least 15 clusters of highly related biological processes derived from the gene ontology database (Table S2) [35, 36]. These functional annotation clusters were related to immune response, antigen processing and presentation of exogenous peptide antigen via MHC class II, inflammatory response, humoural immune response, regulation of lymphocyte activation, cell communication, response to virus, positive regulation of type II hypersensitivity, chemotaxis, positive regulation of T-cell activation, positive regulation of apoptosis, antigen processing and presentation of endogenous peptide antigen via MHC class I, regulation of tumour necrosis factor (TNF) biosynthetic process, positive regulation of lymphocyte activation and positive regulation of TNF biosynthetic process.
The log2 mean fold changes of the individual time-points of the 1001 differentially expressed genes in TMEV-infected versus mock-infected mice were clustered to detect similarities in the expression pattern. According to the generated k-means clusters (Fig. 4), the majority of the differentially expressed genes displayed an up-regulated transcription in the chronic phase of Theiler’s murine encephalomyelitis, frequently peaking at 98 dpi. The genes within the obtained six k-means clusters with comparable expression patterns were assigned to functional annotation clustering (Table 1). The k-means cluster I included the 10 genes with the absolute highest fold changes, which were up-regulated from 14 to 196 dpi, with an increase from 14 to 42 dpi and a constantly high expression thereafter (Fig. 4A and B). The genes belonging to cluster I were significantly enriched in gene ontology terms related to the humoural immune response (Table 1). Likewise at 196 dpi, among other antibody domains the constant regions of the heavy chains of IgG2c (IGH-1B) and IgG1 (IGH-4) showed a 398.06- and 87.25-fold up-regulation, respectively. Notably, the Affymetrix probe set 1425385_a_at was originally assigned to IgG2a (IGH-1A) employing the program DAVID. However, certain strains of mice including C57B/ and SJL mice do not express IgG2a, but IgG2c (IGH-1B) [39, 40]. A comparison of the target sequence of the probe set with the murine nucleotide sequences stored in the GenBank employing BLASTN 2.2.19+ revealed a 100% homology of the target sequence with either IgG2c and IgG2a [41]. Thereby it was demonstrated that Affymetrix probe set 1425385_a_at cannot differentiate between the expression of IgG2c and IgG2a. The k-means cluster II included 57 genes which were up-regulated from 14 to 196 dpi. The genes within this cluster demonstrated high fold changes, but in contrast to k-means cluster I, a more pronounced peak at 98 dpi (Fig. 4A and B). The genes belonging to k-means cluster II were significantly enriched in gene ontology terms related to the immune response, defence response, antigen processing and presentation of exogenous peptide antigen via MHC class II and response to other organisms (Table 1). Likewise, at 98 dpi the MHC class II antigens A, α (H2-AA) and β1(H2-AB1) showed a 27.54- and 45.24-fold up-regulation, respectively. The k-means cluster III and IV included 141 and 198 genes, respectively. The genes in k-means clusters III and IV were up-regulated from 14 or 42 dpi to 196 dpi, displayed a peak up-regulation at 98 dpi and a high or medium maximal fold change, respectively (Fig. 4A). The k-means cluster V included 334 genes with a mild and progressively increasing up-regulation from 42 to 196 dpi (Fig. 4A). The k-means cluster VI included 261 genes with a progressively decreasing, mild down-regulation towards 196 dpi (Fig. 4A). Despite the large number of genes in k-means clusters V and VI, they were related to only few significantly enriched gene ontology terms (Table 1). Likewise, the only significantly enriched gene ontology term derived for k-means cluster VI was the steroid biosynthetic process, which was a member of a cluster of functionally related gene ontology terms associated with lipid, cholesterol, sterol and steroid biosynthesis and metabolism. Mapping the down-regulated genes on the Kyoto encyclopaedia of genes and genomes pathways revealed that the enzymes isopentenyl-diphosphate γ isomerase (IDI1), farnesyl diphosphate farnesyl transferase 1 (FDFT1), squalene epoxidase (SQLE), cytochrome P450, family 51 (CYP51) and 24-dehydrocholesterol reductase (DHCR24), which were down-regulated –1.66, –1.46, –1.36, –1.55 and –1.55-fold at 196 dpi, respectively, execute multiple sequential steps in cholesterol biosynthesis [42].
Fig 4.

Expression profile of differentially expressed genes. The fold changes of the 1001 differentially expressed genes were grouped by k-means cluster analysis to reveal similar expression patterns. (A) Each row represents one of 1001 genes and each column one of the four experimental days. The log2-transformed fold changes are indicated by a colour scale ranging from –2 (relative low expression in TMEV-infected mice) in green to 2 (relative high expression in TMEV-infected mice) in red. The majority of the differentially expressed genes were organized into five k-means clusters (I-V) with increasing transcription and up-regulation in the chronic phase of Theiler’s murine encephalomyelitis. Only one k-means cluster (VI) consisted of genes with a decreasing expression during the study period and a down-regulation mainly in the chronic phase of Theiler’s murine encephalomyelitis. (B) Higher magnification from (A) displaying the log2-transformed fold change of the 67 genes of k-means clusters I and II on a broader scale ranging from –5 (relative low expression in TMEV-infected mice) in green to 5 (relative high expression in TMEV-infected mice) in red. The k-means clusters I and II include the genes with the highest up-regulations. The k-means cluster I showed a more constantly up-regulated expression from 42 to 196 dpi, whereas k-means cluster II displayed a peaking up-regulation at 98 dpi.
Table 1.
Significantly enriched pathways
| k-means cluster | Pathway | FDR (%) |
|---|---|---|
| I | Humoural immune response | 0.3 |
| II | Immune response | 0.0 |
| Defence response | 0.0 | |
| Antigen processing and presentation of exogenous peptide antigen via MHC class II | 0.0 | |
| Response to other organism | 0.2 | |
| III | Immune response | 0.0 |
| Antigen processing and presentation of peptide antigen via MHC class II | 0.0 | |
| Positive regulation of immune system process | 0.0 | |
| Immunoglobulin-mediated immune response | 0.5 | |
| T-cell activation | 0.0 | |
| Chemotaxis | 0.5 | |
| Activation of immune response | 0.1 | |
| Induction of apoptosis | 0.6 | |
| IV | Inflammatory response | 0.0 |
| Activation of immune response | 0.0 | |
| Antigen processing and presentation of endogenous peptide antigen via MHC class I | 0.1 | |
| Leucocyte activation | 0.0 | |
| Immune response-activating signal transduction | 0.0 | |
| Positive regulation of cytokine biosynthetic process | 0.1 | |
| Signal transduction | 0.2 | |
| Multi-organism process | 0.2 | |
| Regulation of lymphocyte activation | 0.0 | |
| Antigen processing and presentation of exogenous antigen | 0.5 | |
| Positive regulation of cellular process | 0.2 | |
| V | Intracellular signalling cascade | 0.3 |
| Adaptive immune response based on somatic recombination of immune receptors built from immunoglobulin superfamily domains | 0.5 | |
| VI | Steroid biosynthetic process | 0.2 |
The k-means cluster = number refers to the respective cluster of genes with a similar expression pattern in k-means cluster analysis as displayed in Fig. 4.
Pathways = from each cluster of functionally related gene ontology terms derived by DAVID, one term that subjectively gave the best description of the whole cluster was manually chosen.
FDR = false discovery rate of significant enrichment for the respective gene ontology term.
Machine learning approach to identify pathways related to demyelination
The recently developed web-accessible program LeFE was used to map the expression profiles of all 19,238 unique genes and expressed sequence tags with an official gene symbol from the Affymetrix mouse genome 430 2.0 array to the biological process categories of the gene ontology database [36, 37]. A total of 1137 gene ontology categories in the size range from 2 to 150 genes were included in the analysis. LeFE ranked these categories based on their relative association to the amount of demyelination as measured by MBP-immunohistology (Figs 5E and 6E). The top 20 categories related to demyelination in Theiler’s murine encephalomyelitis are listed in Table 2 and the top 100 categories inclusive the most important genes of each category are available in Table S3. The three highest scoring categories included sterol metabolism, cholesterol biosynthesis and lipid biosynthesis, all of which contained 7-dehydrocholesterol reductase (DHCR7) among the genes with the highest importance scores. DHCR7 showed a mildly decreasing time course of expression, reaching a –1.07, –1.12, –1.34 and –1.32-fold down-regulation at 14, 42, 98 and 196 dpi, respectively (EDGE, q= 0.072). Further genes with high importance scores related to cholesterol biosynthesis were NAD(P) dependent steroid dehydrogenase-like (NSDHL) and farnesyl diphosphate synthetase (FDPS), which also showed a decreasing time course of expression reaching a –1.40 and –1.38-fold down-regulation, respectively, at 196 dpi (EDGE, q= 0.033; q= 0.163). Additionally, the above mentioned FDFT1 was the gene with the highest importance score for lipid biosynthesis. The categories protein amino acid prenylation, protein prenylation and protein farnesylation are also linked to cholesterol biosynthesis. The genes with the highest importance scores in this group were farnesyltransferase-α and the expressed sequence AA409500 related to farnesyltransferase-β, which are involved in the post-translational prenylation and farnesylation of several proteins, including the small GTP-binding proteins RAB and RAS [43]. Both showed a mild decreasing expression pattern, reaching a –1.16 and –1.40-fold down-regulation at 196 dpi, respectively (EDGE, q < 0.001, and q= 0.002). In contrast to the above mentioned categories centred on the biosynthesis of cholesterol, the genes with the highest importance scores in the category cholesterol homeostasis showed an increasing expression pattern. These genes were apolipoprotein E (Apo E) and ATP-binding cassette, sub-family G (WHITE), member 1 (ABCG1), reaching a 1.53- and 1.11-fold up-regulation, respectively, at 196 dpi (EDGE q < 0.001, and q= 0.233). Apo E mediates cholesterol homeostasis in the body and is a major lipid carrier in the brain. As such, its expression changes in response to alterations in the cholesterol metabolism [44].
Fig 5.

Temporal changes of leucocytic infiltrates and demyelination in the spinal cord. Box and whiskerplots show the median and quartiles of the density of (A) CD3, (B) CD45R/B220, (C) IgG, (D) CD107b+ cells and (E) the MBP+ area. Extreme values are shown as circles. Six mice were evaluated per group and time-point, except for five TMEV-infected mice at 98 dpi. A significant difference between the groups as detected by the Mann-Whitney U-test is marked as follows: *P≤ 0.05.
Fig 6.
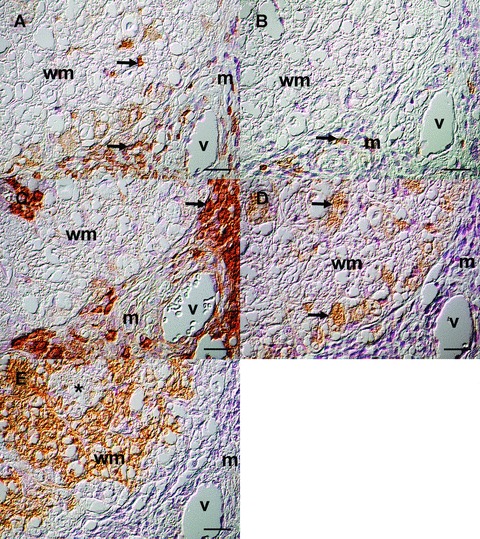
Immunohistological characterization of a demyelinating lesion at 98 dpi. Serial sections from the spinal cord of a TMEV-infected mouse from 98 dpi were immunolabelled for CD3 (A), CD45R/B220 (B), IgG (C), CD107b (D) and MBP (E). (A) A high amount of CD3+ T lymphocytes in the perivascular spaces and fewer cells in the white matter (arrows). (B) Few perivascular CD45R/B220+ B lymphocytes (arrow). (C) A high amount of IgG+ cells in the perivascular spaces (arrown). (D) CD107b+ macrophages with Gitter cell morphology (arrows) comprise the majority of parenchymal cellular infiltrates (E) Multifocally decreased MBP immunoreactivity (arrow) in the white matter. m = meninges, v = vessel, wm = white matter. Avidin-biotin-peroxidase complex method, haematoxylin counter-stain, Nomarski differential interference contrast. Scale bars = 20 μm.
Table 2.
Top 20 pathways involved in demyelination
| Rank | Pathway | FDR (%) |
|---|---|---|
| 1 | Sterol metabolism | 12.5 |
| 1 | Cholesterol biosynthesis | 12.5 |
| 3 | Lipid biosynthesis | 16.7 |
| 4 | Regulation of synaptic plasticity | 18.8 |
| 5 | Regulation of organismal physiological process | 18.8 |
| 5 | Regulation of transferase activity | 18.8 |
| 5 | Protein amino acid prenylation | 18.8 |
| 8 | Immune cell migration | 18.8 |
| 8 | Protein prenylation | 18.8 |
| 10 | Regulation of neurogenesis | 18.8 |
| 11 | Regulation of development | 18.8 |
| 11 | Regulation of protein kinase activity | 18.8 |
| 11 | Regulation of interleukin-13 biosynthesis | 18.8 |
| 14 | Cholesterol homeostasis | 19.6 |
| 15 | Neurite morphogenesis | 19.6 |
| 16 | Purine nucleotide metabolism | 19.6 |
| 16 | Protein farnesylation | 19.6 |
| 18 | Axonogenesis | 19.6 |
| 19 | Regulation of interleukin-6 biosynthesis | 19.6 |
| 19 | Positive regulation of interleukin-6 biosynthesis | 19.6 |
The LeFE random forest machine learning algorithm was used to identify pathways associated with demyelination as measured by myelin basic protein immunohistology (Figs 5E and 6E).
FDR = False discovery rate of the respective category for the probability of observing any other category with an association to demyelination that is more significant by chance.
A second group within the top 20 categories related to demyelination in Theiler’s murine encephalomyelitis included regulation of organismal physiological process, regulation of transferase activity, regulation of interleukin-13 biosynthesis, regulation of interleukin-6 biosynthesis and positive regulation of interleukin-6 biosynthesis (Table 2). This group was centred on toll-like receptor 4 (TLR4) as the gene with the highest importance score. TLR4 showed a progressively increasing expression pattern, reaching a maximal ∼2.01-fold change at 196 dpi (EDGE, q < 0.001).
A third group within the top 20 categories related to demyelination in Theiler’s murine encephalomyelitis consisted of regulation of neurogenesis, neurite morphogenesis, axonogenesis and regulation of synaptic plasticity (Table 2), suggesting an association between axonal fate and demyelination. The genes with the highest importance scores in this group were Apo E, S100 protein, β-polypeptide (S100b), fasciculation and elongation protein zeta 1 (FEZ1), slit homolog 2 (SLIT2) and netrin G1 (NTNG1). As mentioned above, Apo E showed an increasing expression pattern and provides a hypothetical link between these categories and cholesterol homeostasis. In contrast to Apo E, S100b, FEZ1, SLIT2 and NTNG1 showed a decreasing expression pattern reaching a –1.20, –1.18, –1.23 and –1.16-fold down-regulation at 196 dpi, respectively (EDGE, q < 0.001, q < 0.001, q= 0.038 and q= 0.258, respectively).
Immunohistological verification of microarray results
To verify the finding, that the transcriptional changes are mainly related to processes involving the immune system, the amount of CD3+ T lymphocytes, CD45R/B220+ B lymphocytes, IgG+ cells and CD107b+ macrophages was investigated in the spinal cord of affected mice (Fig. 5A–D). Furthermore the MBP+ white matter area was assessed, to quantify the amount of demyelination (Fig. 5E). Immunohistochemistry displayed multifocal to coalescing parenchymal inflammatory infiltrates as well as a progressively decreasing MBP immunoreactivity (Fig. 6). The meninges and the perivascular spaces within the demyelinating plaques displayed inflammatory infiltrates, mostly consisting of CD3+ lymphocytes, IgG+ cells, to a lesser extent CD45R/B220+ B lymphocytes and CD107b+ macrophages. The parenchymal infiltrates consisted predominantly of CD107b+ macrophages and to a lesser extent CD3+ T lymphocytes. Many CD107b+ macrophages displayed Gitter-cell morphology. None or only few CD3, CD45R/B220, IgG and CD107b+ cells were noticed in mock-infected animals. Statistical analyses employing Mann-Whitney U-tests revealed a significantly higher amount of CD3, CD45R/B220 and IgG+ cells from 14 to 196 dpi, and CD107b+ cells from 42 to 196 dpi in TMEV-infected compared to mock-infected mice (Fig. 5A–D). The MBP+ area was significantly decreased at 196 dpi in TMEV-infected compared to mock-infected mice (Fig. 5E). The mean amount of each cell type or investigated protein was correlated to the respective gene expression employing Spearman’s rank correlation coefficient, using the data from both groups and all four experimental days (n= 47; Table 3). Notably, the genes coding for the analysed proteins were all contained in the list of the 1001 differentially expressed genes (Table S1). All investigated genes displayed a significant, moderate to high, positive correlation between the level of transcription and the amount of the corresponding antigen, substantiating the microarray results (Table 3).
Table 3.
Correlation between immunohistology and gene expression as measured by microarray. Spearman’s rank correlation coefficient was used to correlate the density of CD3, CD45R/B220, IgG and CD107b+ cells, and the myelin basic protein positive area with the respective mRNA level measured by microarray analysis in the spinal cord
| Gene expression | Immunohistology | ||||
|---|---|---|---|---|---|
| CD3 (cells/mm2) | CD45R/B220 (cells/mm2) | IgG (cells/mm2) | CD107b (cells/mm2) | MBP+ area (%) | |
| CD3D | 0.799* | 0.739* | 0.814* | 0.792* | –0.415* |
| CD3G | 0.804* | 0.655* | 0.735* | 0.830* | –0.435* |
| PTPRC (CD45R/B220) | 0.818* | 0.710* | 0.844* | 0.794* | –0.360* |
| LAMP2 (CD107B) | 0.760* | 0.572* | 0.767* | 0.718* | –0.486* |
| IGH-1B | 0.756* | 0.753* | 0.789* | 0.731* | –0.570* |
| IGH-4 | 0.775* | 0.718* | 0.808* | 0.718* | –0.353* |
| IGK-C | 0.790* | 0.705* | 0.907* | 0.815* | –0.452* |
| MBP | –0.523* | –0.437* | –0.690* | –0.649* | 0.518* |
CD3D = CD3, γ polypeptide; CD3G = CD3, gamma polypeptide; PTPRC (CD45R, B220) = protein tyrosine phosphatase receptor type C; LAMP2 (CD107B) = lysosomal membrane glycoprotein 2; IGH-1B = IgG2c heavy chain; IGH-4 = IgG1 heavy chain; IGK-C = Ig kappa chain, constant region; MBP = myelin basic protein.
A significant difference of the correlation coefficient from zero is marked as follows: *P≤ 0.05 (n= 47).
Discussion
In this study, oligonucleotide microarrays were used to identify the transcriptional changes in chronic progressive demyelinating Theiler’s murine encephalomyelitis, a virus-induced murine model of MS. Identification of differentially expressed genes at a false discovery rate of 1.0% was followed by clustering of these genes based on expression patterns and/or functional annotations. This approach revealed that the most prominent transcriptional changes in Theiler’s murine encephalomyelitis are up-regulations in the chronic phase of the disease, and are related to the adaptive immune response.
Multiple clusters of up-regulated genes, including the one with the highest absolute fold changes throughout the study period, were related to the humoural immune response, an immunoglobulin-mediated immune response, and an adaptive immune response based on somatic recombination of immune receptors built from the immunoglobulin superfamily, including the constant regions of the heavy chains of IgG2c (IGH-1B) and IgG1 (IGH-4), multiple Fc receptors (FCGR1, FCGR3, FCER1G), and complement components 1 (C1) and 3 (C3). These results strongly support the recent observation of a robust intrathecal production of IgG antibodies by CD138+ plasma cells in Theiler’s murine encephalomyelitis [45]. Furthermore, a local antibody production seems to be the best explanation for the higher antibody titres in the CNS compared to serum in about one-third of mice 3 weeks after TMEV infection [46]. The relative higher up-regulation of IgG2c compared to IgG1 in the present study could be an indirect hint towards a Th1-type response [40, 47]. Although detectable in Theiler’s murine encephalomyelitis in vivo, a contribution of anti-MBP antibodies to demyelination is unlikely [48, 49]. In contrast, a monoclonal antibody raised against TMEV was shown to be myelinotoxic due to cross-reaction with galactocerebroside of the myelin sheaths [50, 51]. Antibodies against galactocerebroside were also detected in Theiler’s murine encephalomyelitis, in vivo. Notably, the sterotactic injection of anti-galactocerebroside antibodies combined with complement represents a defined model of demyelination on its own [24, 52, 53]. This finding is of special relevance for the use of Theiler’s murine encephalomyelitis as a model for MS, since the antibody/complement-mediated lesion subtype of MS (pattern II according to Lucchinetti et al.) represents one of the most common ones [4]. Interestingly, a microarray study of secondary progressive MS revealed a robust up-regulation of genes related to antibody synthesis as the major discriminator between lesions and the normal appearing white matter as well as control cases [54]. Another study of MS also revealed an up-regulation of IgG and multiple complement components within the lesions [55]. The demonstrated up-regulation of the Fc receptor for the Fc fragment of IgG (FCGR1) is shared by multiple studies of MS and EAE [56]. The relevance of Fc receptors for chronic demyelination is supported by studies showing a selective up-regulation of the FC receptors for IgG and IgE within chronic MS lesions and a dramatic reversal of the mean clinical score in the chronic phase of EAE in FCGR1–/– mice compared to controls [55].
In the present study, a group of functionally related genes displaying high fold changes and peaking at 98 dpi was related to antigen processing and presentation of exogenous peptide antigen via MHC class II, including the α- and β-chains of MHC class II molecules. Furthermore, multiple molecules and receptors involved in activation of T-helper cells and co-stimulation of B cells including CD28, CD40, CD86 and interleukin-4 receptor α (IL-4R) were found to be significantly up-regulated. In Theiler’s murine encephalomyelitis macrophages and microglia are thought to represent the main antigen presenting cells [16, 57]. Following TMEV infection in vitro, microglia up-regulate MHC class II expression and co-stimulatory molecules such as CD80, CD86 and CD40 [57]. MHC class II restricted presentation of virus and myelin epitopes by antigen-presenting cells isolated from the spinal cord of mice with Theiler’s murine encephalomyelitis is well documented [58]. The importance of MHC class II expression for virus clearance in the acute phase of Theiler’s murine encephalomyelitis is shown by the occurrence of a severe polioencephalitis in MHC class II deficient mice [59]. In contrast, MHC class II restricted presentation of myelin epitopes could be a key event in the stimulation of autoreactive B cells. Similar to the present study, up-regulation of MHC class II molecules has been observed in MS and EAE [56]. The up-regulation of antigen processing and presentation via MHC class II molecules, and the humoural immune response within the demyelinated spinal cord in this study is in agreement with the hypothesis formulated by Lassmann that a local immune reaction trapped behind a closed blood-brain barrier represents a key pathomechanism in progressive MS [6].
The presented analysis of microarray experiments employing sequential significance analysis, clustering and detection of significantly enriched pathways has the advantage of providing a broad overview of the main transcriptional events at a low and controlled error rate of 1.0% false positives, but it does not directly link the transcriptional changes to the observed pathology. Therefore we used an alternative approach employing a recently developed random forest machine learning algorithm, which directly detects pathways related to demyelination as observed by MBP immunohistology [37, 60]. Accordingly, lipid, sterol and cholesterol biosynthesis, neurite morphogenesis and TLR4-induced immune reactions showed intimate associations to demyelination in this study. The observed down-regulation of cholesterol biosynthesis is suggested to be directly linked to chronic demyelination, possibly by inhibition of remyelination. The down-regulated genes CYP51, DHCR7, DHCR24, FDFT1, FDPS, IDI1, NSDHL and SQLE are members of the mevalonate pathway downstream of the 3-hydroxy-3-methylglutaryl coenzyme A (HMG-CoA) reductase and represent potent therapeutic targets for cholesterol-lowering agents [61]. Notably, the genes with the highest importance scores for cholesterol biosynthesis identified by LeFE (DHCR7, FDPS, NSDHL) displayed q-values above the 0.01 threshold employed in significance analysis, highlighting the fact that both approaches use independent criteria for pathway selection. Similar to the present study, a microarray analysis of MS cases revealed down-regulations of multiple genes related to lipid and cholesterol biosynthesis and specific myelin proteins, suggesting not only reduced levels of myelin but also a reduced capacity for repair [55]. Another microarray study of progressive MS revealed a down-regulation of DHCR7 not only in the lesions but additionally in the normal appearing white matter, suggesting that the down-regulation of cholesterol biosynthesis precedes demyelination [54]. At least 70% of myelin dry weight consists of lipids, especially cholesterol [62], and cholesterol availability represents a rate limiting factor for myelination [63]. Mice with a conditional FDFT1 mutation in oligodendrocytes display a robust quantitative impairment of myelination without ultrastructural defects or massive biochemical alterations of the generated myelin [63]. Mice with generally disrupted cholesterol biosynthesis, like DHCR7–/– mice show severe malformations of the central nervous system and die soon after birth [64]. In accordance with our hypothesis, that the down-regulation of cholesterol biosynthesis is the primary cause for chronic demyelination by an inhibition of remyelination, this study also showed a progressive down-regulation of MBP mRNA and antigen, as reported previously for Theiler’s murine encephalomyelitis [10, 65]. Similar to the present investigation, co-regulation of cholesterol biosynthesis and MBP transcription is described for mice with a conditional FDFT1 mutation in oligodendrocytes [63]. Although the presented results suggested an association of a down-regulated cholesterol biosynthesis with an increased myelin loss and an unfavourable clinical outcome, other studies revealed opposing results. In MBP-induced active EAE, inhibition of the HMG-CoA reductase, which is a key enzyme of the mevalonate pathway of cholesterol biosynthesis, resulted in lower clinical scores, diminished demyelination, reduced inflammation and an increased amount of intralesional oligodendrocyte progenitor cells at 13 and 20 days after immunization [66]. The different clinical and pathological outcome despite a down-regulated cholesterol biosynthesis in both studies is most likely the result of the different pathomechanisms and time courses of acute relapsing/remitting EAE compared to chronic progressive Theiler’s murine encephalomyelitis [10]. We suggest that the beneficial acute anti-inflammatory effects of a down-regulated cholesterol biosynthesis dominate in EAE [43], thereby preventing an independent evaluation of the long-term effects on remyelination. Notably, while short-time in vitro incubation of rat oligodendroglial progenitor cells and human oligodendrocytes with a HMG-CoA reductase-inhibitor enhances process extension and differentiation, long-time incubation results in process retraction and cell death [67]. While the first beneficial effect seemed to be induced via inhibition of a RhoA GTPase, the detrimental long-term effects are at least partially reversed by cholesterol or isoprenoid treatment. Although the transferability of these in vitro results to the in vivo situation remains to be investigated, further studies in chronic progressive demyelinating models like Theiler’s murine encephalomyelitis are suggested to unravel the role of altered oligodendroglial cholesterol biosynthesis on de- and remyelination and for risk assessment of the current treatment trials of cholesterol lowering drugs in MS [43].
The present study showed an association between demyelination and multiple categories centred on an up-regulated TLR4 expression. In the normal human central nervous system TLR4 expression is restricted to microglia, whereas in MS lesions microglia/macrophage as well as astrocytic expression is described [68]. In contrast, TLR4 expression has been observed in meninges, choroid plexus and circumventricular organs in the normal rat brain. However, after LPS stimulation TLR4 was also detected in rat microglial cells [69]. Activation of TLR4 in Theiler’s murine encephalomyelitis is suggested to be induced through damage-associated molecular patterns (alarmins) such as high mobility group box protein-1 and S100 proteins from necrotic cells and fragmented hyaluronic acid from the extracellular matrix [70–72]. Interestingly TLR-4 is known to promote precursor B cell maturation, and could be a potential co-stimulatory signal for the marked up-regulation of the intrathecal humoural immune response already described in the current study [73]. Furthermore, activation of macrophages through TLR4 induces TNF-α expression [74]. Notably in this study, two clusters of functionally related genes were found to be involved in processes which activate pathways resulting in the formation of TNF. TNF-α-signalling represents a well-described pathway leading to a down-regulation of myelin synthesis and oligodendrocyte apoptosis [75–77]. TLR4-mediated microglial activation in vitro leads to enhanced oligodendroglial and neuronal toxicity [78]. In contrast, the outcome of TLR4 activation of microglia/macrophages in vivo is more complex and can be rather beneficial [79–83]. For example, TLR4-activated microglia induce the proliferation of oligodendrocyte progenitor cells in vivo[82]. Further studies are needed to elucidate the role of TLR4 in Theiler’s murine encephalomyelitis.
The observed association of demyelination with differentially expressed genes related to neurite morphogenesis is in accordance with the hypothesis that early onset axonal injury may play an additional and possibly Theiler’s murine encephalomyelitis-specific pathogenetic factor [10–12, 70]. Alternatively, a differential expression of genes related to neurite morphogenesis can also result from secondary axonal pathology or disturbances in the cholesterol metabolism [64]. The presented results are in accordance with a microarray study from progressive MS, which revealed many differentially expressed genes operative in neural homeostasis [54]. Another microarray study of MS revealed that neuron-specific genes are generally decreased in the lesions [55]. Interestingly the most important genes in the categories neurite morphogenesis and axonogenesis included the diffusible guidance protein NTNG1, which is involved in the pathogenesis of neural malformations in DHCR7–/– mice, which display a lacking cholesterol biosynthesis [64]. However, further studies are needed to explain the observed changes and to assess their relationship to early onset (primary) and secondary axonal injury in Theiler’s murine encephalomyelitis.
In this study, IgG+ cells displayed the highest negative correlation to MBP gene expression (r=–0.690), pointing towards an association between the humoural immune response and demyelination. Since the employed polyclonal goat antimouse IgG (H + L)-antibody reacts with the heavy and light chains, it is assumed to cross-react with all classes of immunoglobulins. Therefore, the immunohistologically detected IgG+ cells include both plasma cells as well as B cells. Furthermore, positive labelling of other cells bearing surface bound immunoglobulis has to be taken into account and may contribute to the marked difference observed in the numbers of IgG+ cells and CD45R/B220+ B lymphocytes in the present study [84]. Especially the presence of autoreactive anti-galactocerebroside antibodies bound to oligodendrocytes and myelin and immunoglobulins reacting with Fc-receptors on macrophages should be taken into consideration [50, 51].
Furthermore CD107b+ cells displayed the second highest negative correlation to MBP gene expression (r=–0.649). The antigen detected by the employed monoclonal rat antimouse CD107b antibody is a lysosome-associated membrane protein also known as LAMP-2 or Mac-3, with an especially high expression in macrophages and granulocytes [85, 86]. Granulocytes can be easily detected based on their nuclear morphology and are not involved in the inflammatory process in Theiler’s murine encephalomyelitis. We could not detect a significant amount of CD107b+ microglia or other cells within the spinal cord parenchyma of mock-infected control mice. Similarly, no definitive microglial expression was demonstrated in another immunohistological study describing the tissue distribution of Mac-3 [87]. However, Mac-3+ resident microglial cells were non-enzymatically isolated from mouse brains by others [88]. We assume that the CD107b+ cells detected in the present study are most likely blood-borne macrophages, which are known to play a key role in TMEV persistence and demyelination [20, 89].
In summary, this study revealed that most of the transcriptional changes in Theiler’s murine encephalomyelitis are up-regulations in the chronic phase of the disease, functionally related to the adaptive immune response. Furthermore, we provided evidence that intrathecal antibody production contributes to the pathogenesis of Theiler’s murine encephalomyelitis. However, the processes with the highest association to demyelination included a down-regulation of lipid and cholesterol biosynthesis, an up-regulation of innate TLR-4 triggered immune responses and differentially expressed neurite morphogenesis. Based on these findings we suggest that a down-regulation of cholesterol biosynthesis may be the rate-limiting step inhibiting fast and efficient remyelination in chronic demyelinating conditions like Theiler’s murine encephalomyelitis and certain MS cases.
Acknowledgments
R.U. received a grant from the Centre for Systems Neuroscience, Hannover, Germany. We thank Anuschka Unold, Thomas Feidl and Martin Gamber for excellent technical support with the microarray technology. We also thank Ingo Gerhauser and Petra Grünig for technical support with the immunohistology. Furthermore, we thank Andreas Beineke, Ingo Gerhauser, Verena Haist, Michael Müller, Stephanie Klein, Frauke Seehusen and Heinz Theobald for technical support with the animal experiments. The BeAn strain of TMEV was a generous gift of Dr. H.L. Lipton, Department of Microbiology-Immunology, University of Illinois, Chicago, IL, USA.
Supporting Information
Official gene symbols, q-values, and relative fold changes for all 1210 probe sets differentially expressed between TMEV-infected and mock-infected mice in the time course of TME at a false discovery rate of 1.0%.
Results of the functional annotation clustering of all 1001 differentially expressed genes. The table shows the functional annotation clusters containing more than 50% significantly enriched gene ontology terms at a false discovery rate of 1.0%.
Please note: Wiley-Blackwell are not responsible for the content or functionality of any supporting materials supplied by the authors. Any queries (other than missing material) should be directed to the corresponding author for the article.
References
- 1.Trapp BD, Nave KA. Multiple sclerosis: an immune or neurodegenerative disorder. Annu Rev Neurosci. 2008;31:247–69. doi: 10.1146/annurev.neuro.30.051606.094313. [DOI] [PubMed] [Google Scholar]
- 2.Lassmann H, Bruck W, Lucchinetti CF. The immunopathology of multiple sclerosis: an overview. Brain Pathol. 2007;17:210–8. doi: 10.1111/j.1750-3639.2007.00064.x. [DOI] [PMC free article] [PubMed] [Google Scholar]
- 3.Rodriguez M. Effectors of demyelination and remyelination in the CNS: implications for multiple sclerosis. Brain Pathol. 2007;17:219–29. doi: 10.1111/j.1750-3639.2007.00065.x. [DOI] [PMC free article] [PubMed] [Google Scholar]
- 4.Lucchinetti C, Bruck W, Parisi J, et al. Heterogeneity of multiple sclerosis lesions: implications for the pathogenesis of demyelination. Ann Neurol. 2000;47:707–17. doi: 10.1002/1531-8249(200006)47:6<707::aid-ana3>3.0.co;2-q. [DOI] [PubMed] [Google Scholar]
- 5.Kutzelnigg A, Lucchinetti CF, Stadelmann C, et al. Cortical demyelination and diffuse white matter injury in multiple sclerosis. Brain. 2005;128:2705–12. doi: 10.1093/brain/awh641. [DOI] [PubMed] [Google Scholar]
- 6.Lassmann H. New concepts on progressive multiple sclerosis. Curr Neurol Neurosci Rep. 2007;7:239–44. doi: 10.1007/s11910-007-0036-0. [DOI] [PubMed] [Google Scholar]
- 7.Serafini B, Rosicarelli B, Magliozzi R, et al. Detection of ectopic B-cell follicles with germinal centers in the meninges of patients with secondary progressive multiple sclerosis. Brain Pathol. 2004;14:164–74. doi: 10.1111/j.1750-3639.2004.tb00049.x. [DOI] [PMC free article] [PubMed] [Google Scholar]
- 8.McGavern DB, Murray PD, Rodriguez M. Quantitation of spinal cord demyelination, remyelination, atrophy, and axonal loss in a model of progressive neurologic injury. J Neurosci Res. 1999;58:492–504. doi: 10.1002/(sici)1097-4547(19991115)58:4<492::aid-jnr3>3.0.co;2-p. [DOI] [PMC free article] [PubMed] [Google Scholar]
- 9.Zoecklein LJ, Pavelko KD, Gamez J, et al. Direct comparison of demyelinating disease induced by the Daniel’s strain and BeAn strain of Theiler’s murine encephalomyelitis virus. Brain Pathol. 2003;13:291–308. doi: 10.1111/j.1750-3639.2003.tb00029.x. [DOI] [PMC free article] [PubMed] [Google Scholar]
- 10.Ulrich R, Seeliger F, Kreutzer M, et al. Limited remyelination in Theiler’s murine ence-phalomyelitis due to insufficient oligodendroglial differentiation of nerve/glial antigen 2 (NG2)-positive putative oligodendroglial progenitor cells. Neuropathol Appl Neurobiol. 2008;34:603–20. doi: 10.1111/j.1365-2990.2008.00956.x. [DOI] [PubMed] [Google Scholar]
- 11.Tsunoda I, Kuang LQ, Libbey JE, et al. Axonal injury heralds virus-induced demyelination. Am J Pathol. 2003;162:1259–69. doi: 10.1016/S0002-9440(10)63922-3. [DOI] [PMC free article] [PubMed] [Google Scholar]
- 12.Tsunoda I, Tanaka T, Saijoh Y, et al. Targeting inflammatory demyelinating lesions to sites of Wallerian degeneration. Am J Pathol. 2007;171:1563–75. doi: 10.2353/ajpath.2007.070147. [DOI] [PMC free article] [PubMed] [Google Scholar]
- 13.Clatch RJ, Melvold RW, Miller SD, et al. Theiler murine encephalomyelitis virus (Tmev)-induced demyelinating disease in mice is influenced by the H-2d region – correlation with Temv-specific delayed-type hypersensitivity. J Immunol. 1985;135:1408–14. [PubMed] [Google Scholar]
- 14.Olson JK, Miller SD. The role of T cells ant the innate immune system in the pathogenesis of Theiler’s virus demyelinating disease. In: Lavi E, Constantinescu CS, editors. Experimental models of multiple sclerosis. New York: Springer; 2005. pp. 645–58. [Google Scholar]
- 15.Katz-Levy Y, Neville KL, Padilla J, et al. Temporal development of autoreactive Th1 responses and endogenous presentation of self myelin epitopes by central nervous system-resident APCs in Theiler’s virus-infected mice. J Immunol. 2000;165:5304–14. doi: 10.4049/jimmunol.165.9.5304. [DOI] [PubMed] [Google Scholar]
- 16.Pope JG, Vanderlugt CL, Rahbe SM, et al. Characterization of and functional antigen presentation by central nervous system mononuclear cells from mice infected with Theiler’s murine encephalomyelitis virus. J Virol. 1998;72:7762–71. doi: 10.1128/jvi.72.10.7762-7771.1998. [DOI] [PMC free article] [PubMed] [Google Scholar]
- 17.Ulrich R, Baumgärtner W, Gerhauser I, et al. MMP-12. MMP-3, and TIMP-1 are markedly upregulated in chronic demyelinating theiler murine encephalomyelitis. J Neuropathol Exp Neurol. 2006;65:783–93. doi: 10.1097/01.jnen.0000229990.32795.0d. [DOI] [PubMed] [Google Scholar]
- 18.Liuzzi GM, Riccio P, Dalcanto MC. Release of myelin basic protein-degrading proteolytic activity from microglia and macrophages after infection with Theilers murine encephalomyelitis virus – comparison between susceptible and resistant mice. J Neuroimmunol. 1995;62:91–102. doi: 10.1016/0165-5728(95)00110-n. [DOI] [PubMed] [Google Scholar]
- 19.Kim BS, Palma JP, Kwon D, et al. Innate immune response induced by Theiler’s murine encephalomyelitis virus infection. Immunol Res. 2005;31:1–12. doi: 10.1385/IR:31:1:01. [DOI] [PMC free article] [PubMed] [Google Scholar]
- 20.Lipton HL, Kumar ASM, Trottier M. Theiler’s virus persistence in the central nervous system of mice is associated with continuous viral replication and a difference in outcome of infection of infiltrating macrophages versus oligodendrocytes. Virus Res. 2005;111:214–23. doi: 10.1016/j.virusres.2005.04.010. [DOI] [PubMed] [Google Scholar]
- 21.Wolswijk G. Oligodendrocyte precursor cells in the demyelinated multiple sclerosis spinal cord. Brain. 2002;125:338–49. doi: 10.1093/brain/awf031. [DOI] [PubMed] [Google Scholar]
- 22.Lindner M, Heine S, Haastert K, et al. Sequential myelin protein expression during remyelination reveals fast and efficient repair after central nervous system demyelination. Neuropathol Appl Neurobiol. 2008;34:105–14. doi: 10.1111/j.1365-2990.2007.00879.x. [DOI] [PubMed] [Google Scholar]
- 23.Jordan CA, Friedrich VL, Godfraind C, et al. Expression of viral and myelin gene transcripts in a murine CNS demyelinating disease caused by a coronavirus. Glia. 1989;2:318–29. doi: 10.1002/glia.440020505. [DOI] [PMC free article] [PubMed] [Google Scholar]
- 24.Woodruff RH, Franklin RJM. Demyelination and remyelination of the caudal cerebellar peduncle of adult rats following stereotaxic injections of lysolecithin, ethidium bromide, and complement/antigalactocerebroside: a comparative study. Glia. 1999;25:216–28. doi: 10.1002/(sici)1098-1136(19990201)25:3<216::aid-glia2>3.0.co;2-l. [DOI] [PubMed] [Google Scholar]
- 25.Di Bello IC, Dawson MRL, Levine JM, et al. Generation of oligodendroglial progenitors in acute inflammatory demyelinating lesions of the rat brain stem is associated with demyelination rather than inflammation. J Neurocytol. 1999;28:365–81. doi: 10.1023/a:1007069815302. [DOI] [PubMed] [Google Scholar]
- 26.Franklin RJM. Why does remyelination fail in multiple sclerosis. Nature Rev Neurosci. 2002;3:705–14. doi: 10.1038/nrn917. [DOI] [PubMed] [Google Scholar]
- 27.Franklin RJ, Kotter MR. The biology of CNS remyelination: the key to therapeutic advances. J Neurol. 2008;255 Suppl 1:19–25. doi: 10.1007/s00415-008-1004-6. [DOI] [PubMed] [Google Scholar]
- 28.McGavern DB, Zoecklein L, Drescher KM, et al. Quantitative assessment of neurologic deficits in a chronic progressive murine model of CNS demyelination. Exp Neurol. 1999;158:171–81. doi: 10.1006/exnr.1999.7082. [DOI] [PMC free article] [PubMed] [Google Scholar]
- 29.Gerhauser I, Alldinger S, Baumgärtner W. Ets-1 represents a pivotal transcription factor for viral clearance, inflammation, and demyelination in a mouse model of multiple sclerosis. J Neuroimmunol. 2007;188:86–94. doi: 10.1016/j.jneuroim.2007.05.019. [DOI] [PubMed] [Google Scholar]
- 30.Bolstad BM, Irizarry RA, Astrand M, et al. A comparison of normalization methods for high density oligonucleotide array data based on variance and bias. Bioinformatics. 2003;19:185–93. doi: 10.1093/bioinformatics/19.2.185. [DOI] [PubMed] [Google Scholar]
- 31.Leek JT, Monsen E, Dabney AR, et al. EDGE: extraction and analysis of differential gene expression. Bioinformatics. 2006;22:507–8. doi: 10.1093/bioinformatics/btk005. [DOI] [PubMed] [Google Scholar]
- 32.Storey JD, Xiao WZ, Leek JT, et al. Significance analysis of time course microarray experiments. Proc Natl Acad Sci USA. 2005;102:12837–42. doi: 10.1073/pnas.0504609102. [DOI] [PMC free article] [PubMed] [Google Scholar]
- 33.Eisen MB, Spellman PT, Brown PO, et al. Cluster analysis and display of genome-wide expression patterns. Proc Natl Acad Sci USA. 1998;95:14863–8. doi: 10.1073/pnas.95.25.14863. [DOI] [PMC free article] [PubMed] [Google Scholar]
- 34.Saldanha AJ. Java Treeview-extensible visualization of microarray data. Bioinfor-matics. 2004;20:3246–8. doi: 10.1093/bioinformatics/bth349. [DOI] [PubMed] [Google Scholar]
- 35.Dennis G, Sherman BT, Hosack DA, et al. DAVID: database for annotation, visualization, and integrated discovery. Genome Biology. 2003;4:P3. [PubMed] [Google Scholar]
- 36.Ashburner M, Ball CA, Blake JA, et al. Gene ontology: tool for the unification of biology. Nat Genet. 2000;25:25–9. doi: 10.1038/75556. [DOI] [PMC free article] [PubMed] [Google Scholar]
- 37.Eichler GS, Reimers M, Kane D, et al. The LeFE algorithm: embracing the complexity of gene expression in the interpretation of microarray data. Genome Biol. 2007;8:R187. doi: 10.1186/gb-2007-8-9-r187. [DOI] [PMC free article] [PubMed] [Google Scholar]
- 38.Bussey KJ, Kane D, Sunshine M, et al. MatchMiner: a tool for batch navigation among gene and gene product identifiers. Genome Biol. 2003;4:R27. doi: 10.1186/gb-2003-4-4-r27. [DOI] [PMC free article] [PubMed] [Google Scholar]
- 39.Jouvin-Marche E, Morgado MG, Leguern C, et al. The mouse Igh-1a and Igh-1b H chain constant regions are derived from two distinct isotypic genes. Immunogenetics. 1989;29:92–7. doi: 10.1007/BF00395856. [DOI] [PubMed] [Google Scholar]
- 40.Martin RM, Brady JL, Lew AM. The need for IgG2c specific antiserum when isotyping antibodies from C57B/and NOD mice. J Immunol Methods. 1998;212:187–92. doi: 10.1016/s0022-1759(98)00015-5. [DOI] [PubMed] [Google Scholar]
- 41.Zhang Z, Schwartz S, Wagner L, et al. A greedy algorithm for aligning DNA sequences. J Comput Biol. 2000;7:203–14. doi: 10.1089/10665270050081478. [DOI] [PubMed] [Google Scholar]
- 42.Kanehisa M, Araki M, Goto S, et al. KEGG for linking genomes to life and the environment. Nucleic Acids Res. 2008;36:D480–4. doi: 10.1093/nar/gkm882. [DOI] [PMC free article] [PubMed] [Google Scholar]
- 43.Weber MS, Steinman L, Zamvil SS. Statins-treatment option for central nervous system autoimmune disease. Neurotherapeutics. 2007;4:693–700. doi: 10.1016/j.nurt.2007.08.004. [DOI] [PMC free article] [PubMed] [Google Scholar]
- 44.Adibhatla RM, Hatcher JF. Altered lipid metabolism in brain injury and disorders. Subcell Biochem. 2008;48:1–24. doi: 10.1007/978-1-4020-8831-5_9. [DOI] [PMC free article] [PubMed] [Google Scholar]
- 45.Pachner AR, Brady J, Narayan K. Antibody-secreting cells in the central nervous system in an animal model of MS: phenotype, association with disability, and in vitro production of antibody. J Neuroimmunol. 2007;190:112–20. doi: 10.1016/j.jneuroim.2007.09.001. [DOI] [PubMed] [Google Scholar]
- 46.Lipton HL, Gonzalez-Scarano F. Central nervous system immunity in mice infected with theiler’s virus. I. Local neutralizing antibody response. J Infect Dis. 1978;137:145–51. doi: 10.1093/infdis/137.2.145. [DOI] [PubMed] [Google Scholar]
- 47.Rad R, Brenner L, Krug A, et al. Toll-like receptor-dependent activation of antigen-presenting cells affects adaptive immunity to Helicobacter pylori. Gastroenterology. 2007;133:150–63. doi: 10.1053/j.gastro.2007.04.071. e3. [DOI] [PubMed] [Google Scholar]
- 48.Welsh CJR, Tonks P, Nash AA, et al. The effect of L3t4-T-cell depletion on the pathogenesis of Theiler murine encephalomyelitis virus-infection in Cba mice. J Gen Virol. 1987;68:1659–67. doi: 10.1099/0022-1317-68-6-1659. [DOI] [PubMed] [Google Scholar]
- 49.Seil FJ. Effects of humoral factors on myelin in organotypic cultures. In: Herndon RM, Seil FJ, editors. Multiple sclerosis: current status of research and treatment. New York: Demos Publications; 1994. pp. 33–50. [Google Scholar]
- 50.Yamada M, Zurbriggen A, Fujinami RS. Monoclonal-antibody to Theilers murine encephalomyelitis virus defines a determinant on myelin and oligodendrocytes, and augments demyelination in experimental allergic encephalomyelitis. J Exp Med. 1990;171:1893–907. doi: 10.1084/jem.171.6.1893. [DOI] [PMC free article] [PubMed] [Google Scholar]
- 51.Tsunoda I, Fujinami RS. TMEV and neuroantigens: myelin genes and proteins, molecular mimicry, epitope spreading, and autoantibody-mediated remyelination. In: Lavi E, Constantinescu CS, editors. Experimental models of multiple sclerosis. New York: Springer; 2005. pp. 593–616. [Google Scholar]
- 52.Saida K, Saida T, Brown MJ, et al. In vivo demyelination induced by intraneural injection of anti-galactocerebroside serum – morphologic study. Am J Pathol. 1979;95:99–116. [PMC free article] [PubMed] [Google Scholar]
- 53.Saida T, Saida K, Dorfman SH, et al. Experimental allergic neuritis induced by sensitization with galactocerebroside. Science. 1979;204:1103–6. doi: 10.1126/science.451555. [DOI] [PubMed] [Google Scholar]
- 54.Lindberg RLP, De Groot CJA, Certa U, et al. Multiple sclerosis as a generalized CNS disease – comparative microarray analysis of normal appearing white matter and lesions in secondary progressive MS. J Neuroimmunol. 2004;152:154–67. doi: 10.1016/j.jneuroim.2004.03.011. [DOI] [PubMed] [Google Scholar]
- 55.Lock C, Hermans G, Pedotti R, et al. Gene-microarray analysis of multiple sclerosis lesions yields new targets validated in autoimmune encephalomyelitis. Nat Med. 2002;8:500–8. doi: 10.1038/nm0502-500. [DOI] [PubMed] [Google Scholar]
- 56.Comabella M, Martin R. Genomics in multiple sclerosis – current state and future directions. J Neuroimmunol. 2007;187:1–8. doi: 10.1016/j.jneuroim.2007.02.009. [DOI] [PubMed] [Google Scholar]
- 57.Olson JK, Miller SD. Microglia initiate central nervous system innate and adaptive immune responses through multiple TLRs. J Immunol. 2004;173:3916–24. doi: 10.4049/jimmunol.173.6.3916. [DOI] [PubMed] [Google Scholar]
- 58.Katz-Levy Y, Neville KL, Girvin AM, et al. Endogenous presentation of self myelin epitopes by CNS-resident APCs in Theiler’s virus-infected mice. J Clin Invest. 1999;104:599–610. doi: 10.1172/JCI7292. [DOI] [PMC free article] [PubMed] [Google Scholar]
- 59.Njenga MK, Pavelko KD, Baisch J, et al. Theiler’s virus persistence and demyelination in major histocompatibility complex class II-deficient mice. J Virol. 1996;70:1729–37. doi: 10.1128/jvi.70.3.1729-1737.1996. [DOI] [PMC free article] [PubMed] [Google Scholar]
- 60.Pang H, Lin A, Holford M, et al. Pathway analysis using random forests classification and regression. Bioinformatics. 2006;22:2028–36. doi: 10.1093/bioinformatics/btl344. [DOI] [PubMed] [Google Scholar]
- 61.Amin D, Rutledge RZ, Needle SJ, et al. RPR 101821, a new potent cholesterol-lowering agent: inhibition of squalene synthase and 7-dehydrocholesterol reductase. Naunyn Schmiedebergs Arch Pharmacol. 1996;353:233–40. doi: 10.1007/BF00168762. [DOI] [PubMed] [Google Scholar]
- 62.Baumann N, Pham-Dinh D. Biology of oligodendrocyte and myelin in the mammalian central nervous system. Physiol Rev. 2001;81:871–927. doi: 10.1152/physrev.2001.81.2.871. [DOI] [PubMed] [Google Scholar]
- 63.Saher G, Brugger B, Lappe-Siefke C, et al. High cholesterol level is essential for myelin membrane growth. Nat Neurosci. 2005;8:468–75. doi: 10.1038/nn1426. [DOI] [PubMed] [Google Scholar]
- 64.Waage-Baudet H, Dunty WC, Dehart DB, et al. Immunohistochemical and microarray analyses of a mouse model for the Smith-Lemli-Opitz syndrome. Dev Neurosci. 2005;27:378–96. doi: 10.1159/000088453. [DOI] [PubMed] [Google Scholar]
- 65.Yamada M, Zurbriggen A, Fujinami RS. The relationship between viral-Rna, myelin-specific messenger-Rnas, and demyelination in central-nervous-system disease during Theilers virus-infection. Am J Pathol. 1990;137:1467–79. [PMC free article] [PubMed] [Google Scholar]
- 66.Paintlia AS, Paintlia MK, Khan M, et al. HMG-CoA reductase inhibitor augments survival and differentiation of oligodendrocyte progenitors in animal model of multiple sclerosis. FASEB J. 2005;19:1407–21. doi: 10.1096/fj.05-3861com. [DOI] [PubMed] [Google Scholar]
- 67.Miron VE, Rajasekharan S, Jarjour AA, et al. Simvastatin regulates oligodendroglial process dynamics and survival. Glia. 2007;55:130–43. doi: 10.1002/glia.20441. [DOI] [PubMed] [Google Scholar]
- 68.Bsibsi M, Ravid R, Gveric D, et al. Broad expression of Toll-like receptors in the human central nervous system. J Neuropathol Exp Neurol. 2002;61:1013–21. doi: 10.1093/jnen/61.11.1013. [DOI] [PubMed] [Google Scholar]
- 69.Laflamme N, Rivest S. Toll-like receptor 4: the missing link of the cerebral innate immune response triggered by circulating gram-negative bacterial cell wall components. FASEB J. 2001;15:155–63. doi: 10.1096/fj.00-0339com. [DOI] [PubMed] [Google Scholar]
- 70.Tsunoda I. Axonal degeneration as a self-destructive defense mechanism against neurotropic virus infection. Future Virol. 2008;3:579–93. doi: 10.2217/17460794.3.6.579. [DOI] [PMC free article] [PubMed] [Google Scholar]
- 71.Tizard IR. How inflammation is triggered. In: Tizard IR, editor. Veterinary immunology. St. Louis: Saunders; 2008. [Google Scholar]
- 72.Termeer C, Benedix F, Sleeman J, et al. Oligosaccharides of hyaluronan activate dendritic cells via toll-like receptor 4. J Exp Med. 2002;195:99–111. doi: 10.1084/jem.20001858. [DOI] [PMC free article] [PubMed] [Google Scholar]
- 73.Hayashi EA, Akira S, Nobrega A. Role of TLR in B cell development: signaling through TLR4 promotes B cell maturation and is inhibited by TLR2. J Immunol. 2005;174:6639–47. doi: 10.4049/jimmunol.174.11.6639. [DOI] [PubMed] [Google Scholar]
- 74.Tsan MF, Clark RN, Goyert SM, et al. Induction of TNF-alpha and MnSOD by endotoxin: role of membrane CD14 and Toll-like receptor-4. Am J Physiol Cell Physiol. 2001;280:C1422–30. doi: 10.1152/ajpcell.2001.280.6.C1422. [DOI] [PubMed] [Google Scholar]
- 75.Gerhauser I, Ulrich R, Alldinger S, et al. Induction of activator protein-1 and nuclear factor-kappaB as a prerequisite for disease development in susceptible SJL/J mice after theiler murine encephalomyelitis. J Neuropathol Exp Neurol. 2007;66:809–18. doi: 10.1097/nen.0b013e3181461f31. [DOI] [PubMed] [Google Scholar]
- 76.Akassoglou K, Bauer J, Kassiotis G, et al. Oligodendrocyte apoptosis and primary demyelination induced by local TNF/p55TNF receptor signaling in the central nervous system of transgenic mice: models for multiple sclerosis with primary oligodendrogliopathy. Am J Pathol. 1998;153:801–13. doi: 10.1016/S0002-9440(10)65622-2. [DOI] [PMC free article] [PubMed] [Google Scholar]
- 77.Inoue A, Koh CS, Yahikozawa H, et al. The level of tumor necrosis factor-alpha producing cells in the spinal cord correlates with the degree of Theiler’s murine encephalomyelitis virus-induced demyelinating disease. Int Immunol. 1996;8:1001–8. doi: 10.1093/intimm/8.7.1001. [DOI] [PubMed] [Google Scholar]
- 78.Lehnardt S, Massillon L, Follett P, et al. Activation of innate immunity in the CNS triggers neurodegeneration through a Toll-like receptor 4-dependent pathway. Proc Natl Acad Sci USA. 2003;100:8514–9. doi: 10.1073/pnas.1432609100. [DOI] [PMC free article] [PubMed] [Google Scholar]
- 79.Felts PA, Woolston AM, Fernando HB, et al. Inflammation and primary demyelination induced by the intraspinal injection of lipopolysaccharide. Brain. 2005;128:1649–66. doi: 10.1093/brain/awh516. [DOI] [PMC free article] [PubMed] [Google Scholar]
- 80.Kerfoot SM, Long EM, Hickey MJ, et al. TLR4 contributes to disease-inducing mechanisms resulting in central nervous system autoimmune disease. J Immunol. 2004;173:7070–7. doi: 10.4049/jimmunol.173.11.7070. [DOI] [PubMed] [Google Scholar]
- 81.Kigerl KA, Lai WM, Rivest S, et al. Toll-like receptor (TLR)-2 and TLR-4 regulate inflammation, gliosis, and myelin sparing after spinal cord injury. J Neurochem. 2007;102:37–50. doi: 10.1111/j.1471-4159.2007.04524.x. [DOI] [PubMed] [Google Scholar]
- 82.Glezer I, Lapointe A, Rivest S. Innate immunity triggers oligodendrocyte progenitor reactivity and confines damages to brain injuries. FASEB J. 2006;20:750–2. doi: 10.1096/fj.05-5234fje. [DOI] [PubMed] [Google Scholar]
- 83.Marta M, Andersson A, Isaksson M, et al. Unexpected regulatory roles of TLR4 and TLR9 in experimental autoimmune encephalomyelitis. Eur J Immunol. 2008;38:565–75. doi: 10.1002/eji.200737187. [DOI] [PubMed] [Google Scholar]
- 84.Whiteland JL, Nicholls SM, Shimeld C, et al. Immunohistochemical detection of T-cell subsets and other leukocytes in paraffin-embedded rat and mouse tissues with monoclonal antibodies. J Histochem Cytochem. 1995;43:313–20. doi: 10.1177/43.3.7868861. [DOI] [PubMed] [Google Scholar]
- 85.Chen JW, Murphy TL, Willingham MC, et al. Identification of two lysosomal membrane glycoproteins. J Cell Biol. 1985;101:85–95. doi: 10.1083/jcb.101.1.85. [DOI] [PMC free article] [PubMed] [Google Scholar]
- 86.Ho MK, Springer TA. Tissue distribution, structural characterization, and biosynthesis of Mac-3, a macrophage surface glycoprotein exhibiting molecular weight heterogeneity. J Biol Chem. 1983;258:636–42. [PubMed] [Google Scholar]
- 87.Flotte TJ, Springer TA, Thorbecke GJ. Dendritic cell and macrophage staining by monoclonal antibodies in tissue sections and epidermal sheets. Am J Pathol. 1983;111:112–24. [PMC free article] [PubMed] [Google Scholar]
- 88.Havenith CE, Askew D, Walker WS. Mouse resident microglia: isolation and characterization of immunoregulatory properties with naive CD4 + and CD8 + T-cells. Glia. 1998;22:348–59. [PubMed] [Google Scholar]
- 89.Rossi CP, Delcroix M, Huitinga I, et al. Role of macrophages during Theiler’s virus infection. J Virol. 1997;71:3336–40. doi: 10.1128/jvi.71.4.3336-3340.1997. [DOI] [PMC free article] [PubMed] [Google Scholar]
Associated Data
This section collects any data citations, data availability statements, or supplementary materials included in this article.
Supplementary Materials
Official gene symbols, q-values, and relative fold changes for all 1210 probe sets differentially expressed between TMEV-infected and mock-infected mice in the time course of TME at a false discovery rate of 1.0%.
Results of the functional annotation clustering of all 1001 differentially expressed genes. The table shows the functional annotation clusters containing more than 50% significantly enriched gene ontology terms at a false discovery rate of 1.0%.