

Abstract
The ability of cells to maintain pH homeostasis in response to environmental changes has elicited interest in basic and applied research and has prompted the development of methods for intracellular pH measurements. Many traditional methods provide information at population level and thus the average values of the studied cell physiological phenomena, excluding the fact that cell cultures are very heterogeneous. Single-cell analysis, on the other hand, offers more detailed insight into population variability, thereby facilitating a considerably deeper understanding of cell physiology. Although microscopy methods can address this issue, they suffer from limitations in terms of the small number of individual cells that can be studied and complicated image processing. We developed a noninvasive high-throughput method that employs flow cytometry to analyze large populations of cells that express pHluorin, a genetically encoded ratiometric fluorescent probe that is sensitive to pH. The method described here enables measurement of the intracellular pH of single cells with high sensitivity and speed, which is a clear improvement compared to previously published methods that either require pretreatment of the cells, measure cell populations, or require complex data analysis. The ratios of fluorescence intensities, which correlate to the intracellular pH, are independent of the expression levels of the pH probe, making the use of transiently or extrachromosomally expressed probes possible. We conducted an experiment on the kinetics of the pH homeostasis of Saccharomyces cerevisiae cultures grown to a stationary phase after ethanol or glucose addition and after exposure to weak acid stress and glucose pulse. Minor populations with pH homeostasis behaving differently upon treatments were identified.
INTRODUCTION
Yeasts are widely used to produce commercially important compounds such as pharmaceutical agents, enzymes for food industry, bioethanol, and chemicals, including organic acids. Nutrient deficiency during fermentation and extracellular acidification due to acid production can affect intracellular pH (pHi) (1–3). Characterizing the underlying mechanisms that cause and affect intracellular acidification and the molecular basis of pH homeostasis is important because such understanding also enables the optimization of industrial processes. pHi is an important indicator of cell fitness and affects product synthesis and quality (4–6). There is an urgent need for the sensitive, rapid, and accurate recording of pHi.
Techniques that are based on the fluorescence spectra of compounds in a cellular environment present promising results. In addition to pH-sensitive fluorescent dyes (e.g., carboxy SNARF-4F [4, 7], 5,6-carboxyfluorescein [8–10], and 9-aminoacridine [11]), noninvasive pHi measurement techniques have been developed that apply recombinant pH-sensitive fluorescent proteins, pHluorin (12), RaVC (13), pHRed (14), and pHluorin2 (15). All pHluorin-based probes have a characteristic bimodal excitation spectrum, with a dose-dependent decrease in excitation at 395 nm and an increase in excitation at 475 nm with increasing acidity. This feature is an important advantage over the attributes of a single-wavelength probe, such as ecliptic pHluorin (12), because it endows ratiometric probes resistance to photobleaching and to variability of indicator loading and leakage (16). pHluorins are highly selective for protons with good signal-to-noise ratios, they provide high temporal and spatial resolutions and exhibit low cell toxicity, making them ideal proteins for quantifying the pHi in living cells. Moreover, pHluorins are superior to dyes because the former is produced and applied directly in the cellular environment under analysis and no extra treatment of cells is required. When fused to a targeting peptide or protein, a pH sensor can be spatially distributed within a cell, enabling pH monitoring within subcellular structures. For instance, when linked to organelle-specific proteins, a synapto-pHluorin was targeted toward vesicles (12), mt-pHluorin toward the mitochondria in Saccharomyces cerevisiae (17), and pHluorin-NLS toward the nuclei in Schizosaccharomyces pombe (18).
Thus far, several techniques have been used to decipher the signals of fluorescent pH probes. Fluorescence spectroscopy is the most extensively applied technique for analyzing pHluorin in yeasts (6, 17, 19, 20). Although spectroscopy rapidly records the average pHi of a population, it provides insufficient single-cell information. To obtain spatial distribution and a detailed mapping of the pH in single cells, researchers have used pHluorin in combination with fluorescence microscopy (12, 13, 17, 18, 21, 22). Despite the advantages of this approach, analyzing the images of individual cells is laborious and time-consuming even with the aid of software programs (23). A good alternative to spectroscopy and microscopy is flow cytometry, which combines rapid online analysis and the acquisition of multi-parameter results at the single-cell level for each cell in a population. This method also enables cell sorting (4, 7, 8). A good demonstration of the effectiveness of flow cytometry is that provided by Valli et al. (4). These authors improved lactic acid production by screening S. cerevisiae cells that maintain the highest pHi by using a pH-dependent fluorescent dye, carboxy SNARF-4F (18).
In the present study, we sought to develop a rapid, noninvasive method for pHi measurements to determine the limits of cellular pH homeostasis. We report here a method for monitoring pH homeostasis on the basis of the transgenic pH probes pHluorin and pHluorin2. The fluorescence intensities of the bimodal spectra of the two probes were analyzed by ratiometric flow cytometry. This method enables pHi assessment with not only high sensitivity but also extraordinarily high speed in data acquisition and processing. Its ease of use and the applicability of the transgenic cellular pH sensor make it an attractive tool for studying pH homeostasis at high throughput. We assessed the functionality of the method by examining the pH homeostasis dynamics of yeast S. cerevisiae exposed to various stresses. Our results demonstrate that the method effectively detects and quantifies the pHi of subpopulations.
MATERIALS AND METHODS
Yeast strains and plasmids.
Plasmid p-pHluorin2-LexA-AD (see Fig. S1 in the supplemental material) was constructed on the backbone of plasmid pYX022 (R&D Systems, Wiesbaden, Germany). It contains a yeast codon-optimized pHluorin2 gene (15) (GeneArt/Invitrogen) under the control of the modified GAL1 promoter with eight copies of a LexA operator (source plasmid pSH18-34), as well as a fusion gene that consists of a LexA+SV40-NLS+B42-transcription activation domain (24) under the control of the MET17 promoter. The lexA gene originates from plasmid pEG202 and the B42-activation domain from pJG4-5 (24). The LexA-NLS-AD fusion construct, which activates the expression of pHluorin2, is expressed in the absence of methionine. This system enables the high-level expression of pHluorin2 from a genome-integrated construct. The advantages derived from the integrative system include also the stability of the expression construct and low expression variability within cell population.
Yeast strain H4307 was constructed by transforming strain CEN.PK102-5B (ura3-52 his3-Δ1 leu2-3,112 TRP1 MAL2-8c SUC2; P. Kötter, Institute of Microbiology, J. W. Goethe Universität) with NsiI-linearized plasmid p-pHluorin2-LexA-AD. The NsiI site is in the 3′-untranslated region of the HIS3 selection marker gene in the plasmid and the linearization in this site allows targeting the plasmid into the his3-Δ1 locus of the transformed strain via homologous recombination. The transformation was performed by a standard lithium acetate method, and transformants were selected by growth in the absence of histidine. Fluorescence microscopy was performed to verify the resultant strain for the high-level stable expression of pHluorin2.
Plasmid pYES2-PACT1-pHluorin (17), which contains a gene coding for a pHluorin (12), was a gift from G. Smits (University of Amsterdam, Amsterdam, Netherlands). The construction of strain H3909 was described by Toivari et al. (25). Briefly, the pHluorin gene was cloned into vector B2158, a modified vector from pYX242 (R&D Systems, London, United Kingdom), as previously described for B2159 (26) with a constitutive TPI1 promoter, resulting in plasmid pMV118 (see Fig. S1 in the supplemental material). S. cerevisiae strain FY834 (27) was used for recombination cloning. pMV118 was introduced into the Gre3p-deficient control strain, producing strain H3909 (25).
Ratiometric flow cytometry.
For ratiometric flow cytometry, we used a CyFlow Space cytometer (Partec, Germany) equipped with split optics for 405- and 488-nm light path lines. For the dual excitation of all pHluorin-based ratiometric pH probes, the excitation sources used were a blue solid-state laser that emits 50 mW of light at 488 nm and a violet diode laser that emits 100 mW of light at 405 nm. After excitation with 488-nm laser light, green fluorescence was detected using a standard 536/40-nm bandwidth band-pass filter (F488-nm channel). To collect the fluorescence signals after excitation with 405-nm laser light, a 480-nm dichroic mirror, and a 520/20-nm bandwidth band-pass filter (F405-nm channel) were used (Fig. 1A). A side-scatter signal was used as the trigger signal. Gated yeast cells were analyzed at low rate settings of ∼400 cells s−1, and at least 20,000 cells were analyzed. Kinetics and changes in pH probe fluorescence over time were analyzed for 5 to 10 min at low rate settings of ∼200 cells s−1.
Fig 1.

In situ calibration of pHluorin2 with ratiometric flow cytometry. (A) The optical system of a flow cytometer was adapted to analyze ratiometric pH probes based on pHluorin. The figure shows emission optics after excitation with a 405-nm laser and a 488-nm laser with dichroic mirrors and filters. A dichroic mirror (DM480A) and a filter (EM520/20) for the emission light path at 405-nm excitation differ from prefabricated versions. (B and C) Overlay of two-dimensional plots of F405-nm versus F488-nm fluorescence (B) and histogram of the fluorescence intensity ratios (i.e., F405-nm/F488-nm) at a defined pH (C). Yeast H4307 cells were washed, resuspended in calibration buffers (pH 5.2 to 8.5), and treated with nigericin for 15 min before analysis. (D and E) Mean values of fluorescence ratios (D) and their logarithms (according to equation 2) versus buffer pH (E). A pHluorin2 pKa of 7.1 was calculated from a calibration curve.
Data are presented in list mode as pulse height signals (3 or 4 decades each on a logarithmic scale) and analyzed with FlowJo software (Tree Star). To record the signal after excitation at 405 and 488 nm, photomultipliers were set to obtain mean fluorescence intensity at an arbitrary value 10. The fluorescence intensities of negative control (nontransformed yeast) were below the arbitrary value 0.1, which gives a signal-to-noise ratio of 100. The ratios of two fluorescence parameters (i.e., F405-nm and F488-nm) were calculated for every cell by dividing the emission signals. To correlate ratios with pH, we generated a calibration curve that links fluorescence intensity ratios to pH, as described previously (13, 22), with minor modifications. The reader is referred to the in situ calibration section. A kinetic assay involves recording the baseline fluorescence ratios of F405-nm and F488-nm in the gated population for 30 s. The run was paused and a cell suspension was exposed to various stresses. The run was continued ∼1 min after treatment, and the fluorescence ratio was recorded up to the end of the experimental period. The pHi was calculated from the fluorescence intensity ratio and plotted against time.
Confocal laser scanning microscopy.
A Leica TCS SP5 laser scanning microscope mounted on a Leica DMI 6000 CS inverted microscope (Leica Microsystems, Germany) was used for imaging. The inverted microscope is equipped with an HCX PL APO 63× (NA 1.4) oil immersion objective lens.
For sequential excitation, a 50-mW 405-nm diode laser and a 476-nm line of a 25-mW argon laser were used (see Fig. S6 in the supplemental material). Laser power levels of 14 and 17% were adopted for the diode laser and argon laser, respectively. Successive images excited at 405 and 476 nm were captured within 1.2 s of each other. The fluorescence emission was detected at 500 to 530 nm. The image resolution was 512 × 512, the imaging speed was 400 Hz, and a ×4 magnification was used to obtain pixel dimensions of 120 × 120 nm.
Image processing.
To generate pseudocolored images, the raw 405- and 476-nm images were first smoothed to reduce noise using the ImageJ software function process/smooth; the background was corrected using the ImageJ software function process/subtract background (http://rsbweb.nih.gov/ij/). Visually, the pH profile of the yeast cells was expressed by converting the gray scale of the pixel-by-pixel calculated ratio image into pseudocolors using custom-written software. The software divides pixel-by-pixel fluorescence intensities of images taken after excitation at 405 and 476 nm. The background values are excluded from calculations. Generated ratio values assigned to pixels are then converted to pH values using the calibration curve. Different colors were assigned to defined pH values in accordance with in situ calibration curve.
pH measurements.
Cytosolic pH was measured using pHluorin and pHluorin2. A bimodal excitation spectrum with peaks at 395 and 475 nm is characteristic of pHluorins, with emission at 509 nm. For microscopic analysis, a cell suspension (0.2 ml) was placed in eight-well microscopic chambers (Ibidi, Germany) and allowed to settle for 5 min before imaging or treatment. For flow cytometry, the cells were diluted in medium (2 ml) in which yeasts had been cultivated (referred to as “spent medium” hereafter); the medium was used to obtain a density suitable for analysis (400 cells s−1 at low speed).
The fluorescence intensities after excitation at 405 and 476 nm (488 nm for flow cytometry) were recorded and converted to pH values using equations 1 and 2 (13, 22):
| (1) |
where Fi405-nm and Fi476-nm are the fluorescence intensities of the cells, and Fbg405-nm and Fbg476-nm denote the average background fluorescence intensities.
| (2) |
Here, Ri is the emission ratio at a given pH, and RpHmin and RpHmax are the limits for the ratio at extremely acidic (pH 5.2) and alkaline (pH 8.5) pH, respectively. These limits were individually determined for each set of experiments. RpHmin and RpHmax were obtained by incubating yeast cells in buffer solutions with pH values of 5.2 and 8.5 with freshly prepared nigericin (10 μM).
In situ calibration.
For each set of experiments, calibration was performed, as described by Bagar et al. (13, 22), with minor modifications. The H4307 yeast strain was grown in modified synthetic complete medium (28) without methionine (SC-Met), and the H3909 yeast strain was grown in synthetic complete medium (28) without leucine and uracil (SC-Leu-Ura) with 20 g of glucose liter−1 to an optical density at 600 nm (OD600) of 2. The cells were divided and placed into tubes (0.25 ml), washed, and resuspended in 0.25 ml of calibration buffers with a pH range of 5.2 to 8.5. The calibration buffers contained 50 mM MES (morpholineethanesulfonic acid), 50 mM HEPES, 50 mM KCl, 50 mM NaCl, 200 mM ammonium acetate, 10 mM NaN3, and 10 mM 2-deoxyglucose; the pH was adjusted with NaOH or HCl (29). After the addition of freshly prepared ionophore nigericin (10 μM, final concentration; Sigma), the cells were incubated at least 15 min to equilibrate pHi with external pH (pHex). The cells were subsequently analyzed by ratiometric flow cytometry and fluorescence ratio imaging microscopy. A calibration curve was constructed by plotting the fluorescence ratio as a function of buffer pH using equations 1 and 2. The pKa of pHluorin and pHluorin2 was determined from the calibration curves.
Conditions applied to living cells.
All chemicals were prepared as 10× or 20× stock solutions in water. Sorbic acid (5 or 10 mM) was used for weak acid stress. The H4307 yeast strain was grown to OD600 of 2 in SC-Met with 20 g of glucose liter−1 and treated with sorbic acid. To analyze the effect of nutrients on the pHi of stationary cells, the H4307 strain was grown for 24 h in SC-Met with 10 g of glucose liter−1 for the strain to reach a stationary phase. Glucose, ethanol, or glycerol (20 g liter−1) was added, and the pHi over time was assessed. For exposure to weak acid stress and nutrient addition, the samples were analyzed before treatment and 5 to 10 min after treatment.
To determine the influence of pHex on pHi, the H4307 strain was grown to an OD600 of 2 in yeast SC-Met medium with 20 g of glucose liter−1, centrifuged, and shifted to Verduyin medium (30) with 20 g liter−1 glucose and buffered from pH 3 to 8 with K-biphthalate or K-phosphate. The samples were analyzed after 30 min and 1 h.
Glucose-starved and nonstarved cells were prepared as described by Orij et al. (17). Briefly, the H4307 strain was grown to an OD600 of 2 in SC-Met with medium containing 20 g of glucose liter−1. The cells were divided, washed once with SC-Met medium with or without glucose, and incubated in the same medium. The cells were analyzed after 1 h. The glucose-starved cells were then pulsed with glucose (20 g liter−1), and the pHi was monitored.
Statistical analysis.
Depicted flow cytometry plots are representative results of three independent measurements. A representative pseudocolored image calculated from sequentially acquired raw images was selected from a collection of at least eight pseudocolored images per experiment. The means of the Ri and pHi with standard deviations were calculated from a minimum of eight images. Each set of experiments was independently repeated at least twice. For graph design and statistical analysis, GraphPad Prism 5 software was used. An unpaired two-tailed Student t test was used for statistical comparison between groups, and P values of <0.05 (*), <0.01 (**), and <0.001 (***) were considered statistically significant.
RESULTS
The ratiometric pH probe can be analyzed by ratiometric flow cytometry.
We developed a high-throughput method to measure the pHi in live, unperturbed yeast cells at the single-cell level. The method exploits ratiometric flow cytometry and involves the use of pHluorin (12) or pHluorin2 (15) as pHi indicators. To analyze the fluorescence of a dual excitation ratiometric pHluorin, the optics of a flow cytometer (CyFlow Space) was adapted. The light paths of excitation at 405 and 488 nm and the emission optics used for pHi measurements are shown in Fig. 1A. To record fluorescence at a 405-nm excitation, a dichroic mirror that reflects light below 480 nm (DM480A) and the emission band-pass filter EM520/20 were used. The 488-nm light path line was prefabricated.
Prior to analysis, the cells were diluted with the spent medium where the yeast had been grown. We observed that dilution with fresh medium significantly affected the pHi (data not shown). The cell suspension was analyzed at a rate of ∼400 cells s−1. A characteristic fluorescence peak was detected at the F405-nm and F488-nm channels (see Fig. S2A in the supplemental material). A two-dimensional dot plot of F405-nm versus F488-nm showed that the fluorescence signals were grouped, forming a line (see Fig. S2B in the supplemental material). The ratio of the fluorescence intensities of F405-nm to F488-nm plotted as the ratio height signal in logarithmic mode generated a narrow peak (see Fig. S2C in the supplemental material). We confirmed that ratiometric flow cytometry with minor changes in optics can be used to detect pHluorin fluorescence. The method also extends beyond microscopy for high-throughput analysis. In less than 2 min, we could analyze the fluorescence signals of 50,000 cells, as well as rapidly and automatically post-process the obtained data.
Expression level of probe does not affect pHi quantification.
Two yeast strains were used to validate the proposed method: strain H3909, which expresses pHluorin from autonomously replicating plasmid pMV118, and strain H4307, which has a single copy of genome-integrated pHluorin2 encoding gene. Integration into the genome ensured stable and equal, less varied expression of pHluorin, thereby eliminating variations among cells. The calibration curves were made for the strains H3909 (pHluorin expressed from plasmid) and H4307 (integrant expression of pHluorin2) to evaluate the effect of the expected more heterogenous versus more stable pH probe expression, respectively, on pHi quantification.
In situ calibration was performed to correlate the calculated ratio of fluorescence intensities (Fig. 1B to D) with cell pHi. The cells were permeabilized with nigericin in the presence of calibration buffers with defined pH. An incubation period of 15 min with nigericin was enough to equalize pHi with pHex (see Fig. S3 in the supplemental material). Incubation periods of 1 and 2 h exerted no effect on the calibration. The ratios of emission intensities detected after excitation at 405 and 488 nm were calculated on the basis of equation 1 (see Materials and Methods). To perform the calibration, the mean ratio from ∼20,000 cells was calculated at each buffer pH and plotted against pHex. A logarithmic plot of mean ratios plotted against pHex is shown in Fig. 1E. The pKa determined in situ for pHluorin2 was 7.1. The range of pH values that can be reliably measured is limited by the properties of pHluorin (13, 17), which exhibits a plateau at pH values lower than 5.5 (Fig. 1D) and deteriorates at pH values above 8.5 (13, 17). The optimal linear response to pH falls between pH 5.5 and 8.0, a value sufficient to measure the pH currently reported in living cells (31), with the exception of vacuolar pH, which can reach a pH from 5.2 to 6.0 (18, 32). pHluorin2 displayed pH sensitivity in the normal physiological range within living cells; this sensitivity corresponds to previously described values (15).
We hypothesized that the ratiometric nature of pHluorin compensates for its uneven expression in yeast cells. As expected, the expression of pHluorin from an autonomously replicating plasmid generated a very heterogeneous H3909 strain population, as revealed by the fluorescent probes and confirmed by microscopy and flow cytometry (see Fig. S4A in the supplemental material). The distribution of fluorescence signals for the H3909 strain population was significantly wider than that for the integrated H4307 strain (see Fig. S4B in the supplemental material). Nevertheless, the calculated pseudocolored image and the F405-nm/F488-nm fluorescence ratios showed uniform pHi throughout the population, regardless of expression and type of pH probe (see Fig. S5 in the supplemental material). The ratiometric flow cytometry measurements were also confirmed by sequential scanning confocal microscopy for the H4307 and H3909 strains (see Fig. S6 in the supplemental material). On the basis of the calibrations, we determined that the pH sensitivity of pHluorin and pHluorin2 is similar to a pKa of 7.1 (Fig. 1; see also Fig. S3, S5, and S6 in the supplemental material). Furthermore, the expression level of the transgenic ratiometric probes exerted no effect on pHi quantification, confirming the superiority of ratiometric probes over single-wavelength probes, for which homogeneous expression is mandatory for accurate pHi assessment.
Near-neutral pHi is maintained after exposure to pHex between pH 3.0 and 8.0.
S. cerevisiae is highly resistant to acidic environments and can grow in cultures with a pH as low as 2.5 (33). We determined whether the method can identify minor pHi changes linked to pHex. Cells grown in SC-Met with 20 g of glucose liter−1 were harvested and resuspended in buffered Verduyin media with glucose. After 30 min to 1 h of cultivation, the pHi was assessed by ratiometric flow cytometry (Fig. 2A) and microscopy (Fig. 2B). Yeasts incubated in medium with pH 3 to 8 maintained a pHi from 7 to 7.5. The pHi of the cells incubated in pH 3 medium was on average 7, and that of the cells incubated in pH 8 medium was 7.5. These results were confirmed by confocal microscopy analysis (Fig. 2B). All in all, the method we developed is sufficiently sensitive to distinguish relatively small differences in the pHi of S. cerevisiae cells.
Fig 2.

Growth conditions affect pH homeostasis. (A and B) pHex exerted only a minimal effect on the pHi of S. cerevisiae, as revealed by flow cytometry (A) and sequential confocal microscopy (B). H4307 cells were harvested, washed, and incubated in buffered Verduyin medium with glucose for 30 min to 1 h. (A) Histograms of fluorescence ratios against calibration generated at the same time. (B) Pseudocolored images (above) and calculated pHi (below). (C and D) Glucose starvation acidified cells. Yeast cells were harvested and diluted in SC-Met media with or without 20 g of glucose liter−1. About 30 min to 1 h after a medium change, the pHi was analyzed by flow cytometry (C) and microscopy (D). (C) Histograms of ratios plotted against calibration. (D) Pseudocolored images (left) and calculated pHi (right) of glucose-starved and nonstarved yeasts. Pseudocolored images were calculated from images taken at 405- and 476-nm excitations. Different colors were assigned to defined pH values in accordance with calculated in situ calibration curves (blue alkaline; red acidic). Each point on the graphs presents a pHi calculated from the ratio (Ri) between the emission intensities (collected at 500 to 550 nm) at 405- and 476-nm excitations for each image.
Glucose starvation acidifies the cytosol.
Glucose starvation causes the acidification of yeast cells (3, 17, 19). We analyzed the pHi of cells grown in media with or without glucose. Cells grown in SC-Met with 20 g of glucose liter−1 were harvested, washed, and resuspended in SC-Met with or without glucose. Just before analysis, the cells were diluted in the spent media to obtain appropriate the cell density for cytometric analysis. The cytosolic pH of the cells grown in media with glucose (nonstarved) was on average 7, and the pHi of the starved cells incubated for 1 h in media without glucose was on average 6 (Fig. 2C), as confirmed by microscopy (Fig. 2D). A high degree of heterogeneity in the pHi of starved cells ranging from 5.5 to 6.5 was revealed by cytometry, and the pseudocolored image was calculated from 405- and 476-nm microscopic images.
We tested the performance of our method in recapturing the kinetics of the alkalinization of cytosol after a rapid application of a glucose pulse (17). The pHi of the starved cells incubated in SC-Met media without glucose for 1 h was on average 6.0 (Fig. 2C). After the application of glucose pulse, the pHi increased to a pH higher than 7 in 3 min, as determined by cytometry (Fig. 3A) and microscopy (Fig. 3B; see also Fig. S7A in the supplemental material). The limitations of our flow cytometry-based method prevented the measurement of pHi the first minute after glucose addition, but certain proportions of cells were identified to have a lower-than-initial pH 1 min after the treatment (Fig. 3A). In addition, two populations with different dynamics of pH homeostasis were observed. Some cells belonging to a minor population reacted to the glucose pulse faster than did the rest of the population (Fig. 3A). A mixed population of cells is also shown in the pseudocolored images (Fig. 3B). At 2 min after glucose pulse, a pHi of ∼7 was detected in fewer than half of the cells. The main improvement of our results over previously published findings is that the pHi of numerous individual cells could be measured by cytometry while simultaneously identifying minor cell populations with differentially behaving pH homeostasis. Interestingly, the previously reported (17) short transient decrease in pHi upon glucose addition was also partially captured by our ratiometric cytometry method where small proportion of the cell population exhibited ratios below the pHi values detected at an initial treatment time (Fig. 3A).
Fig 3.

Dynamic changes in pHi. (A and B) The application of glucose to starved cells alkalinized pHi. Yeast H4307 cells grown for 1 h in SC-Met medium without glucose were fed with 20 g of glucose liter−1. The pHi measurement was followed by ratiometric flow cytometry (A) and microscopy (B). (A) Ratios of F405-nm/F488-nm fluorescence over time were plotted against calibration. (B) Pseudocolored images at indicated time points after glucose pulse application. (C and D) Weak sorbic acid stress acidified cytosol. Yeast H4307 cells grown in SC-Met with 20 g of glucose liter−1 were treated with 5 and 10 mM sorbic acid. (C) The analysis of pHi dynamics was followed with cytometry, and the fluorescence ratios over time plotted against calibration are shown. (D) Pseudocolored images calculated from images taken at 405- and 476-nm excitations at the indicated time points. The arrow indicates the addition of glucose or sorbic acid. The transient pHi decrease is indicated with star. At least 50,000 cells over time were analyzed.
pHi dynamics during perturbations of pH homeostasis.
To evaluate our method as a tool for monitoring rapid changes in pH homeostasis, we selected two different well-characterized phenomena: weak acid stress that acidifies cytosol and glucose pulses applied to glucose-starved cells. Ullah et al. (20) showed that weak acids, especially lipophilic sorbic and benzoic acid, readily diffuse over the plasma membrane, dissociate at high cytoplasm pH, instantly acidify cytosol, and inhibit cell growth. To assay pH homeostasis under weak acid stress, the H4307 cells grown in SC-Met medium with 20 g of glucose liter−1 were treated with 5 and 10 mM sorbic acid. The 5 mM sorbic acid triggered a gradual pHi drop from 7.5 to 6.8 in 10 min, as determined by flow cytometry (Fig. 3C). In contrast, microscopy showed an immediate decrease in pHi from 7.5 to 6.3 30 s after acid addition; this lasted less than a minute (Fig. 3D; see also Fig. S7B in the supplemental material), followed by a pHi recovery to 7.0. Given the cytometer setup, analyzing pHi dynamics during the first minute after treatment was impossible. Therefore, the immediate transient pHi drop that was recorded via microscopy may have been missed. Pulsing with 10 mM sorbic acid caused an immediate temporal decrease in pHi from 7.5 to 6.0 determined by flow cytometry, a decrease that lasted almost 2 min, followed by a rise in pHi to 6.8. Subsequently, the pHi gradually dropped to 6.5 in 5 min after acid pulse application (Fig. 3C). We also observed two subpopulations that differed in temporal recovery rate after pulsing with 10 mM sorbic acid. A minor, fast-recovery population and a major, slow-recovery population were detected (Fig. 3C). Similar to the results on the application of glucose pulse to starved cells, the high-throughput analysis revealed small populations in which pH homeostasis proceeded in a different manner within most of the cells; such a difference would be difficult to detect by microscopic analysis.
Yeast culture in stationary phase.
pHi is a good indicator of cell fitness. Several research groups (4, 7, 8, 17) correlated the acidification of cytosol to inhibited yeast growth. Cells in stationary phase maintain a lower pHi than do those in exponential growth phase (8), and the pH homeostasis in the former is more sensitive to extracellular perturbations (7). We analyzed yeasts grown to a stationary phase by ratiometric flow cytometry (Fig. 4) and confocal microscopy (see Fig. S8 in the supplemental material). Two cell populations clearly differed in pHi: that of the larger population was 5.2, whereas that of the minor population was 6.5 (Fig. 4A). We fed the stationary cells with glycerol, ethanol, or glucose. The subpopulation of cells with pHi 5.2 gradually (but not completely) diminished during the first 10 min after 20 g liter−1 ethanol addition, whereas the subpopulation with pHi 6.5 persisted, as revealed by flow cytometry (Fig. 4C). Adding 20 g of glycerol liter−1 to the starved cells imposed no detectable effect on pHi during 10 min of analysis (Fig. 4B). As expected (34), adding 20 g of glucose liter−1 to the stationary cells increased the pHi to a value >7 for most of the cells (Fig. 4D). The minor population of cells with pHi 6.5 was still detected 5 min after glucose addition. These results demonstrate that stationary-phase cells with pHi below 5.5 remain viable, with active pH homeostasis that can react to change in external conditions. Simultaneously, the pHi dynamics of stationary cells were analyzed by sequential confocal microscopy using the same treatments as those used for cytometry (see Fig. S8 in the supplemental material). The observed dynamics of pH homeostasis was similar to that determined by cytometry after addition of glycerol, ethanol, or glucose.
Fig 4.
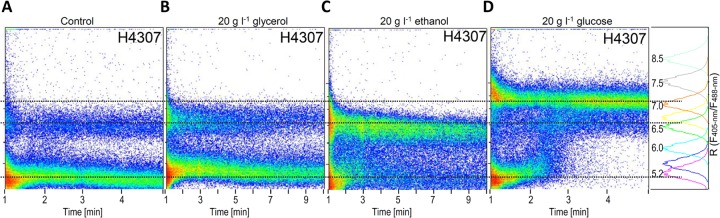
Two distinct populations with different pHi levels were detected in the stationary phase. The subpopulations of steady-state cells behaved differently after the addition of glycerol (B), ethanol (C), or glucose (D). Cells in stationary phase were diluted in spent media to obtain a 2-ml cell suspension, and then glycerol, ethanol, or glucose (20 g liter−1) was added. Fluorescence changes after addition were monitored by cytometry at a low rate of 200 cells s−1. (A) A cell suspension fed with water was used as the control. The fluorescence ratios over time were plotted against calibration. At least 100,000 cells over time were analyzed.
DISCUSSION
Cytosolic pH and the pH of the organelles of any living cell are important signaling parameters that regulate metabolic processes, redox states, and molecular transport over membranes (reviewed in reference 3). Our comprehension of what happens to the pHi under real-life conditions, such as fermentation, remains poor. An imperative requirement, therefore, is to visualize pH dynamics to understand the basis of pH homeostasis. Such understanding enables the optimization of industrial processes (4, 8, 35) or the exploitation of pH homeostasis machinery as a therapeutic target. pHi has been measured through a wide range of monitoring techniques, from cell loading with pH-selective fluorescent dyes (4, 7–11) to the use of green fluorescent protein-based sensors (12–15). These approaches considerably simplify measurement, especially when sensors are expressed in stably transformed cells. Ratiometric emission probes are considerably more resistant to photobleaching and pH-unrelated low signal artifacts than are intensity-based pH sensitivity probes (36). As is clear from our data as well as previously published data, the level of probe expression does not affect pHi quantification (see Fig. S4 in the supplemental material). Thus, the variability of fluorescence intensity that might arise due the transformation instability is eliminated with a ratiometric pH probe. Therefore, a combination of pHluorin and flow cytometry could enable efficient analysis of also transiently transformed cells, even in a cell population that contains nontransformed cells; a similar approach is used for transiently transfected cell lines. The use of our method eliminates the need for isolation of transformed cells, which can be a benefit particularly for industrial strains for which antibiotic resistance selection is not an option.
Methods for investigating entire populations (e.g., spectrofluorometry) (15–18) provide only an average measurement of studied parameters. Single-cell analysis by fluorescence microscopy offers spatial and temporal insights into population variability (12, 13, 17). The primary drawback of this technique is the need to post-process images to evaluate the subpopulation content. Ratiometric flow cytometry combines high-throughput analysis at the single-cell level with visualization of pHi distribution within yeast populations (4, 7, 8). The combination of genetically encoded ratiometric pH probes and flow cytometry is an effective approach. Ratiometric flow cytometry goes beyond microscopy for high-throughput analysis and screening with fast and automatic post-processing of obtained data. Conversely, it does not allow for the monitoring of particular individual cells over time, making it a complementary or alternative solution rather than a replacement for microscopy techniques, depending on particular applications.
pHi appeared to be tightly regulated and maintained around neutral levels in pHex values broadly ranging from pH 3 to 8 (Fig. 2A and B), which indicates that S. cerevisiae possesses robust machinery for pHi homeostasis (17, 19, 29, 32), similar to A. niger (13). Our analysis also demonstrates that the proposed method is sufficiently sensitive to distinguish small differences in the pHi of S. cerevisiae cells.
To validate the proposed method, we selected two well-characterized phenomena with rapid changes in pHi: pHi alkalinization and pHi acidification. Yeast cells that suffer from glucose depletion stop growing and fail to maintain cytosolic pH (3) (Fig. 2C and D). The application of glucose pulses to glucose-starved cells has been shown to increase pHi (17, 32) and the same is seen in our data (Fig. 3A and B; see also Fig. S7A in the supplemental material). P-type and V-type ATPases are primary contributors to cytosolic and vacuolar pH regulation (37). In addition, glucose indirectly regulates the phosphorylation of plasma membrane P-type ATPase Pma1p (38), thereby increasing its affinity for ATP and Vmax (39). The presence of fermentable sugar therefore activates Pma1p, which consequently leads to cytosol alkalinization.
The other phenomenon we analyzed was weak acid stress. Weak acids trigger rapid decreases in pHi not only in yeasts (17, 20) but also in filamentous fungi (13). Highly dynamic pH homeostasis adjustment occurred after the application of 10 mM sorbic acid, as observed by ratiometric flow cytometry (Fig. 3C). Less intense dynamics with similar patterns of pHi after exposure to 2 mM (data not shown) or 5 mM sorbic acid (Fig. 3C and D; see also Fig. S7B in the supplemental material) were observed that were similar to the findings of Ullah et al. (20) and Orij et al. (17), who applied 2 mM sorbic acid, used pHluorin as the probe, and conducted spectrofluorometry.
The main contribution of the current study is that the proposed method enables pHi measurement of numerous individual cells and thus enables easy identification of minor cell populations with differentially behaving pH homeostasis, providing a powerful tool for analyzing population dynamics in different growth conditions. The high-throughput analysis enables the examination of >400 cells s−1 with high accuracy and reveals small populations that would be difficult to detect by microscopic analysis. The detailed examination of pHi changes over time after the application of glucose pulse to starved cells (Fig. 3A) or after weak acid exposure (Fig. 3C) revealed that the pH homeostasis of a small number of cells reacted to treatments faster than did the rest of cells. To our knowledge, this study is the first to report such a result even though it is readily visualized with microscopy (Fig. 3B and D). We could not completely exclude the possibility that the pH probe is sequestrated into organelles (e.g., vacuoles) since this was reported for A. niger to occur after 3 days of fermentation (13). Since the cytometry provides readout of fluorescence intensities for the whole cell, the generated subpopulations might be formed from cells with probe distributed within organelles with characteristic pH homeostasis. This possibility seems, however, unlikely since we did not observe any translocation of the pH probe into the vacuoles in our experimental setup with confocal microscopy (data not shown).
The preferred sources of carbon and energy for yeast cells are fermentable sugars, such as glucose. When glucose becomes limiting, cells enter a diauxic shift, followed by respiratory metabolism characterized by decreased growth rates. After ethanol has been used by the cells, the respiratory growth phase eventually leads to a stationary phase. Stationary-phase yeast cultures are heterogeneous and contain at least two different cell types (40). Similar to the findings reported by Weigert et al. (8), we showed that in stationary phase two yeast populations occur when it comes to pHi (Fig. 4A).
The pH homeostasis of stationary cells responded differently to the addition of glucose, which is used in glycolysis, and to the addition of ethanol, which is used in slow respiratory metabolism (Fig. 4B and D). Also, we showed that the pHi of stationary-phase cells and glucose-starved cells responds differently to glucose addition (Fig. 3A and 4D). The differences may be associated with the dissimilar states of pH homeostasis and overall metabolic statuses of the cells before glucose pulse. In the stationary phase, when the nutrients have been depleted and cells have acidified the medium, the cell metabolism has adjusted to the given conditions (41). For example, cells accumulate storage carbohydrates trehalose and glycogen (41). Medium composition also strongly affects pHi (42). Conversely, cells that are transferred from an exponential culture to a fresh medium without glucose are confronted with a different environment (i.e., different pHex and nutrient availability). Such cells differ in terms of metabolic status; for instance, they contain minimal amounts of storage carbohydrates (41). These differences likely influence pH homeostasis, and glucose addition leads to noticeably different outcomes as shown in Fig. 3 and 4.
A method that involves flow cytometry enables the detection of multiple fluorescence parameters for a single cell, high-throughput analysis, and rapid kinetic studies of pH homeostasis. Furthermore, all measurements are performed on unperturbed cells because genetically encoded pH probes are used. This method can be applied to the online analysis of living cells, thereby serving as an excellent tool for monitoring yeast cultivations at an industrial scale. The possibility of combining this method with efficient cell sorting based on various parameters can be used to enrich the desired characteristics in a population, as demonstrated by Valli et al. (4). The method can also be adapted to all unicellular organisms and cells that are readily transformed with transgenic pH probes.
Supplementary Material
ACKNOWLEDGMENTS
This research was supported by the Slovenian Research Agency and EN-FIST Centre of Excellence, by the Academy of Finland under the Finish Centre of Excellence in White Biotechnology–Green Chemistry program (grant 118573), and by an Academy of Finland grant (SA-Modubio 260957) to D.M.
We thank Marilyn Wiebe, Juha-Pekka Pitkänen, and Yvonne Nygård for help in the design of the experiments.
Footnotes
Published ahead of print 13 September 2013
Supplemental material for this article may be found at http://dx.doi.org/10.1128/AEM.02515-13.
REFERENCES
- 1.Liu C-G, Xue C, Lin Y-H, Bai F-W. 2012. Redox potential control and applications in microaerobic and anaerobic fermentations. Biotechnol. Adv. 31:257–265 [DOI] [PubMed] [Google Scholar]
- 2.Ktistakis NT. 2010. Lipid signaling and homeostasis: PA- is better than PA-H, but what about those PIPs? Sci. Signal. 3:pe46. [DOI] [PubMed] [Google Scholar]
- 3.Orij R, Brul S, Smits GJ. 2011. Intracellular pH is a tightly controlled signal in yeast. Biochim. Biophys. Acta 1810:933–944 [DOI] [PubMed] [Google Scholar]
- 4.Valli M, Sauer M, Branduardi P, Borth N, Porro D, Mattanovich D. 2006. Improvement of lactic acid production in Saccharomyces cerevisiae by cell sorting for high intracellular pH. Appl. Environ. Microbiol. 72:5492–5499 [DOI] [PMC free article] [PubMed] [Google Scholar]
- 5.Martani F, Fossati T, Posteri R, Signori L, Porro D, Branduardi P. 2013. Different response to acetic acid stress in Saccharomyces cerevisiae wild type and l-ascorbic acid producing strains. Yeast (Chichester, England) 30:365–378 [DOI] [PubMed] [Google Scholar]
- 6.Ullah A, Chandrasekaran G, Brul S, Smits GJ. 2013. Yeast adaptation to weak acids prevents futile energy expenditure. Front. Microbiol. 4:142. [DOI] [PMC free article] [PubMed] [Google Scholar]
- 7.Valli M, Sauer M, Branduardi P, Borth N, Porro D, Mattanovich D. 2005. Intracellular pH distribution in Saccharomyces cerevisiae cell populations, analyzed by flow cytometry. Appl. Environ. Microbiol. 71:1515–1521 [DOI] [PMC free article] [PubMed] [Google Scholar]
- 8.Weigert C, Steffler F, Kurz T, Shellhammer TH, Methner F-J. 2009. Application of a short intracellular pH method to flow cytometry for determining Saccharomyces cerevisiae vitality. Appl. Environ. Microbiol. 75:5615–5620 [DOI] [PMC free article] [PubMed] [Google Scholar]
- 9.Imai T, Ohno T. 1995. Measurement of yeast intracellular pH by image processing and the change it undergoes during growth phase. J. Biotechnol. 38:165–172 [DOI] [PubMed] [Google Scholar]
- 10.Imai T, Ohno T. 1995. The relationship between viability and intracellular pH in the yeast Saccharomyces cerevisiae. Appl. Environ. Microbiol. 61:3604–3608 [DOI] [PMC free article] [PubMed] [Google Scholar]
- 11.Sureshkumar GK, Mutharasan R. 2006. Intracellular pH responses of hybridoma and yeast to substrate addition and acid challenge. Ann. N. Y. Acad. Sci. 745:106–121 [DOI] [PubMed] [Google Scholar]
- 12.Miesenböck G, De Angelis DA, Rothman JE. 1998. Visualizing secretion and synaptic transmission with pH-sensitive green fluorescent proteins. Nature 394:192–195 [DOI] [PubMed] [Google Scholar]
- 13.Bagar T, Altenbach K, Read ND, Bencina M. 2009. Live-Cell imaging and measurement of intracellular pH in filamentous fungi using a genetically encoded ratiometric probe. Eukaryot. Cell 8:703–712 [DOI] [PMC free article] [PubMed] [Google Scholar]
- 14.Tantama M, Hung YP, Yellen G. 2011. Imaging intracellular pH in live cells with a genetically encoded red fluorescent protein sensor. J. Am. Chem. Soc. 133:10034–10037 [DOI] [PMC free article] [PubMed] [Google Scholar]
- 15.Mahon MJ. 2011. pHluorin2: an enhanced, ratiometric, pH-sensitive green fluorescent protein. Adv. Biosci. Biotechnol. 2:132–137 [DOI] [PMC free article] [PubMed] [Google Scholar]
- 16.O'Connor N, Silver RB. 2007. Ratio imaging: practical considerations for measuring intracellular Ca2+ and pH in living cells. Methods Cell Biol. 81:415–433 [DOI] [PubMed] [Google Scholar]
- 17.Orij R, Postmus J, Ter Beek A, Brul S, Smits GJ. 2009. In vivo measurement of cytosolic and mitochondrial pH using a pH-sensitive GFP derivative in Saccharomyces cerevisiae reveals a relation between intracellular pH and growth. Microbiology (Reading, England) 155:268–278 [DOI] [PubMed] [Google Scholar]
- 18.Karagiannis J, Young PG. 2001. Intracellular pH homeostasis during cell-cycle progression and growth state transition in Schizosaccharomyces pombe. J. Cell Sci. 114:2929–2941 [DOI] [PubMed] [Google Scholar]
- 19.Maresová L, Hosková B, Urbánková E, Chaloupka R, Sychrová H. 2010. New applications of pHluorin: measuring intracellular pH of prototrophic yeasts and determining changes in the buffering capacity of strains with affected potassium homeostasis. Yeast (Chichester, England) 27:317–325 [DOI] [PubMed] [Google Scholar]
- 20.Ullah A, Orij R, Brul S, Smits GJ. 2012. Quantitative analysis of the modes of growth inhibition by weak organic acids in Saccharomyces cerevisiae. Appl. Environ. Microbiol. 78:8377–8387 [DOI] [PMC free article] [PubMed] [Google Scholar]
- 21.Aabo T, Glückstad J, Siegumfeldt H, Arneborg N. 2011. Intracellular pH distribution as a cell health indicator in Saccharomyces cerevisiae. J. R. Soc. Interface 8:1635–1643 [DOI] [PMC free article] [PubMed] [Google Scholar]
- 22.Bagar T, Benčina M. 2012. Antiarrhythmic drug amiodarone displays antifungal activity, induces irregular calcium response and intracellular acidification of Aspergillus niger-amiodarone targets calcium and pH homeostasis of A. niger. Fungal Genet. Biol. 49:779–791 [DOI] [PubMed] [Google Scholar]
- 23.Gordon A, Colman-Lerner A, Chin TE, Benjamin KR, Yu RC, Brent R. 2007. Single-cell quantification of molecules and rates using open-source microscope-based cytometry. Nat. Methods 4:175–181 [DOI] [PubMed] [Google Scholar]
- 24.Gyuris J, Golemis E, Chertkov H, Brent R. 1993. Cdi1, a human G1 and S phase protein phosphatase that associates with Cdk2. Cell 75:791–803 [DOI] [PubMed] [Google Scholar]
- 25.Toivari M, Nygård Y, Kumpula E-P, Vehkomäki M-L, Benčina M, Valkonen M, Maaheimo H, Andberg M, Koivula A, Ruohonen L, Penttilä M, Wiebe MG. 2012. Metabolic engineering of Saccharomyces cerevisiae for bioconversion of d-xylose to d-xylonate. Metab. Eng. 14:427–436 [DOI] [PubMed] [Google Scholar]
- 26.Toivari MH, Ruohonen L, Richard P, Penttilä M, Wiebe MG. 2010. Saccharomyces cerevisiae engineered to produce d-xylonate. Appl. Microbiol. Biotechnol. 88:751–760 [DOI] [PubMed] [Google Scholar]
- 27.Winston F, Dollard C, Ricupero-Hovasse SL. 1995. Construction of a set of convenient Saccharomyces cerevisiae strains that are isogenic to S288C. Yeast (Chichester, England) 11:53–55 [DOI] [PubMed] [Google Scholar]
- 28.Amberg DC, Burke DJ, Strathern JN. 2005. Methods in yeast genetics: a laboratory course manual, 2005 edition. Cold Spring Harbor Laboratory, Cold Spring Harbor, NY [Google Scholar]
- 29.Brett CL, Tukaye DN, Mukherjee S, Rao R. 2005. The yeast endosomal Na+K+/H+ exchanger Nhx1 regulates cellular pH to control vesicle trafficking. Mol. Biol. Cell 16:1396–1405 [DOI] [PMC free article] [PubMed] [Google Scholar]
- 30.Verduyn C, Postma E, Scheffers WA, Van Dijken J, Van Dijken JP. 1992. Effect of benzoic acid on metabolic fluxes in yeasts: a continuous-culture study on the regulation of respiration and alcoholic fermentation. Yeast (Chichester, England) 8:501–517 [DOI] [PubMed] [Google Scholar]
- 31.Brett CL, Donowitz M, Rao R. 2006. Does the proteome encode organellar pH? FEBS Lett. 580:717–719 [DOI] [PubMed] [Google Scholar]
- 32.Martínez-Muñoz GA, Kane P. 2008. Vacuolar and plasma membrane proton pumps collaborate to achieve cytosolic pH homeostasis in yeast. J. Biol. Chem. 283:20309–20319 [DOI] [PMC free article] [PubMed] [Google Scholar]
- 33.Carmelo V, Bogaerts P, Sá-Correia I. 1996. Activity of plasma membrane H+-ATPase and expression of PMA1 and PMA2 genes in Saccharomyces cerevisiae cells grown at optimal and low pH. Arch. Microbiol. 166:315–320 [DOI] [PubMed] [Google Scholar]
- 34.Kresnowati MTAP, Suarez-Mendez CM, van Winden WA, van Gulik WM, Heijnen JJ. 2008. Quantitative physiological study of the fast dynamics in the intracellular pH of Saccharomyces cerevisiae in response to glucose and ethanol pulses. Metab. Eng. 10:39–54 [DOI] [PubMed] [Google Scholar]
- 35.Viana T, Loureiro-dias MC, Loureiro V, Prista C. 2012. Peculiar H+ homeostasis of Saccharomyces cerevisiae during the late stages of wine fermentation. Appl. Environ. Microbiol. 78:6302–6308 [DOI] [PMC free article] [PubMed] [Google Scholar]
- 36.Pineda Rodó A, Váchová L, Palková Z. 2012. In vivo determination of organellar pH using a universal wavelength-based confocal microscopy approach. PLoS One 7:e33229. 10.1371/journal.pone.0033229 [DOI] [PMC free article] [PubMed] [Google Scholar]
- 37.Kane PM. 2006. The where, when, and how of organelle acidification by the yeast vacuolar H+-ATPase. Microbiol. Mol. Biol. Rev. 70:177–191 [DOI] [PMC free article] [PubMed] [Google Scholar]
- 38.Catty P, de Kerchove d' Exaerde A, Goffeau A. 1997. The complete inventory of the yeast Saccharomyces cerevisiae P-type transport ATPases. FEBS Lett. 409:325–332 [DOI] [PubMed] [Google Scholar]
- 39.Portillo F, Eraso P, Serrano R. 1991. Analysis of the regulatory domain of yeast plasma membrane H+-ATPase by directed mutagenesis and intragenic suppression. FEBS Lett. 287:71–74 [DOI] [PubMed] [Google Scholar]
- 40.Allen C, Büttner S, Aragon AD, Thomas JA, Meirelles O, Jaetao JE, Benn D, Ruby SW, Veenhuis M, Madeo F, Werner-Washburne M. 2006. Isolation of quiescent and nonquiescent cells from yeast stationary-phase cultures. J. Cell Biol. 174:89–100 [DOI] [PMC free article] [PubMed] [Google Scholar]
- 41.Parrou JL, Enjalbert B, Plourde L, Bauche A, Gonzalez B, François J. 1999. Dynamic responses of reserve carbohydrate metabolism under carbon and nitrogen limitations in Saccharomyces cerevisiae. Yeast (Chichester, England) 15:191–203 [DOI] [PubMed] [Google Scholar]
- 42.Orij R, Urbanus ML, Vizeacoumar FJ, Giaever G, Boone C, Nislow C, Brul S, Smits GJ. 2012. Genome-wide analysis of intracellular pH reveals quantitative control of cell division rate by pH(c) in Saccharomyces cerevisiae. Genome Biol. 13:R80. [DOI] [PMC free article] [PubMed] [Google Scholar]
Associated Data
This section collects any data citations, data availability statements, or supplementary materials included in this article.