

Abstract
By CLSI interpretive criteria, anidulafungin and micafungin MICs determined by various methods were sensitive (60 to 70%) and highly specific (94 to 100%) for identifying FKS mutations among 120 Candida glabrata isolates. Anidulafungin and micafungin breakpoints were more specific than CLSI's caspofungin breakpoint in identifying FKS mutant strains and patients with invasive candidiasis who were likely to fail echinocandin treatment (P ≤ 0.0001 for both). Echinocandin MICs were most useful clinically when interpreted in the context of prior echinocandin exposure.
TEXT
The echinocandins are the front-line therapy for invasive candidiasis due to Candida glabrata (1), but resistance to the class is emerging (2, 3). Resistance is mediated by point mutations in hot spots of FKS genes, which encode the echinocandin target enzyme β-1,3-d-glucan synthase. Recently, the Clinical and Laboratory Standards Institute (CLSI) proposed revised echinocandin MIC breakpoints to differentiate FKS mutant from wild-type Candida strains (4, 5). Using MICs determined by the standard broth microdilution method with RPMI medium (BMD-RPMI), we recently showed that the revised caspofungin resistance breakpoint (>0.12 μg/ml) was highly sensitive but poorly specific for identifying FKS mutant C. glabrata strains at our center (2, 6). In fact, the distributions of caspofungin MICs by the standard method have differed between laboratories (4, 6–11) and may be impacted by factors such as choice of dissolving solvent (12) and evaluator interpretation (7). In response to our suboptimal results, we determined receiver operator characteristic (ROC)-derived caspofungin resistance breakpoints for identifying FKS mutant C. glabrata by several testing methods. A caspofungin MIC of >0.25 μg/ml by Etest performed best, with sensitivity and specificity of 100% and 94%, respectively (2). In the setting of previous echinocandin exposure, 91% of patients who had invasive candidiasis due to caspofungin-resistant C. glabrata failed caspofungin treatment. Therefore, caspofungin MICs against C. glabrata were clinically useful at our center, but the CLSI resistance breakpoint was not.
Due to interlaboratory variability in the MIC ranges for caspofungin, susceptibility testing of other echinocandins (anidulafungin and micafungin) has been advocated as a surrogate for identifying caspofungin-resistant C. glabrata strains (13, 14). To investigate the utility of anidulafungin and micafungin MICs, we tested C. glabrata strains from patients with invasive candidiasis by the methods used in our earlier study (2) and assessed the performances of revised CLSI and ROC-derived breakpoints. We determined if anidulafungin or micafungin MICs correlated with the presence of C. glabrata FKS mutations and treatment outcomes among patients and compared the results with our previous caspofungin MIC data.
Hot spot regions of FKS1 and FKS2 were sequenced in 120 C. glabrata isolates selected from the biorepository at the University of Pittsburgh Mycology Research Unit, as described previously (2). Anidulafungin and micafungin powders obtained from Pfizer (New York, NY) and Astellas (Northbrook, IL), respectively, were dissolved in dimethyl sulfoxide (DMSO). MICs were determined in triplicate by standard methods according to CLSI document M27-A3 (BMD-RPMI medium, buffered to a pH of 7.0 with MOPS [morpholinepropanesulfonic acid]) (15). MICs against quality control strains Candida krusei ATCC 6258 and Candida parapsilosis ATCC 22019 were within the expected range during each experiment (16). Eight percent (10/120) of isolates harbored FKS1 mutations (n = 3 [D632H, D632Y, and R635I]) or FKS2 mutations (n = 7 [3 F659L isolates, 2 F659del isolates, and F659S and S663P]). As we previously reported, 100% of mutant C. glabrata isolates were recovered from patients previously exposed to an echinocandin (compared to 19% [21/110] of wild-type isolates; P < 0.0001); the rate of FKS mutations among isolates from patients who were previously exposed to an echinocandin was 32% (10/31) (2). Median anidulafungin and micafungin MICs were higher against isolates from patients with previous echinocandin exposure (P = 0.0005 and 0.003, respectively) (Fig. 1) and against FKS mutant strains (P < 0.0001 for both) (Table 1).
Fig 1.
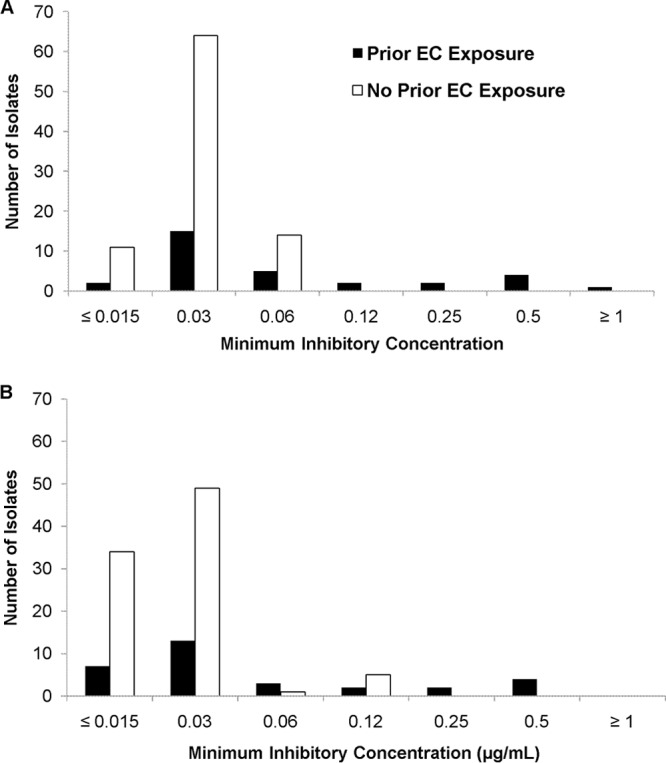
Distribution of anidulafungin (A) and micafungin (B) MICs (μg/ml) among isolates collected from patients with or without prior echinocandin (EC) exposure.
Table 1.
Echinocandin MICs against 120 clinical strains of Candida glabrata
| Antifungal agent and test | No. of isolates (no. with mutation) at MIC shown, μg/ml |
EA (%)a | % susceptibleb | |||||||||
|---|---|---|---|---|---|---|---|---|---|---|---|---|
| ≤0.015 | 0.03 | 0.06 | 0.12 | 0.25 | 0.5 | 1 | 2 | 4 | ≥8 | |||
| Anidulafungin | ||||||||||||
| BMD-RPMI | 13 (1) | 79 | 19 (1) | 2 (2) | 2 (1) | 4 (4) | 1 (1) | 94 | ||||
| BMD-AM3 | 114 (4) | 2 (2) | 1 (1) | 2 (2) | 1 (1) | 78 | 99 | |||||
| YeastOne | 15 (1) | 43 | 41 (2) | 10 | 6 (4) | 2 (1) | 3 (2) | 86 | 91 | |||
| Etest | 13 | 91 (1) | 5 | 4 (2) | 4 (4) | 1 (1) | 2 (2) | 94 | 94 | |||
| Micafungin | ||||||||||||
| BMD-RPMI | 41 | 62 (3) | 4 (1) | 7 (1) | 2 (1) | 4 (4) | 89 | |||||
| BMD-AM3 | 111 (3) | 4 (3) | 3 (2) | 1 (1) | 1 (1) | 86 | 98 | |||||
| YeastOne | 90 (1) | 16 (1) | 2 (2) | 2 | 4 (3) | 2 (1) | 1 | 1 | 2 (2) | 85 | 90 | |
| Etest | 111 (3) | 2 (1) | 1 | 1 (1) | 1 (1) | 2 (2) | 2 (2) | 88 | 95 | |||
EA, essential agreement compared to BMD-RPMI.
Using the revised CLSI breakpoints of ≤0.12 μg/ml for anidulafungin and ≤0.06 μg/ml for micafungin.
MICs measured using the standard BMD-RPMI method were compared to those determined by BMD in antibiotic medium 3 (BMD-AM3), Etest (bioMérieux, Durham, NC), and Sensititre YeastOne (Trek Diagnostics, Cleveland, OH). For each method, essential agreement with BMD-RPMI was defined by MICs within 1 dilution (≤2-fold difference). Anidulafungin MICs ranged from 0.015 to 4 μg/ml by the various methods (Table 1). Based on the CLSI interpretive breakpoint (>0.12 μg/ml), the highest and lowest rates of resistance were 9% (11/120) and 1% (1/120) by YeastOne and BMD-AM3, respectively. Essential agreement was highest with Etest (94%) and lowest with BMD-AM3 (78%; P = 0.0001 by McNemar's test). Each of the four methods was highly specific for the identification of FKS mutants (range, 96 to 100%) (Table 2). Sensitivity ranged from 60 to 70% for BMD-RPMI, YeastOne, and Etest but was 10% for BMD-AM3 (P = 0.04). ROC-derived breakpoints improved sensitivity to 60 to 90% at little or no cost to specificity. An anidulafungin resistance breakpoint of >0.06 μg/ml by Etest performed best (90% sensitive and 98% specific).
Table 2.
Sensitivity and specificity of echinocandin MICs in identifying C. glabrata FKS mutant strains as resistant using CLSI and ROC-derived breakpoints (n = 120)
| Antifungal agent and test | CLSI |
ROC |
||||||
|---|---|---|---|---|---|---|---|---|
| BP (μg/ml)a | % (no./total tested) |
Likelihood ratiod | BP (μg/ml)a | % (no./total tested) |
Likelihood ratiod | |||
| Sensitivityb | Specificityc | Sensitivityb | Specificityc | |||||
| Anidulafungin | ||||||||
| BMD-RPMI | >0.12 | 60 (6/10) | 99 (109/110) | 66 | 0.06 | 80 (8/10) | 99 (109/110) | 88 |
| BMD-AM3 | >0.12 | 10 (1/10) | 100 (110/110) | NAe | 0.015 | 60 (6/10) | 100 (110/110) | NA |
| YeastOne | >0.12 | 70 (7/10) | 96 (106/110) | 19.3 | 0.12 | 70 (7/10) | 96 (106/110) | 19.3 |
| Etest | >0.12 | 70 (7/10) | 100 (110/110) | NA | 0.06 | 90 (9/10) | 98 (108/110) | 49.5 |
| Micafungin | ||||||||
| BMD-RPMI | >0.06 | 60 (6/10) | 94 (103/110) | 9.4 | 0.03 | 70 (7/10) | 91 (100/110) | 7.7 |
| BMD-AM3 | >0.06 | 20 (2/10) | 100 (110/110) | NA | 0.015 | 70 (7/10) | 98 (108/110) | 38.5 |
| YeastOne | >0.06 | 60 (6/10) | 95 (104/110) | 11 | 0.03 | 80 (8/10) | 95 (104/110) | 14.7 |
| Etest | >0.06 | 60 (6/10) | 100 (110/110) | NA | 0.015 | 70 (7/10) | 98 (108/110) | 38.5 |
BP, breakpoint.
Percentage of FKS mutant isolates with MICs above the BP.
Percentage of wild-type isolates with MICs below the BP.
Sensitivity/(1 − specificity).
NA, not applicable.
Micafungin MICs also ranged from 0.015 to 4 μg/ml by the various methods. The highest and lowest rates of resistance, as determined using the CLSI resistance breakpoint (>0.06 μg/ml), were 11% (13/120) and 2% (2/120) with BMD-RPMI and BMD-AM3, respectively (Table 1). There were no differences in rates of essential agreement (range, 85 to 88%). The sensitivity of the CLSI breakpoint for identifying FKS mutants was 60% for BMD-RPMI, YeastOne, and Etest, with specificity ranging between 94 and 100% (Table 2). Sensitivity was 20% for BMD-AM3, with specificity of 100%. ROC-derived micafungin breakpoints demonstrated sensitivity of 70 to 80% and specificity of 91 to 98%. A micafungin resistance breakpoint of >0.03 μg/ml by YeastOne performed best (80% sensitive and 95% specific).
Next, we evaluated the performance of MICs against strains recovered from 66 patients with invasive candidiasis who were treated with an echinocandin (caspofungin, n = 63; anidulafungin, n = 1; micafungin, n = 2), including all patients infected with FKS mutant C. glabrata strains. Patient outcomes were assessed as described previously (2, 6) and defined using consensus definitions (17). Eighty-six percent (57/66) and 14% (8/66) of patients had candidemia and deep-seated candidiasis, respectively. The median age was 42 years (range, 25 to 77 years); 30% (20/66) of patients were men, 42% (28/66) resided in the intensive care unit (ICU) at the time of candidiasis, and 23% (15/66) were solid organ transplant recipients. The 14-day treatment success and failure rates were 67% (44/66) and 33% (22/66), respectively. The sensitivity and specificity of anidulafungin and micafungin breakpoints for identifying treatment failures by each method are listed in Table 3. Based on CLSI breakpoints, the sensitivity and specificity of anidulafungin MICs by BMD-RPMI, YeastOne, and Etest ranged from 23 to 27% and 93 to 98%, respectively. Anidulafungin MICs by BMD-AM3 had sensitivity of only 5% and specificity of 100%. The sensitivities of micafungin MICs by BMD-RPMI, YeastOne, and Etest also ranged from 23 to 27%; specificity ranged from 88 to 98%. BMD-AM3 sensitivity and specificity were 9% and 100%, respectively. ROC-derived anidulafungin and micafungin resistance breakpoints had improved sensitivities of 23 to 36% and 27 to 36%, respectively. The highest sensitivity was 36% (8/22) for an anidulafungin MIC of >0.06 μg/ml by Etest and a micafungin MIC of >0.03 μg/ml by YeastOne. The specificity of results by these methods was 95% (42/44). Of note, the sensitivities of an FKS mutation or prior echinocandin exposure in identifying treatment failures were 41% (9/22) and 59% (13/22), respectively (P = 1.00 and 0.07, respectively, versus anidulafungin Etest or micafungin YeastOne). The corresponding specificities were 98% (43/44) and 82% (36/44).
Table 3.
Sensitivity and specificity of echinocandin MICs in identifying treatment failures
| Antimicrobial agent and test | CLSI |
ROC |
||||||
|---|---|---|---|---|---|---|---|---|
| BP (μg/ml)a | % (no./total tested) |
Likelihood ratiod | BP (μg/ml)a | % (no./total tested) |
Likelihood ratiod | |||
| Sensitivityb | Specificityc | Sensitivityb | Specificityc | |||||
| Anidulafungin | ||||||||
| BMD-RPMI | >0.12 | 23 (5/22) | 98 (43/44) | 10 | 0.06 | 32 (7/22) | 98 (43/44) | 14 |
| BMD-AM3 | >0.12 | 5 (1/22) | 100 (44/44) | NAe | 0.015 | 23 (5/22) | 98 (43/44) | 10 |
| YeastOne | >0.12 | 27 (6/22) | 93 (41/44) | 4 | 0.12 | 27 (6/22) | 93 (41/44) | 4 |
| Etest | >0.12 | 27 (6/22) | 98 (43/44) | 12 | 0.06 | 36 (8/22) | 95 (42/44) | 8 |
| Micafungin | ||||||||
| BMD-RPMI | >0.06 | 27 (6/22) | 89 (39/44) | 2.4 | 0.03 | 27 (6/22) | 93 (41/44) | 4 |
| BMD-AM3 | >0.06 | 9 (2/22) | 100 (44/44) | NA | 0.015 | 32 (7/22) | 89 (39/44) | 2.8 |
| YeastOne | >0.06 | 23 (5/22) | 89 (39/44) | 2 | 0.03 | 36 (8/22) | 95 (42/44) | 8 |
| Etest | >0.06 | 23 (5/22) | 98 (43/44) | 10 | 0.015 | 32 (7/22) | 98 (43/44) | 14 |
BP, breakpoint.
Percentage of clinical failures with MICs greater than the breakpoint (i.e., resistant isolates).
Percentage of clinical successes with MICs equal to or less than the breakpoint (i.e., susceptible isolates).
Sensitivity/(1 − specificity).
NA, not applicable.
Eighty percent (8/10) of patients infected with an isolate for which the anidulafungin Etest MIC was >0.06 μg/ml failed echinocandin treatment, compared to 25% (14/56) of patients infected by an isolate with a MIC of ≤0.06 μg/ml (P = 0.002). Likewise, 78% (7/9) of patients infected with an isolate for which the micafungin YeastOne MIC was >0.03 μg/ml failed treatment, compared to 26% (15/57; P = 0.005) of patients infected by an isolate with a MIC ≤0.03 μg/ml. The echinocandin failure rate among patients infected with an FKS mutant C. glabrata strain was 90% (9/10), compared to 23% (13/56) for patients infected with wild-type C. glabrata (P = 0.0003). The failure rate for patients who were previously exposed to an echinocandin was 62% (13/21), compared to 30% (9/44) for patients without prior exposure (P = 0.001). Flowcharts for treatment outcomes stratified by prior echinocandin exposure and echinocandin MICs (as measured using the most sensitive testing method for each agent) are presented in Fig. 2.
Fig 2.
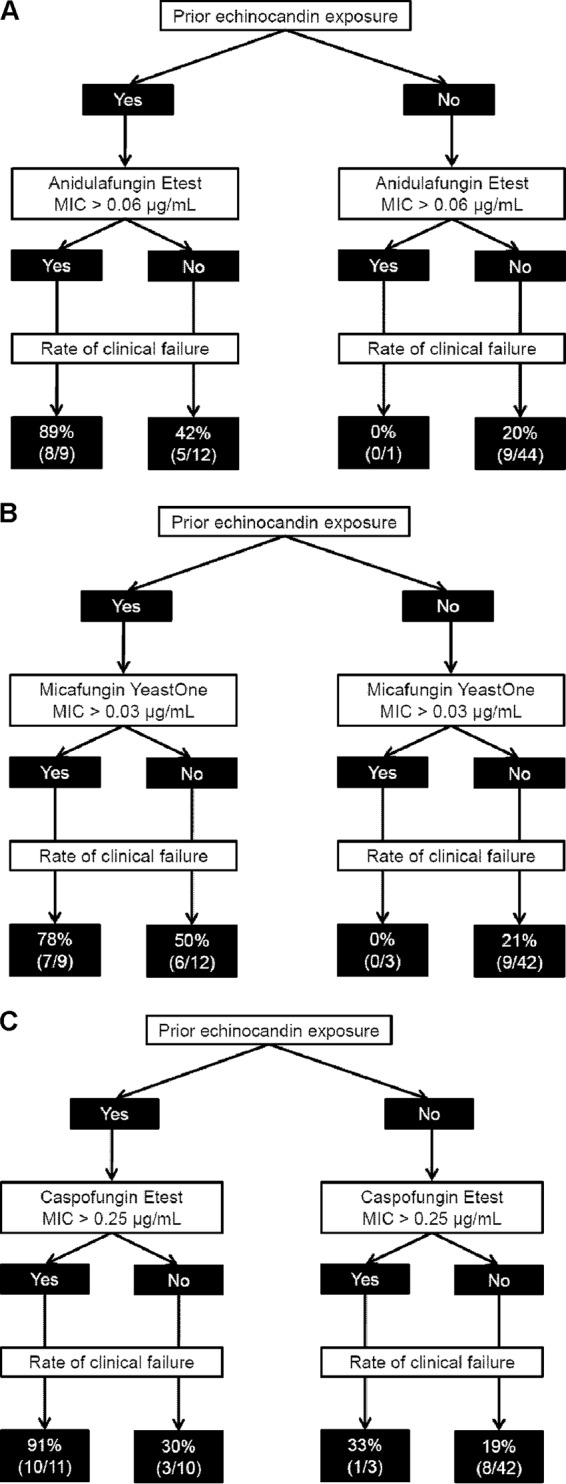
Predictive value of anidulafungin (A), micafungin (B), and caspofungin (C) MICs (μg/ml) in the context of prior echinocandin exposure among patients treated with an echinocandin.
Taken together, our data demonstrate that anidulafungin and micafungin MICs determined by the standard BMD-RPMI method at our center were similar to those used by CLSI to establish revised interpretive breakpoints (4). As such, the recommended MIC breakpoints were sensitive and highly specific for identifying FKS mutant strains as resistant. These data stand in contrast to the poor performance we reported previously for the CLSI caspofungin resistance breakpoint (sensitivity and specificity of 90% and 3%, respectively) (2). Moreover, CLSI anidulafungin and micafungin breakpoints were more specific (98% [43/44] and 89% [39/44], respectively) than the caspofungin breakpoint (0% [0/44]) in identifying echinocandin treatment failures (P ≤ 0.0001 for both). Our findings have two important implications. First, clinicians should understand the distribution of echinocandin MICs at their centers and evaluate the performance of CLSI breakpoints accordingly. Second, CLSI anidulafungin or micafungin breakpoint MICs may be useful markers for echinocandin resistance at centers where caspofungin MICs run higher than the range used by CLSI. The present study is in keeping with the European Committee on Antimicrobial Susceptibility's (EUCAST) recommendation that caspofungin MICs not be used to identify echinocandin resistance (13, 14).
It is notable that ROC-derived breakpoints for anidulafungin and micafungin slightly improved the identification of FKS mutant strains and echinocandin treatment failures. The sensitivity and specificity of these breakpoints, as determined using the standard testing method, were comparable to our previous data for ROC-derived caspofungin breakpoints (70% sensitive and 93% specific for FKS mutants and 32% and 86%, respectively, for treatment failures) (2). The ROC-derived anidulafungin and micafungin breakpoints were 1 dilution lower than CLSI breakpoints and in agreement with EUCAST breakpoints. In contrast, the ROC-derived caspofungin breakpoint was 2 dilutions higher than the CLSI breakpoint, which further highlights the extent to which differences in MIC distributions between centers can impact the interpretation of data (11).
Commercial susceptibility testing methods for anidulafungin and micafungin also performed well. Etest and YeastOne provided a high degree of essential agreement and comparable sensitivity and specificity to BMD-RPMI for identifying FKS mutations. The data are consistent with prior studies and support conclusions that the three tests can be used interchangeably for anidulafungin and micafungin (18, 19). On the other hand, BMD-AM3 was less sensitive, and median MICs of both drugs were lower. ROC-derived breakpoints for all methods (including BMD-AM3) demonstrated improved sensitivity at no cost to specificity. Indeed, susceptibility testing of anidulafungin using an Etest resistance breakpoint of >0.06 μg/ml and micafungin using a YeastOne resistance breakpoint of >0.03 μg/ml showed they were the most sensitive methods for detecting FKS mutants. For patients infected with isolates demonstrating MICs above ROC-derived breakpoints, the positive predictive values for echinocandin treatment failure were 80% (8/10) and 57% (12/21), respectively.
Regardless of testing method, anidulafungin and micafungin MICs were best interpreted in the context of prior echinocandin exposure (Fig. 2). Using ROC-derived breakpoints for each agent, treatment failure rates ranged from 78 to 89% among patients previously exposed to an echinocandin and infected with a resistant strain of C. glabrata. The failure rates were 42 to 50% among previously exposed patients who were infected with susceptible strains and only 20% (9/45) for patients who did not have prior echinocandin exposure (regardless of strain susceptibility). Our previous findings using ROC-derived caspofungin breakpoints were comparable (Fig. 2C). Taken together, the data highlight that microbiologic resistance is not the sole determinant of responses to antifungal therapy, as factors like host immune function, underlying diseases, severity of illness, intravenous catheter removal, adjunctive surgical interventions, and pharmacokinetic/pharmacodynamic parameters also play crucial roles (20). The small number of patients included in this study precludes our ability to draw definitive conclusions about the relative merits of using FKS mutant detection, echinocandin MIC determinations, or a history of prior echinocandin to guide treatment decisions. The detection of an FKS mutation or the presence of echinocandin resistance among patients who have previously received an echinocandin virtually ensures treatment failure. Our experience suggests that the most judicious course is to use an agent from an alternative antifungal class in treating patients with previous echinocandin exposure.
In conclusion, future studies are needed to validate our findings and clarify the roles of echinocandin susceptibility testing and FKS mutant detection in clinical practice. In addition, studies of other Candida species must be undertaken. A major challenge for the field is to identify susceptibility testing methods that minimize variability in caspofungin MICs. In the meantime, our data suggest that anidulafungin or micafungin MICs may be more reliable predictors of treatment failure against C. glabrata invasive candidiasis, even among patients who are treated with caspofungin.
ACKNOWLEDGMENTS
Research reported in this publication was supported by the National Center for Advanced Translational Sciences of the National Institutes of Health under award no. KL2 RR024154 to R.K.S. and by investigator-initiated grants to R.K.S. from Astellas and Merck.
The content is solely the responsibility of the authors and does not necessarily represent the official views of the National Institutes of Health.
Footnotes
Published ahead of print 23 September 2013
REFERENCES
- 1. Andes DR, Safdar N, Baddley JW, Playford G, Reboli AC, Rex JH, Sobel JD, Pappas PG, Kullberg BJ. 2012. Impact of treatment strategy on outcomes in patients with candidemia and other forms of invasive candidiasis: a patient-level quantitative review of randomized trials. Clin. Infect. Dis. 54:1110–1122 [DOI] [PubMed] [Google Scholar]
- 2. Shields RK, Nguyen MH, Press EG, Updike CA, Clancy CJ. 2013. Caspofungin MICs correlate with treatment outcomes among patients with Candida glabrata invasive candidiasis and prior echinocandin exposure. Antimicrob. Agents Chemother. 57:3528–3535 [DOI] [PMC free article] [PubMed] [Google Scholar]
- 3. Alexander BD, Johnson MD, Pfeiffer CD, Jimenez-Ortigosa C, Catania J, Booker R, Castanheira M, Messer SA, Perlin DS, Pfaller MA. 2013. Increasing echinocandin resistance in Candida glabrata: clinical failure correlates with presence of FKS mutations and elevated minimum inhibitory concentrations. Clin. Infect. Dis. 56:1724–1732 [DOI] [PMC free article] [PubMed] [Google Scholar]
- 4. Pfaller MA, Diekema DJ, Andes D, Arendrup MC, Brown SD, Lockhart SR, Motyl M, Perlin DS. 2011. Clinical breakpoints for the echinocandins and Candida revisited: integration of molecular, clinical, and microbiological data to arrive at species-specific interpretive criteria. Drug Resist. Updat. 14:164–176 [DOI] [PubMed] [Google Scholar]
- 5. Clinical and Laboratory Standards Institute 2012. Reference method for broth dilution antifungal susceptibility testing of yeasts. Fourth informational supplement M27-S4, 4th ed. Clinical and Laboratory Standards Institute, Wayne, PA [Google Scholar]
- 6. Shields RK, Nguyen MH, Press EG, Kwa AL, Cheng S, Du C, Clancy CJ. 2012. Presence of an FKS mutation rather than minimum inhibitory concentration is an independent risk factor for failure of echinocandin therapy among patients with invasive candidiasis due to Candida glabrata. Antimicrob. Agents Chemother. 56:4862–4869 [DOI] [PMC free article] [PubMed] [Google Scholar]
- 7. Odds FC, Motyl M, Andrade R, Bille J, Canton E, Cuenca-Estrella M, Davidson A, Durussel C, Ellis D, Foraker E, Fothergill AW, Ghannoum MA, Giacobbe RA, Gobernado M, Handke R, Laverdiere M, Lee-Yang W, Merz WG, Ostrosky-Zeichner L, Peman J, Perea S, Perfect JR, Pfaller MA, Proia L, Rex JH, Rinaldi MG, Rodriguez-Tudela JL, Schell WA, Shields C, Sutton DA, Verweij PE, Warnock DW. 2004. Interlaboratory comparison of results of susceptibility testing with caspofungin against Candida and Aspergillus species. J. Clin. Microbiol. 42:3475–3482 [DOI] [PMC free article] [PubMed] [Google Scholar]
- 8. Kartsonis N, Killar J, Mixson L, Hoe C-M, Sable C, Bartizal K, Motyl M. 2005. Caspofungin susceptibility testing of isolates from patients with esophageal candidiasis or invasive candidiasis: relationship of MIC to treatment outcome. Antimicrob. Agents Chemother. 49:3616–3623 [DOI] [PMC free article] [PubMed] [Google Scholar]
- 9. Pfaller MA, Boyken L, Hollis RJ, Kroeger J, Messer SA, Tendolkar S, Jones RN, Turnidge J, Diekema DJ. 2010. Wild-type MIC distributions and epidemiological cutoff values for the echinocandins and Candida spp. J. Clin. Microbiol. 48:52–56 [DOI] [PMC free article] [PubMed] [Google Scholar]
- 10. Ostrosky-Zeichner L, Rex JH, Pappas PG, Hamill RJ, Larsen RA, Horowitz HW, Powderly WG, Hyslop N, Kauffman CA, Cleary J, Mangino JE, Lee J. 2003. Antifungal susceptibility survey of 2,000 bloodstream Candida isolates in the United States. Antimicrob. Agents Chemother. 47:3149–3154 [DOI] [PMC free article] [PubMed] [Google Scholar]
- 11. Espinel-Ingroff A, Arendrup MC, Pfaller MA, Bonfietti LX, Bustamante B, Canton E, Chryssanthou E, Cuenca-Estrella M, Dannaoui E, Fothergill A, Fuller J, Gaustad P, Gonzalez GM, Guarro J, Lass-Florl C, Lockhart SR, Meis JF, Moore CB, Ostrosky-Zeichner L, Pelaez T, Pukinskas SR, St-Germain G, Szeszs MW, Turnidge J. 9 September 2013. Interlaboratory variability of caspofungin MICs for Candida spp. using CLSI and EUCAST methods: should the clinical laboratory be testing this agent? Antimicrob. Agents Chemother. [Epub ahead of print.] 10.1128/AAC.01519-13 [DOI] [PMC free article] [PubMed] [Google Scholar]
- 12. Alastruey-Izquierdo A, Gomez-Lopez A, Arendrup MC, Lass-Florl C, Hope WW, Perlin DS, Rodriguez-Tudela JL, Cuenca-Estrella M. 2012. Comparison of dimethyl sulfoxide and water as solvents for echinocandin susceptibility testing by the EUCAST methodology. J. Clin. Microbiol. 50:2509–2512 [DOI] [PMC free article] [PubMed] [Google Scholar]
- 13. European Committee on Antimicrobial Susceptibility Testing 11 February 2013. Antifungal agents: breakpoint tables for interpretation of MICs. Version 6.1. EUCAST, Basel, Switzerland: https://www.escmid.org/ [Google Scholar]
- 14. Arendrup MC, Rodriguez-Tudela JL, Lass-Florl C, Cuenca-Estrella M, Donnelly JP, Hope W. 2011. EUCAST technical note on anidulafungin. Clin. Microbiol. Infect. 17:E18–E20 [DOI] [PubMed] [Google Scholar]
- 15. Clinical and Laboratory Standards Institute 2008. Reference method for broth dilution antifungal susceptibility testing of yeasts. Approved standard M27-A3, 3rd ed. Clinical and Laboratory Standards Institute, Wayne, PA [Google Scholar]
- 16. Clinical and Laboratory Standards Institute 2008. Reference method for broth dilution antifungal susceptibility testing of yeasts. Third informational supplement, vol 28 Clinical and Laboratory Standards Institute, Wayne, PA [Google Scholar]
- 17. De Pauw B, Walsh TJ, Donnelly JP, Stevens DA, Edwards JE, Calandra T, Pappas PG, Maertens J, Lortholary O, Kauffman CA, Denning DW, Patterson TF, Maschmeyer G, Bille J, Dismukes WE, Herbrecht R, Hope WW, Kibbler CC, Kullberg BJ, Marr KA, Munoz P, Odds FC, Perfect JR, Restrepo A, Ruhnke M, Segal BH, Sobel JD, Sorrell TC, Viscoli C, Wingard JR, Zaoutis T, Bennett JE. 2008. Revised definitions of invasive fungal disease from the European Organization for Research and Treatment of Cancer/Invasive Fungal Infections Cooperative Group and the National Institute of Allergy and Infectious Diseases Mycoses Study Group (EORTC/MSG) Consensus Group. Clin. Infect. Dis. 46:1813–1821 [DOI] [PMC free article] [PubMed] [Google Scholar]
- 18. Pfaller MA, Chaturvedi V, Diekema DJ, Ghannoum MA, Holliday NM, Killian SB, Knapp CC, Messer SA, Miskou A, Ramani R. 2012. Comparison of the Sensititre YeastOne colorimetric antifungal panel with CLSI microdilution for antifungal susceptibility testing of the echinocandins against Candida spp., using new clinical breakpoints and epidemiological cutoff values. Diagn. Microbiol. Infect. Dis. 73:365–368 [DOI] [PubMed] [Google Scholar]
- 19. Pfaller MA, Castanheira M, Diekema DJ, Messer SA, Moet GJ, Jones RN. 2010. Comparison of European Committee on Antimicrobial Susceptibility Testing (EUCAST) and Etest methods with the CLSI broth microdilution method for echinocandin susceptibility testing of Candida species. J. Clin. Microbiol. 48:1592–1599 [DOI] [PMC free article] [PubMed] [Google Scholar]
- 20. Rex JH, Pfaller MA. 2002. Has antifungal susceptibility testing come of age? Clin. Infect. Dis. 35:982–989 [DOI] [PubMed] [Google Scholar]