

Abstract
The purpose of this study was to determine if the disposition of cefadroxil, an α-amino-containing β-lactam antibiotic, changes during lipopolysaccharide (LPS)-induced acute inflammation. Six hours after LPS or saline treatment, mice received 1 nmol/g cefadroxil intravenously along with inulin for glomerular filtration rate (GFR) determination. Serial blood samples, along with tissue and urine samples, were collected at predetermined time points. In order to determine inflammation-induced changes in GFR, renal tubular secretion, and reabsorption, it was necessary to coadminister 70 mg/kg probenecid. Changes in the expression of the mRNA of transporters involved in cefadroxil disposition in the kidneys and choroid plexus were also investigated 6 h after LPS treatment. The results demonstrated marked increases in blood, cerebrospinal fluid, and tissue cefadroxil concentrations with LPS treatment. Tissue-to-blood concentration ratios were decreased by 4.6-fold in the choroid plexus and by 2.5-fold in the kidneys during LPS-induced inflammation. Renal, but not choroid plexus, mRNA expression of peptide transporter 2, organic-anion transporter 1 (OAT1), OAT3, and multidrug resistance-associated protein 4 was mildly reduced in LPS-treated mice. The renal clearance of cefadroxil was substantially decreased by LPS treatment (3-fold). GFR was also reduced by 3-fold in LPS-treated mice, but no significant differences in the fractional reabsorption of cefadroxil and renal secretion once normalized by GFR were observed. These findings demonstrated that LPS-induced inflammation has a dramatic effect on the renal excretion of cefadroxil. It appears that changes in transporter expression played a minor role during LPS treatment but that renal dysfunction, associated with GFR reduction, was responsible for the substantial increase in plasma cefadroxil concentration-time profiles.
INTRODUCTION
Inflammation can be protective but can also have deleterious effects. Over the past half century, it has been reported that drug absorption and disposition can be altered during an inflammatory response because of modifications in plasma proteins, drug-metabolizing enzymes, and drug transporters (1). Downregulation of the levels of drug-binding plasma proteins and drug-metabolizing enzymes is now well identified, which translates into increased plasma drug concentrations or decreased clearance of drug substrates (2–6). More recently, inflammation-mediated regulation of drug transporters has been reported, especially for ATP-binding cassette (ABC) and solute carrier (SLC) transporters (1, 5). ABC transporters, such as P-glycoprotein and multidrug resistance-associated proteins (MRPs), are reported to be downregulated during an inflammatory response in the brain, liver, and intestine, thereby affecting the brain efflux, biliary clearance, and intestinal absorption of drug substrates (5). Studies have also shown that organic-anion-transporting polypeptides (OATPs) and organic-anion transporters (OATs) are downregulated in the kidney during inflammation, resulting in reduced renal clearance of the substrate p-aminohippurate (7). Although inflammation-induced changes in drug kinetics and dynamics have been intensively studied over the past 30 years, there is still a lack of knowledge concerning the mechanism(s) by which inflammation-associated changes in drug disposition are coordinated. This information may be especially critical for those drugs with narrow therapeutic indices.
Sepsis is a systemic inflammatory response state, commonly caused by bacterial endotoxin. Sepsis is frequently associated with acute renal failure (ARF), which is characterized by an abrupt decline in the glomerular filtration rate (GFR) and tubular function (8). The mortality rate of sepsis patients is substantially increased to 75% when they also have ARF (9). The kidney is involved in the elimination pathway of a large variety of drugs. Therefore, renal failure under septic conditions results in a significant decrease in renal clearance and a substantial increase in the concentrations of many drugs in plasma (10).
Cefadroxil is an α-amino-containing β-lactam antibiotic with a broad spectrum of antibacterial activity. It has good water solubility and a modest degree of lipid solubility. Clinical studies showed that cefadroxil is widely distributed in body tissues and therefore is useful for infections of a variety of tissues (11, 12). Cefadroxil is especially effective in the treatment of upper and lower respiratory tract infections such as sinusitis, otitis media, acute bronchitis, and lung abscesses (13). Cefadroxil is not metabolized in the body and is eliminated mainly via renal excretion in intact form. It has been reported that 88 to 93% of the administered dose is recovered in the urine within 24 h (14). Therefore, elimination of cefadroxil is substantially reduced in patients with impaired kidney function (15). The overall renal excretion of cefadroxil occurs via the combined processes of glomerular filtration, tubular secretion, and tubular reabsorption. Previous studies have shown that cefadroxil is a substrate of several drug transporters, including the OATs and peptide transporters (PEPT1 and PEPT2). OATs are expressed on the basolateral side of proximal tubule epithelial cells, and PEPTs are localized on the apical side of proximal tubule epithelial cells, thereby playing a key role in the active tubular secretion and reabsorption of drug substrates in the kidney, respectively (16, 17). OATs and PEPTs are also expressed at the apical surface of choroid plexus epithelia in the brain, playing a role as efflux pumps for removing drug molecules from cerebrospinal fluid (CSF) to the blood side. This may explain, in part, why β-lactam antibiotics, including cefadroxil, are limited in their use for the treatment of central nervous system infections.
Lipopolysaccharide (LPS), a major component of the bacterial cell wall, is one of the best-characterized models of infection and is commonly used to investigate the pathophysiology of sepsis in experimental animal models. Administration of LPS is known to induce significant reductions in the GFR and tubular function, as commonly observed in patients with septic shock (18–21). It has also been reported that LPS treatment downregulates OAT transcripts and protein expression in the kidneys and upregulates PEPT2 transcripts in the choroid plexus (7, 22). On the basis of the previous knowledge that cefadroxil is excreted by the kidneys by glomerular filtration, OAT-mediated secretion, and PEPT2-mediated reabsorption, as well as being distributed into important target tissues by the OATs and PEPT2, we hypothesized that cefadroxil disposition would be significantly changed by LPS-induced inflammation. Our results are novel in elucidating the mechanism(s) by which LPS-induced inflammation alters the disposition and renal pharmacokinetics of cefadroxil.
MATERIALS AND METHODS
Materials.
LPS (from Escherichia coli serotype O111:B4), which was used to induce peripheral inflammation, and unlabeled cefadroxil were purchased from Sigma-Aldrich (St. Louis, MO). [3H]cefadroxil (0.8 Ci/mmol), [14C]carboxyl-dextran 70,000 (1.1 mCi/g), and [14C]mannitol were purchased from Moravek Biochemicals (Brea, CA). [14C]carboxyl-inulin (2 mCi/g) was obtained from American Radiolabeled Chemicals (St. Louis, MO). Hyamine hydroxide was obtained from ICN Pharmaceuticals (Costa Mesa, CA), and nylon net filters (100 μm) were obtained from Millipore Corporation (Bedford, MA). Primers for PEPT1/2 that were used in reverse transcription (RT)-PCR studies were synthesized by Invitrogen Life Technologies (Carlsbad, CA), and primers for OAT1/3 and MRP3/4 were purchased from Abbiotec (San Diego, CA). All other chemicals were obtained from standard sources.
Animals.
All animal studies were performed in accordance with the Guide for the Care and Use of Laboratory Animals as adopted and promulgated by the U.S. National Institutes of Health. Wild-type (PEPT2+/+) mice were generated in house (8 to 10 weeks old) as described previously. Animals were kept under temperature-controlled conditions with 12-h light and dark cycles and given a standard diet along with water ad libitum (Unit for Laboratory Animal Medicine, University of Michigan, Ann Arbor, MI).
Measurement of proinflammatory cytokine levels in plasma.
Gender-matched mice were given 5 mg/kg of LPS intraperitoneally to induce acute peripheral inflammation. Control animals were injected with normal saline. Plasma was collected by heart puncture 6 h after the administration of LPS, and concentrations of tumor necrosis factor alpha (TNF-α), interleukin-1β (IL-1β), and IL-6 were determined by using Single-Analyte ELISArray kits (Qiagen Inc., Valencia, CA).
Pharmacokinetic and tissue distribution studies.
Following 6 h of pretreatment with LPS or normal saline, gender-matched mice were anesthetized with sodium pentobarbital (40 to 60 mg/kg, intraperitoneally [i.p.]) and 1 nmol/g of [3H]cefadroxil (100 μl, 15 μCi) administered by tail vein injection. Serial blood samples (∼15 μl) were obtained via tail nicks at 0.25, 1, 2, 5, 15, 30, 45, 60, 90, and 120 min. Heparinized blood samples were immediately centrifuged at 3,300 × g for 3 min at room temperature to obtain plasma. The radioactivity in plasma samples was determined with a dual-channel liquid scintillation counter (Beckman LS 3801; Beckman Coulter Inc., Fullerton, CA).
For the tissue distribution study, mice were administered [14C]dextran 70,000 (0.25 μCi/mouse) intravenously (i.v.) 5 min before tissues were harvested to correct tissue cefadroxil concentrations for the vascular space. After the last blood sample was collected (120 min after i.v. injection of cefadroxil), a CSF sample was taken from the cisterna magna by puncture of the atlanto-occipital membrane with a 28-gauge needle. The mouse was immediately decapitated, and choroid plexus, cerebral cortex, whole-kidney, liver, lung, heart, and spleen samples were collected. Samples were weighed and solubilized with 1 M hyamine hydroxide as described by the manufacturer (MP Biomedicals). After solubilization, tissue homogenate radioactivity was determined by liquid scintillation counting after mixing with Ecolite liquid scintillation cocktail. Corrected tissue cefadroxil concentrations (Ctissue,corr, nanomoles per gram of wet tissue) were calculated with the equation Ctissue,corr = Ctissue − DS · Cb, where Ctissue is the uncorrected tissue cefadroxil concentration (nanomoles per gram), DS is the blood volume (milliliters per gram) determined as the dextran space (DS) of tissue samples estimated from dextran concentrations in the final blood sample (23), and Cb is the blood cefadroxil concentration (nanomoles per milliliter).
RT-PCR analysis of mRNA.
Choroid plexuses from the lateral and fourth ventricles, as well as kidneys, were rapidly harvested 6 h after pretreatment with LPS or normal saline and stored in RNAlater solution. For measurement of transport protein mRNA in the choroid plexus, each sample consisted of nine pooled plexuses from three mice. Total RNA was extracted from mouse tissues with Tri-Reagent (Molecular Research Center, Cincinnati, OH) according to the manufacturer's protocol. RNA was then reverse transcribed with 200 U of Omniscript reverse transcriptase (Qiagen Inc., Valencia, CA) and oligo(dT) as a primer. Real-time PCR was performed with the TaqMan system for PEPT1/2 and with the SYBR green system (ABI) for OAT1/3 and MRP3/4. PCR was initiated at 95°C for 10 min, followed by 40 cycles of denaturation at 95°C for 15 s, annealing at 60°C for 60 s, and extension at 72°C for 60 s, and terminated by a final extension for 7 min.
mRNA expression was presented as the ratio of the target gene to the housekeeping gene for glyceraldehyde 3-phosphate dehydrogenase (GAPDH) determined by the comparative CT method (24) with the equation , where CT is the cycle threshold of each gene.
Renal clearance studies.
Following 6 h of pretreatment with LPS or normal saline, gender-matched mice were anesthetized with sodium pentobarbital (40 to 60 mg/kg, i.p.) and [3H]cefadroxil (1 nmol/g) was then administered by tail vein injection along with [14C]inulin (73.6 mg/kg) for GFR determination. Serial blood samples were collected at 0.25, 1, 2, 5, 15, 30, 45, 60, 90, and 120 min, after which plasma was obtained by centrifugation. A urine sample was collected directly from the bladder at 120 min. Renal cefadroxil pharmacokinetics were investigated in the presence and absence of an OAT inhibitor, probenecid, to allow estimation of the fractional reabsorption and active tubular secretion of cefadroxil during inflammation. Probenecid (70 or 150 mg/kg, i.p.) was administered 45 min prior to, at time zero, and 45 and 90 min after the coinjection of [3H]cefadroxil and [14C]inulin. Plasma and urine radioactivity was determined with a dual-channel liquid scintillation counter.
Plasma protein binding of cefadroxil.
The unbound fraction of cefadroxil in the plasma of control and LPS-treated mice was measured by an ultrafiltration method as described previously by Shen et al. (25). Blank plasma aliquots from mice were spiked with cefadroxil to produce standard concentrations of 0.01, 0.1, 1, and 10 μM. To measure the effect of probenecid, the protein binding of a 1 μM cefadroxil plasma sample was also measured in the presence of probenecid (0.1, 1, and 10 mM). After incubation at 37°C for 15 min, plasma samples (200 μl) were loaded into Amicon Ultra-30K devices and centrifuged at 14,000 × g for 25 min at 37°C in accordance with the manufacturer's protocol. The unbound fraction was calculated by dividing the cefadroxil concentration in the ultrafiltrate by that in the original plasma sample.
Systemic pharmacokinetic analysis of cefadroxil.
Profiles of plasma cefadroxil concentrations versus time were best described by a two-compartment model with a weighting factor of 1/predicted value (WinNonlin version 5.2.1; Pharsight Inc., Mountain View, CA) by the equation , where C(t) is the plasma cefadroxil concentration at time t and C1 and C2 are the coefficients associated with the exponents λ1 and λ2, respectively. The quality of the fit was determined by Akaike information criterion values and visual inspection of residual plots. The area under the plasma drug concentration-time curve (AUC), the terminal half-life (t1/2), the rate constant of elimination from the central compartment (K10), the mean residence time (MRT), the volume of distribution at steady state (Vss), the volume of the central compartment (V1), and the total body clearance (CL) were determined by standard methods from WinNonlin.
Renal pharmacokinetic analysis of cefadroxil.
The renal clearances of cefadroxil (CLR) and inulin (GFR) were calculated by the equations CLR = Aecefadroxil(0-120)/AUCcefadroxil(0-120) and GFR = Aeinulin(0-120)/AUCinulin(0-120), where Ae(0-120) is the total amount of cefadroxil (or inulin) excreted unchanged in urine over 120 min and AUC(0-120) is the area under the plasma cefadroxil (or inulin) concentration-time curve from 0 to 120 min, as determined by the trapezoidal rule.
The renal excretion of cefadroxil is composed of glomerular filtration, tubular secretion, and tubular reabsorption (26, 27). Therefore, the renal clearance of cefadroxil (25) can be expressed by the equation CLR = fu · (GFR + CLS) · (1 − Fr), where fu is the unbound fraction of cefadroxil in plasma, CLS is the secretion clearance mediated by OATs, and Fr is the fraction of reabsorbed drug mediated by PEPT1 and PEPT2. Changes in GFR during inflammation were directly calculated by comparing inulin clearances in control and LPS-treated groups. In the presence of saturating concentrations of probenecid (CLS = 0), changes in Fr during inflammation were calculated by comparing the control and LPS-treated groups, since experimental values of CLR, fu, and GFR could be independently obtained in the study. On the basis of the experimentally estimated values of CLR, fu, GFR, and Fr, changes in CLS during inflammation could then be determined by comparing the control and LPS-treated groups in the absence of probenecid.
To normalize CLR for any differences in protein binding (fu) and functional nephron mass (GFR), the excretion ratio (ER) of cefadroxil was expressed as follows (28): ER = CLR/(fu · GFR).
Statistics.
All data are reported as means ± standard errors (SE). To determine statistically significant differences between two different groups, a two-sample t test was used and P ≤ 0.05 was considered statistically significant. For multiple comparisons, analysis of variance was performed, followed by pairwise comparisons by Tukey's test (GraphPad Prism, v4.0; GraphPad Software Inc., San Diego, CA).
RESULTS
Plasma proinflammatory cytokine concentrations during LPS-induced acute inflammation.
Plasma cytokine concentrations were measured 6 h after LPS treatment to ensure that acute inflammation was induced. LPS caused substantial increases in TNF-α (15-fold, P < 0.001), IL-6 (2,100-fold, P < 0.01), and IL-1β (610-fold, P < 0.05), all proinflammatory cytokines characterizing the acute immune response (Fig. 1). The proinflammatory cytokines IL-6, IL-1β, and TNF-α are known to be involved in numerous complex signaling cascades and trigger the production of acute-phase proteins (29). Moreover, it has been reported that these cytokines induce transcription factors that play a role in suppressing the expression of ABC transporters (30, 31) and perhaps other SLC transporters. Therefore, changes in the pharmacokinetic profile of cefadroxil were further investigated 6 h after LPS treatment.
Fig 1.
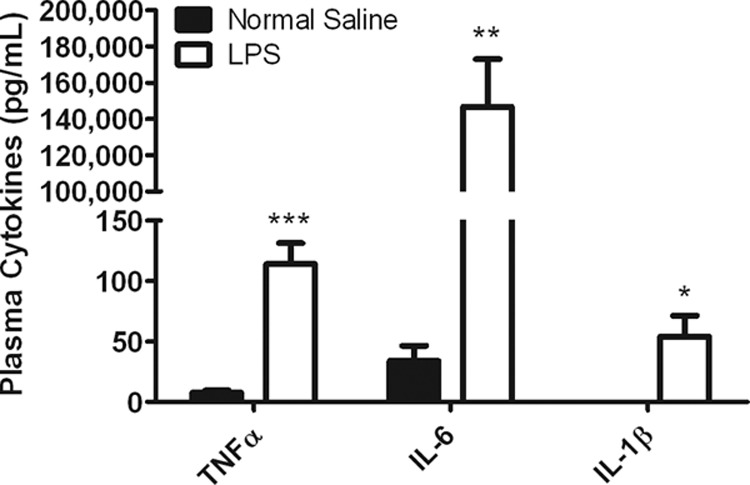
Proinflammatory cytokine levels in the plasma of mice treated with normal saline (control) and mice treated with 5 mg/kg LPS. Plasma was collected 6 h after i.p. administration of LPS or saline. Data are expressed as means ± SE (n = 5). *, P < 0.05; **, P < 0.01; ***, P < 0.001 (compared to the control).
Changes in cefadroxil pharmacokinetics during acute inflammation.
Plasma cefadroxil concentration-time profiles and pharmacokinetic parameters in control and LPS-treated mice were compared. Cefadroxil concentrations in plasma were significantly higher in LPS-treated mice (Fig. 2). A summary of the pharmacokinetic parameters studied is reported in Table 1. There were no significant differences in the maximum plasma drug concentration (Cmax), V1, or Vss, whereas significant reductions in K10 and CL were observed in LPS-treated animals (about 3-fold, P < 0.001). These changes resulted in approximately 3-fold increases in the AUC, MRT, and t1/2. It seems that LPS-induced acute inflammation affected mostly the elimination kinetics of cefadroxil and not the volume-of-distribution terms.
Fig 2.
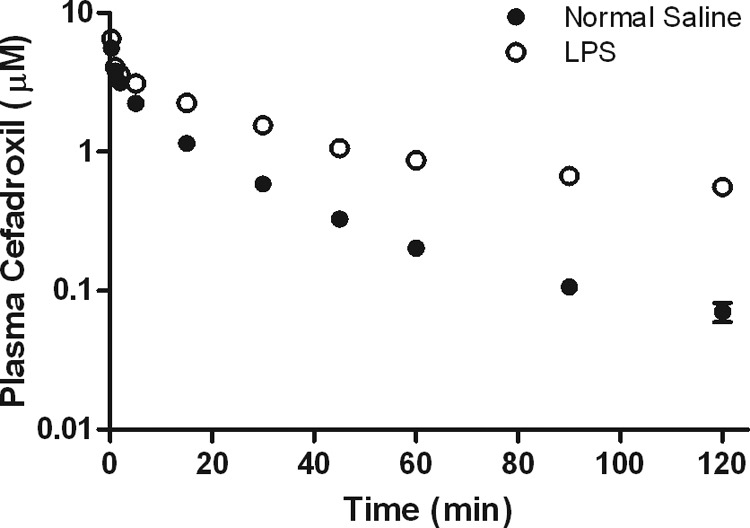
Effect of 5 mg/kg LPS-induced inflammation on the pharmacokinetic profile of cefadroxil (1-nmol/g i.v. bolus dose), where LPS was administered 6 h prior to cefadroxil. Data are expressed as means ± SE (n = 5).
Table 1.
Pharmacokinetic parameters of 1 nmol/g cefadroxil following an i.v. bolus dose in control and LPS-treated micea
| Parameter | Control | LPS |
|---|---|---|
| AUC (min · nmol/ml) | 63.6 ± 4.3 | 203 ± 23b |
| t1/2 (min) | 7.8 ± 0.7 | 24.0 ± 4.7c |
| K10 (min−1) | 0.092 ± 0.008 | 0.034 ± 0.006b |
| Cmax (μM) | 5.9 ± 0.9 | 6.3 ± 0.5 |
| MRT (min) | 26.0 ± 1.1 | 85.7 ± 11.8c |
| Vss (ml) | 7.1 ± 0.3 | 7.4 ± 0.5 |
| V1 (ml) | 3.1 ± 0.3 | 2.9 ± 0.3 |
| CL (ml/min) | 0.273 ± 0.007 | 0.090 ± 0.007b |
Data are expressed as means ± SE (n = 5).
P < 0.001 compared to the control (normal saline).
P < 0.01 compared to the control (normal saline).
Changes in tissue cefadroxil distribution during acute inflammation.
Figure 3A shows changes in cefadroxil concentrations in various tissues, CSF, and blood during LPS-induced acute inflammation. Significant increases in cefadroxil were observed in the CSF (4.8-fold), cerebral cortex (3.4-fold), heart (3.3-fold), lungs (3.2-fold), liver (5.0-fold), spleen (3.5-fold), and blood (5.1-fold) during LPS treatment. However, when the data were corrected for differences in blood drug concentrations between the control and LPS-treated groups, only the choroid plexus (5.0-fold decrease) and kidneys (2.3-fold decrease) displayed significant changes (Fig. 3B). When tissue-to-CSF concentration ratios were further investigated in the brain, the choroid plexus showed a significant decrease (2.5-fold, P < 0.01), whereas no difference was observed in the cerebral cortex with LPS treatment (Fig. 3C). On the basis of these findings, it appears that the choroid plexus and kidneys are the major tissues in which cefadroxil concentrations are affected by LPS-induced acute inflammation; therefore, changes in these tissues were studied further.
Fig 3.
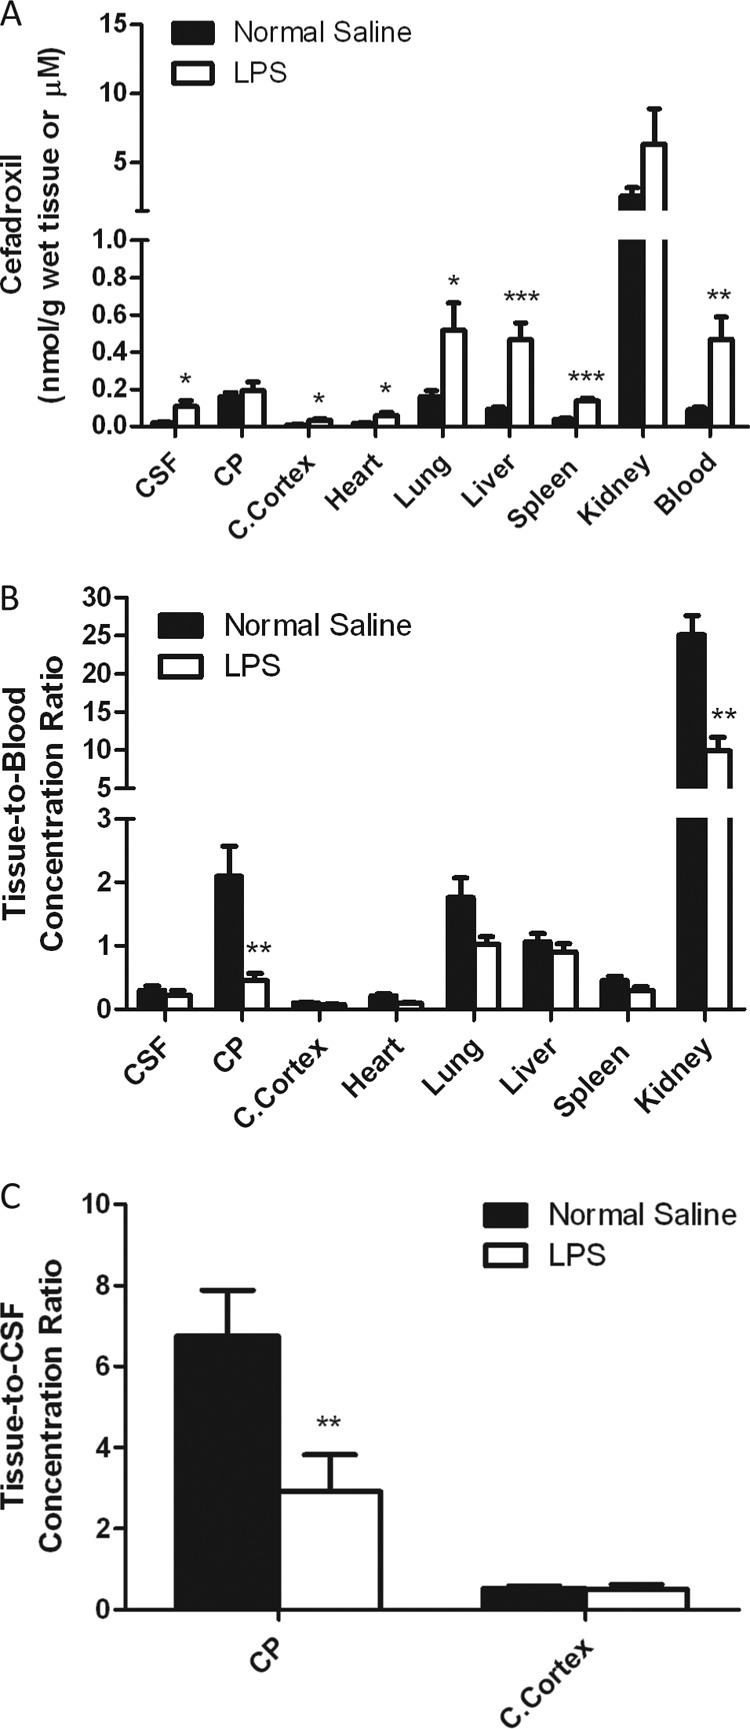
LPS-induced effects on tissue, CSF, and blood cefadroxil concentrations (A), the tissue-to-blood cefadroxil concentration ratio (B), and the tissue-to-CSF cefadroxil concentration ratio (C), where 5 mg/kg LPS was administered i.p. 4 h before an i.v. bolus dose of 1 nmol/g cefadroxil. Tissues, blood, and CSF were harvested 2 h after cefadroxil dosing (6 h after LPS dosing). Data are expressed as means ± SE (n = 4 to 8). *, P < 0.05; **, P < 0.01; ***, P < 0.001 (compared to the control [normal saline]). CP, choroid plexus; C.Cortex, cerebral cortex.
Effect of LPS on transporter mRNA expression.
The expression levels of several transporter mRNAs in the kidneys and choroid plexus were evaluated 6 h after LPS treatment, a time when there was a significant reduction in tissue-to-blood concentration ratios of cefadroxil. PEPT1/2, OAT1/3, and MRP3/4 are known to be involved in the transport of cefadroxil in epithelial cells (17, 32, 33) and are expressed in the kidneys and choroid plexus. Figure 4A shows that the mRNA expression of PEPT2, OAT1, OAT3, and MRP4 was mildly reduced by 19%, 33%, 27%, and 21%, respectively, in the kidneys following LPS treatment (P < 0.05). However, choroid plexus PEPT2, OAT3, and MRP4 expression was not changed by LPS-induced inflammation (Fig. 4B). Therefore, it appears unlikely that the substantial changes in cefadroxil disposition in the kidneys and choroid plexus are attributable to changes in the expression levels of relevant transporters.
Fig 4.
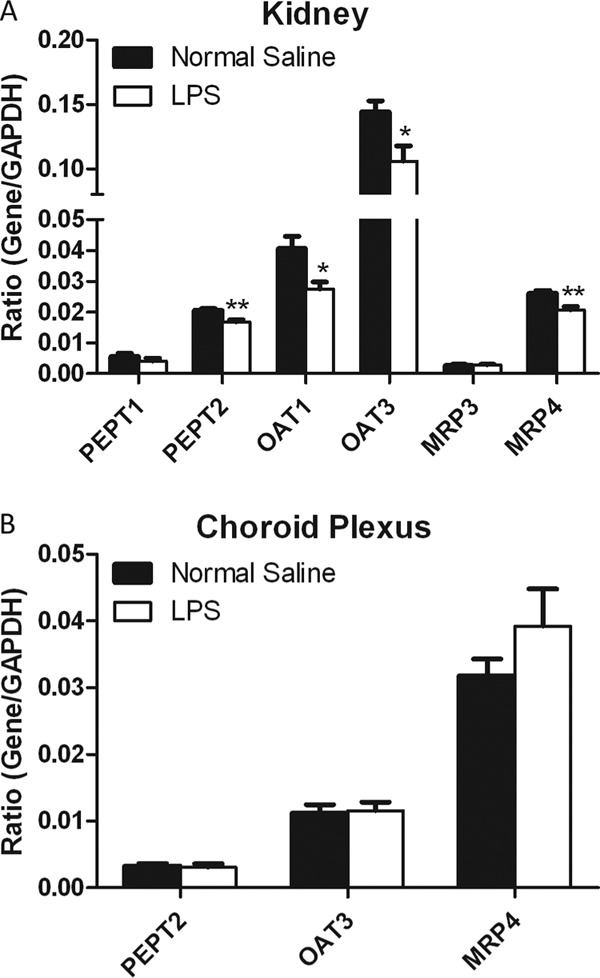
Effect of inflammation induced with 5 mg/kg LPS on transporter gene expression in the kidneys (A) and choroid plexus (B) 6 h after i.p. administration. Data are expressed as means ± SE (n = 4). *, P < 0.05; **, P < 0.01 (compared to the control [normal saline]).
Changes in renal cefadroxil clearance during acute inflammation.
As noted above, the systemic clearance of cefadroxil was reduced 3-fold during LPS-induced acute inflammation. Cefadroxil is excreted mainly by the kidneys, and renal clearance (which approximates systemic clearance) is a combination of glomerular filtration, tubular secretion, and tubular reabsorption. To investigate the impact of LPS treatment on each of these excretion processes, a renal clearance study was performed where probenecid was used to block the OAT-mediated renal secretion pathway.
Figure 5 shows the cefadroxil concentration-versus-time profiles in the absence and presence of probenecid (70 or 150 mg/kg). Coadministration of 70 mg/kg of probenecid significantly increased plasma cefadroxil concentrations. Even when the dose of probenecid coadministered was increased to 150 mg/kg, there was no further increase in the cefadroxil concentration, suggesting that a 70-mg/kg dose of probenecid is enough to completely block the renal secretion of cefadroxil. Therefore, a 70-mg/kg dose of probenecid was chosen for subsequent studies.
Fig 5.
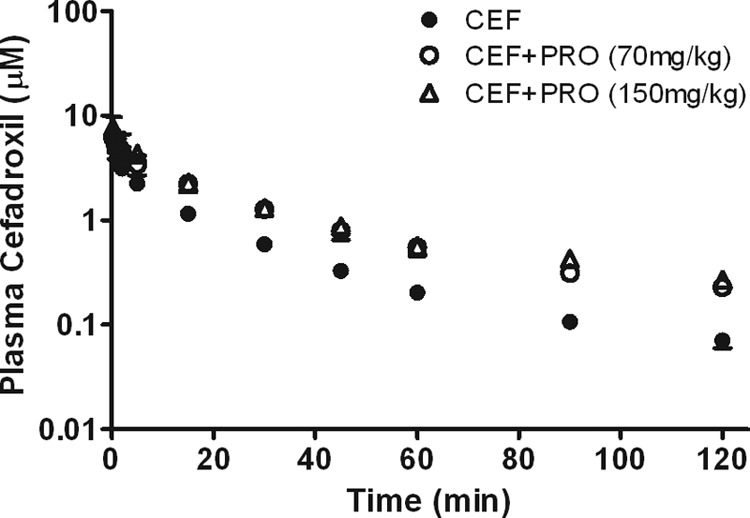
Profiles of plasma cefadroxil (CEF) concentrations versus time (1-nmol/g i.v. bolus dose) in the presence or absence of probenecid (PRO; 70 or 150 mg/kg). Data are expressed as means ± SE (n = 3 to 5).
Plasma cefadroxil and inulin concentrations in the absence or presence of probenecid in the control and LPS-treated groups were then compared (Fig. 6A and B). Pretreatment with LPS significantly increased both cefadroxil and inulin concentrations in plasma. Coadministration of probenecid further increased the plasma cefadroxil concentrations in both the control and LPS-treated groups, whereas the plasma inulin concentrations were not changed by probenecid, suggesting that GFR values were stable in the presence of probenecid (Table 2). The plasma protein binding of cefadroxil was not altered by either LPS treatment or probenecid coadministration, with essentially all of the drug being unbound in plasma (fu, ≥0.97). Most of the i.v. administered cefadroxil was excreted in urine over 2 h (95% in the control group), but the amount of cefadroxil excreted in urine in the LPS-treated group was significantly reduced (65%). The urinary recovery of administered cefadroxil was somewhat lower in the presence of probenecid (i.e., 95 versus 81% in the control group and 65 versus 51% in the LPS-treated group) because of its saturating effect on renal tubular secretion. The ER of cefadroxil was essentially unity in both the control and LPS-treated groups and was significantly reduced by probenecid (i.e., 1.01 versus 0.60 in the control group and 1.06 versus 0.61 in the LPS-treated group). The ER of cefadroxil was not changed by LPS treatment.
Fig 6.
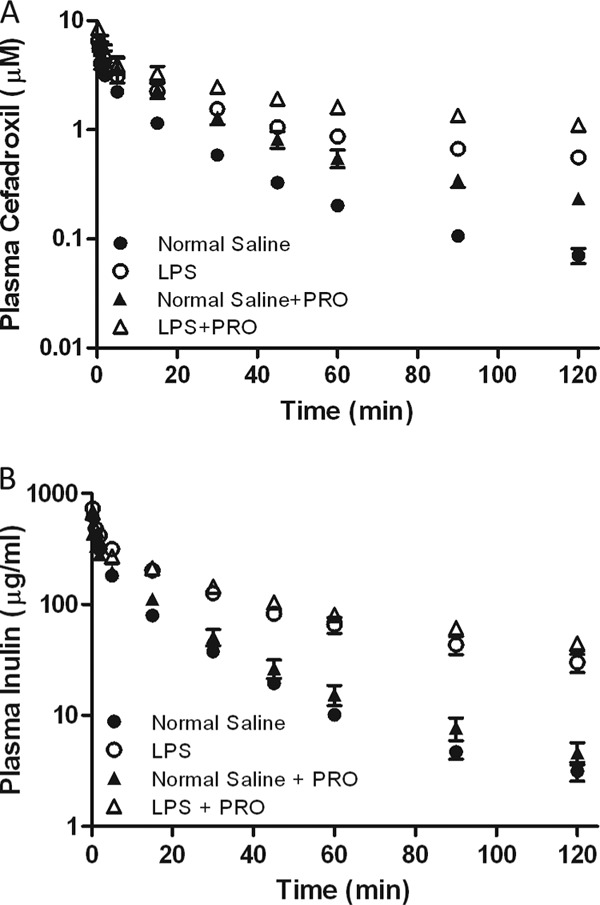
Effect of inflammation induced with 5 mg/kg LPS on the plasma concentration-versus-time profiles of cefadroxil (1-nmol/g i.v. bolus dose) (A) and inulin (73.6-mg/kg i.v. bolus dose) (B) in the presence or absence of probenecid (PRO; 70 mg/kg). Data are expressed as means ± SE (n = 4 or 5).
Table 2.
Renal pharmacokinetic parameters of 1 nmol/g cefadroxil following an i.v. bolus dose in control and LPS-treated mice in the absence or presence of probenecida
| Parameter | Control | LPS | Control + PRO | LPS + PRO |
|---|---|---|---|---|
| CLR (ml/min) | 0.256 ± 0.013A | 0.076 ± 0.009B | 0.127 ± 0.007C | 0.039 ± 0.004D |
| GFR (ml/min) | 0.254 ± 0.021A | 0.079 ± 0.029B | 0.212 ± 0.014A | 0.067 ± 0.009B |
| fu | 0.99 ± 0.01A | 0.97 ± 0.01A | 1.00 ± 0.03A | 1.00 ± 0.01A |
| fe0-120b | 0.95 ± 0.03A | 0.65 ± 0.03B | 0.81 ± 0.03C | 0.51 ± 0.05D |
| ER | 1.01 ± 0.04A | 1.06 ± 0.20A | 0.60 ± 0.03B | 0.61 ± 0.03B |
| Fr | 0.40A | 0.39A | 0.40 ± 0.03A | 0.39 ± 0.03A |
| CLS (ml/min) | 0.177 | 0.049 | 0 | 0 |
| CLS/GFR ratio | 0.70 | 0.63 | 0 | 0 |
A 70-mg/kg dose of probenecid (PRO) was administered. Data are expressed as means ± SE (n = 4 or 5). Different superscript letters denote significant differences between the treatment groups (α = 0.05) for a given parameter.
fe(0-120) is the fraction of cefadroxil excreted unchanged in urine over 120 min.
The renal clearance of cefadroxil was substantially decreased (about 3-fold) during LPS-induced acute inflammation (i.e., 0.256 versus 0.076 ml/min in the absence of probenecid and 0.127 versus 0.039 ml/min in the presence of probenecid). GFR values were also reduced by ∼3-fold in the LPS-treated groups (i.e., 0.254 versus 0.079 ml/min in the absence of probenecid and 0.212 versus 0.067 ml/min in the presence of probenecid). The fraction of drug reabsorbed (Fr) was about 40% in both the control and LPS-treated groups. Thus, it seems that renal tubular reabsorption was not changed during LPS-induced acute inflammation. Since the renal clearance, GFR, and fraction of drug reabsorbed were experimentally determined, the secretion clearance could be calculated for both control and LPS-treated animals. The secretion clearance was determined to be 0.177 ml/min in the control group and was substantially reduced (3.6-fold) to 0.049 ml/min in the LPS-treated group. However, when the secretion clearance (CLS) was corrected for LPS-induced changes in GFR, no significant difference in the CLS/GFR ratio between the control and LPS-treated groups was observed (i.e., 0.70 versus 0.63). Thus, it seems that the reduction in secretion clearance during LPS-mediated acute inflammation was due mainly to GFR changes and not to changes in the intrinsic clearance of cefadroxil-mediated transport.
DISCUSSION
Inflammation is a highly orchestrated process involving a variety of events that can induce changes in drug pharmacokinetics. In the present study, we showed that the disposition of cefadroxil was substantially changed during LPS-induced acute inflammation. Specifically, we demonstrated that: (i) the renal clearance of cefadroxil was reduced 3-fold during the inflammatory response; (ii) the functional nephron mass (as reflected by GFR) was decreased 3-fold during LPS treatment, such that the GFR-corrected renal and secretory clearance values were not different from those found during normal saline treatment; (iii) cefadroxil distribution into the kidneys and choroid plexus was reduced 2.5- and 4.6-fold, respectively, by LPS-induced inflammation; and (iv) changes in transporter expression played only a minor role, at best, in affecting the distribution of cefadroxil during LPS-mediated acute inflammation.
In this study, GFR was reduced 3-fold by LPS-induced inflammation, and it seems that the renal dysfunction associated with GFR reductions was responsible for the substantial increase in plasma cefadroxil concentration-time profiles. GFR reduction by inflammatory stimuli has been reported previously (19–21). In clinical trials, GFR reduction was reported during inflammation especially when blood flow and/or blood pressure were substantially reduced, for example, in hypodynamic septic shock associated with a lowered cardiac output, which leads to a significant reduction in the clearance of a variety of drugs (34). In previous studies, i.p. injection of 5 mg/kg of LPS, the same dose used in this study, was reported to induce substantial reductions in both renal blood flow and GFR without changes in blood pressure (20, 35).
The reduced renal tubular secretion of cefadroxil observed during LPS-mediated acute inflammation can also be explained by renal dysfunction, as judged by GFR reductions in this study. Renal secretion clearance is dependent upon renal blood flow (Q), the unbound fraction of a drug in blood (fu), and intrinsic secretory clearance (CLint,s), depending on whether the drug has a high extraction ratio [fu · CLint,S ≫ Q and CLS = (Q · fu · CLint,s)/(Q + fu · CLint,s) ≈ Q] or a low extraction ratio [fu · CLint,s ≪ Q and CLS = (Q · fu · CLint,s)/(Q + fu · CLint,s) = fu · CLint,s]. In comparing the secretion clearance of cefadroxil (0.177 ml/min, Table 2) to renal blood flow in mice (1.3 ml/min) (36), cefadroxil seems to be a low-extraction drug. Moreover, protein binding of cefadroxil was negligible (fu ≈ 1, Table 2) and the efficiency of renal secretion per unit nephron (CLS/GFR) was very similar between the control and LPS-treated groups (0.70 versus 0.63, Table 2). Therefore, it seems that the reduced renal secretion during LPS-mediated inflammation is driven mainly by a reduction in the functional nephron mass, which leads to reduced intrinsic secretory clearance of cefadroxil. However, even though it appears that reduced renal blood flow cannot be directly translated into reduced renal secretion of cefadroxil, we cannot rule out the possibility that hypoxia or redistribution of renal blood flow during LPS-induced inflammation can change the renal secretion of cefadroxil via altered transporter activity (10, 37, 38). Such changes could also affect the distribution of cefadroxil into the kidneys, as observed in this study (Fig. 3B).
RT-PCR confirmed that changes in the renal distribution of cefadroxil were not due to changes in the expression of relevant transporters (i.e., PEPT1/2, OAT1/3, and MRP3/4). Although OAT2 is also expressed in the proximal tubules of mouse and rat kidneys, at the brush border membrane (39), it interacts weakly with cefadroxil in which the inhibitory concentration that reduces prostaglandin F2α uptake by 50% is ≥5 mM for rat and human OAT2 and ≥1.8 mM for rat OAT1/3 when expressed in Xenopus oocytes (16). Given the number of OATs present in the kidney; the location of OAT2 at apical and not basolateral membranes, as is the case for OAT1/3; and the weak affinity of cefadroxil for OAT2, it is unlikely that changes in OAT2 gene expression would have a significant effect on the renal distribution of cefadroxil.
In addition to the changes observed in the kidneys, a substantial decrease in the distribution of cefadroxil in the choroid plexus was observed during acute inflammation (Fig. 3B). From the RT-PCR study, we confirmed that this reduction was not due to changes in the expression of relevant drug transporters (Fig. 4B). Cefadroxil may also be transported by peptide/histidine transporter 1 (PHT1), which is known to be expressed in the choroid plexus. However, it was demonstrated that the apical uptake of cefadroxil in rat choroid plexus cell monolayers was not affected by l-histidine, precluding the PHT1-mediated uptake of cefadroxil in this tissue (40). In the same study, only a nonsaturable component was reported to exist for the basolateral uptake of cefadroxil in choroid plexus cell monolayers. Therefore, the reduced choroid plexus-to-blood concentration ratio of cefadroxil during inflammation may be explained by hypoperfusion of this tissue because of reduced blood flow (38) or reduced CSF efflux of cefadroxil into the choroid plexus, where PEPT2 and OAT play an important role. To evaluate if there are changes in the CSF efflux of cefadroxil into brain tissues during LPS-mediated inflammation, tissue-to-CSF concentration ratios in the choroid plexus and cerebral cortex were further investigated (Fig. 3C). The results indicate that cefadroxil uptake at the apical membrane of the choroid plexus was significantly disrupted, whereas cefadroxil distribution between the CSF and cerebral cortex was not changed by LPS-mediated acute inflammation. It has been reported that PEPT2 is responsible for 80 to 85% of cefadroxil uptake into the choroid plexus and the remaining 15 to 20% is mediated by OAT and nonsaturable mechanisms. Considering that a major driving force of PEPT2-mediated transport is the proton gradient, it is possible that changes in the cytoplasmic pH environment of tissue during acute inflammation may affect the functional activity of PEPT2 in apical membranes of choroid plexus epithelia (41–43). Future studies should investigate the underlying mechanism of reduced cefadroxil distribution into the choroid plexus during LPS-mediated acute inflammation.
In the present study, drug transporters were less likely to be involved in inflammation-mediated changes in cefadroxil pharmacokinetics. However, it has been increasingly reported that the expression of drug transporters is downregulated during inflammation, thereby affecting the disposition of drug substrates (5). Little is known about possible changes in PEPT2 expression during inflammation, but one recent study showed that the PEPT2 gene in the choroid plexus was significantly upregulated under LPS-induced peripheral inflammation (22). However, that study did not specify when PEPT2 gene expression started to change after LPS treatment or the extent of the change compared to the control. Another study reported that both mRNA and protein expression levels of OATs in the kidney were decreased by 30 to 50% at 12 h following LPS treatment (7). In our study, the PEPT2 and OAT mRNA expression levels were unchanged in the choroid plexus and only mildly decreased (by 20 to 30%) in the kidneys (Fig. 4). One possible reason for this is that the 6-h pretreatment of LPS may be too early to induce significant alterations in drug transporter expression. In previous studies, changes in drug transporter protein expression were usually reported later than when mRNA expression was maximally changed, and LPS-induced alterations in protein expression were commonly observed at least 12 to 48 h after LPS treatment (7, 44–46). Therefore, it may be worthwhile to investigate if PEPT2 and OAT protein expression levels are changed 12 to 48 h after LPS treatment and, if so, how changes in drug transporters induce alterations in cefadroxil pharmacokinetics.
Although the distribution of cefadroxil was significantly decreased in the kidneys and choroid plexus, these changes were not translated into changes in the volume of distribution (Table 1). In severe inflammations such as septic shock, various endogenous mediators are reported to promote endothelial damage, which results in increased capillary permeability (47–49). This capillary leakage has large amounts of fluid shifting from the intravascular space to the interstitium, called the “third spacing” phenomenon. For hydrophilic antibiotics with a relatively small volume of distribution, such as β-lactams, the volume of distribution can be significantly increased by this third spacing phenomenon, leading to significant reductions in plasma and tissue drug concentrations (50, 51). Increased volumes of distribution have been observed in the hyperdynamic state of sepsis, whereas these volumes were not changed in the hypodynamic state of sepsis (52). Even though the volumes of distribution of cefadroxil were not changed by inflammatory stimuli in the present study, changes in the volume of distribution during inflammation should still be monitored for hydrophilic antibiotics such as cefadroxil to be on the safe side of dosing recommendations.
In conclusion, this study demonstrates that the renal clearance of cefadroxil is substantially reduced under LPS-mediated acute inflammation, thereby resulting in significant increases in plasma cefadroxil concentration-time profiles. Our findings suggest that dose adjustments would be necessary for those therapeutic agents that are excreted primarily by the kidney and have narrow therapeutic indices. For example, cephaloridine, another β-lactam antibiotic, is renally excreted and exhibits OAT-mediated tubular secretion. Unlike cefadroxil, cephaloridine can cause severe renal toxicity if serum drug concentrations exceed the therapeutic limit (53). In addition, aminoglycoside antibiotics, such as vancomycin, are also renally excreted and can have severe side effects such as nephrotoxicity and ototoxicity. Therefore, for these predominantly renally eliminated drugs, decreased clearances and corresponding increased plasma drug concentrations during inflammation necessitate that they be carefully monitored to ensure both efficacy and safety during their use.
ACKNOWLEDGMENT
This work was supported by Public Health Service grant GM-035498 from the National Institute of General Medical Sciences.
Footnotes
Published ahead of print 30 September 2013
REFERENCES
- 1. Cressman AM, Petrovic V, Piquette-Miller M. 2012. Inflammation-mediated changes in drug transporter expression/activity: implications for therapeutic drug response. Expert Rev. Clin. Pharmacol. 5:69–89 [DOI] [PubMed] [Google Scholar]
- 2. Ruot B, Béchereau F, Bayle G, Breuillé D, Obled C. 2002. The response of liver albumin synthesis to infection in rats varies with the phase of the inflammatory process. Clin. Sci. (Lond.) 102:107–114 [PubMed] [Google Scholar]
- 3. Moshage HJ, Janssen JA, Franssen JH, Hafkenscheid JC, Yap SH. 1987. Study of the molecular mechanism of decreased liver synthesis of albumin in inflammation. J. Clin. Invest. 79:1635–1641 [DOI] [PMC free article] [PubMed] [Google Scholar]
- 4. Don BR, Kaysen G. 2004. Serum albumin: relationship to inflammation and nutrition. Semin. Dial. 17:432–437 [DOI] [PubMed] [Google Scholar]
- 5. Morgan ET, Goralski KB, Piquette-Miller M, Renton KW, Robertson GR, Chaluvadi MR, Charles KA, Clarke SJ, Kacevska M, Liddle C, Richardson TA, Sharma R, Sinal CJ. 2008. Regulation of drug-metabolizing enzymes and transporters in infection, inflammation, and cancer. Drug Metab. Dispos. 36:205–216 [DOI] [PubMed] [Google Scholar]
- 6. Morgan ET. 2009. Impact of infectious and inflammatory disease on cytochrome P450-mediated drug metabolism and pharmacokinetics. Clin. Pharmacol. Ther. 85:434–438 [DOI] [PMC free article] [PubMed] [Google Scholar]
- 7. Höcherl K, Schmidt C, Bucher M. 2009. COX-2 inhibition attenuates endotoxin-induced downregulation of organic anion transporters in the rat renal cortex. Kidney Int. 75:373–380 [DOI] [PubMed] [Google Scholar]
- 8. Thadhani R, Pascual M, Bonventre JV. 1996. Acute renal failure. N. Engl. J. Med. 334:1448–1460 [DOI] [PubMed] [Google Scholar]
- 9. Levy EM, Viscoli CM, Horwitz RI. 1996. The effect of acute renal failure on mortality. A cohort analysis. JAMA 275:1489–1494 [PubMed] [Google Scholar]
- 10. De Paepe P, Belpaire FM, Buylaert WA. 2002. Pharmacokinetic and pharmacodynamic considerations when treating patients with sepsis and septic shock. Clin. Pharmacokinet. 41:1135–1151 [DOI] [PubMed] [Google Scholar]
- 11. Quintiliani R. 1982. A review of the penetration of cefadroxil into human tissue. J. Antimicrob. Chemother. 10(Suppl B):33–38 [DOI] [PubMed] [Google Scholar]
- 12. Tanrisever B, Santella PJ. 1986. Cefadroxil. A review of its antibacterial, pharmacokinetic and therapeutic properties in comparison with cephalexin and cephradine. Drugs 32(Suppl 3):1–16 [DOI] [PubMed] [Google Scholar]
- 13. Quintiliani R. 1986. Efficacy of a twice-daily regimen of cefadroxil in the treatment of respiratory tract infections. Drugs 32(Suppl 3):43–49 [DOI] [PubMed] [Google Scholar]
- 14. Nightingale C. 1980. Pharmacokinetics of the oral cephalosporins in adults. J. Int. Med. Res. 8:2–8 [PubMed] [Google Scholar]
- 15. Leroy A, Humbert G, Godin M, Fillastre JP. 1982. Pharmacokinetics of cefadroxil in patients with impaired renal function. J. Antimicrob. Chemother. 10(Suppl B):39–46 [DOI] [PubMed] [Google Scholar]
- 16. Khamdang S, Takeda M, Babu E, Noshiro R, Onozato ML, Tojo A, Enomoto A, Huang XL, Narikawa S, Anzai N, Piyachaturawat P, Endou H. 2003. Interaction of human and rat organic anion transporter 2 with various cephalosporin antibiotics. Eur. J. Pharmacol. 465:1–7 [DOI] [PubMed] [Google Scholar]
- 17. Ganapathy ME, Brandsch M, Prasad PD, Ganapathy V, Leibach FH. 1995. Differential recognition of beta-lactam antibiotics by intestinal and renal peptide transporters, PEPT 1 and PEPT 2. J. Biol. Chem. 270:25672–25677 [DOI] [PubMed] [Google Scholar]
- 18. Wang W, Zolty E, Falk S, Summer S, Zhou Z, Gengaro P, Faubel S, Alp N, Channon K, Schrier R. 2008. Endotoxemia-related acute kidney injury in transgenic mice with endothelial overexpression of GTP cyclohydrolase-1. Am. J. Physiol. Renal Physiol. 294:F571–F576 [DOI] [PubMed] [Google Scholar]
- 19. Schmidt C, Höcherl K, Schweda F, Kurtz A, Bucher M. 2007. Regulation of renal sodium transporters during severe inflammation. J. Am. Soc. Nephrol. 18:1072–1083 [DOI] [PubMed] [Google Scholar]
- 20. Wang W, Jittikanont S, Falk SA, Li P, Feng L, Gengaro PE, Poole BD, Bowler RP, Day BJ, Crapo JD, Schrier RW. 2003. Interaction among nitric oxide, reactive oxygen species, and antioxidants during endotoxemia-related acute renal failure. Am. J. Physiol. Renal Physiol. 284:F532–F537 [DOI] [PubMed] [Google Scholar]
- 21. Wang W, Li C, Summer SN, Falk S, Ljubanovic D, Schrier RW. 2008. Role of AQP1 in endotoxemia-induced acute kidney injury. Am. J. Physiol. Renal Physiol. 294:F1473–1480 [DOI] [PubMed] [Google Scholar]
- 22. Marques F, Sousa JC, Coppola G, Falcao AM, Rodrigues AJ, Geschwind DH, Sousa N, Correia-Neves M, Palha JA. 2009. Kinetic profile of the transcriptome changes induced in the choroid plexus by peripheral inflammation. J. Cereb. Blood Flow Metab. 29:921–932 [DOI] [PubMed] [Google Scholar]
- 23. Keep RF, Si X, Shakui P, Ennis SR, Betz AL. 1999. Effect of amiloride analogs on DOCA-salt-induced hypertension in rats. Am. J. Physiol. 276:H2215–H2220 [DOI] [PubMed] [Google Scholar]
- 24. Schmittgen TD, Livak KJ. 2008. Analyzing real-time PCR data by the comparative C(T) method. Nat. Protoc. 3:1101–1108 [DOI] [PubMed] [Google Scholar]
- 25. Shen H, Ocheltree SM, Hu Y, Keep RF, Smith DE. 2007. Impact of genetic knockout of PEPT2 on cefadroxil pharmacokinetics, renal tubular reabsorption, and brain penetration in mice. Drug Metab. Dispos. 35:1209–1216 [DOI] [PubMed] [Google Scholar]
- 26. Bins JW, Mattie H. 1988. Saturation of the tubular excretion of beta-lactam antibiotics. Br. J. Clin. Pharmacol. 25:41–50 [DOI] [PMC free article] [PubMed] [Google Scholar]
- 27. García-Carbonell MC, Granero L, Torres-Molina F, Aristorena JC, Chesa-Jimenez J, Pla-Delfina JM, Peris-Ribera JE. 1993. Nonlinear pharmacokinetics of cefadroxil in the rat. Drug Metab. Dispos. 21:215–217 [PubMed] [Google Scholar]
- 28. Ocheltree SM, Shen H, Hu Y, Keep RF, Smith DE. 2005. Role and relevance of peptide transporter 2 (PEPT2) in the kidney and choroid plexus: in vivo studies with glycylsarcosine in wild-type and PEPT2 knockout mice. J. Pharmacol. Exp. Ther. 315:240–247 [DOI] [PubMed] [Google Scholar]
- 29. Gabay C, Kushner I. 1999. Acute-phase proteins and other systemic responses to inflammation. N. Engl. J. Med. 340:448–454 [DOI] [PubMed] [Google Scholar]
- 30. Ho EA, Piquette-Miller M. 2007. KLF6 and HSF4 transcriptionally regulate multidrug resistance transporters during inflammation. Biochem. Biophys. Res. Commun. 353:679–685 [DOI] [PubMed] [Google Scholar]
- 31. Sukhai M, Yong A, Kalitsky J, Piquette-Miller M. 2000. Inflammation and interleukin-6 mediate reductions in the hepatic expression and transcription of the mdr1a and mdr1b genes. Mol. Cell Biol. Res. Commun. 4:248–256 [DOI] [PubMed] [Google Scholar]
- 32. Takeda M, Babu E, Narikawa S, Endou H. 2002. Interaction of human organic anion transporters with various cephalosporin antibiotics. Eur. J. Pharmacol. 438:137–142 [DOI] [PubMed] [Google Scholar]
- 33. de Waart DR, van de Wetering K, Kunne C, Duijst S, Paulusma CC, Oude Elferink RP. 2012. Oral availability of cefadroxil depends on ABCC3 and ABCC4. Drug Metab. Dispos. 40:515–521 [DOI] [PubMed] [Google Scholar]
- 34. Pentel P, Benowitz N. 1984. Pharmacokinetic and pharmacodynamic considerations in drug therapy of cardiac emergencies. Clin. Pharmacokinet. 9:273–308 [DOI] [PubMed] [Google Scholar]
- 35. Wang W, Falk SA, Jittikanont S, Gengaro PE, Edelstein CL, Schrier RW. 2002. Protective effect of renal denervation on normotensive endotoxemia-induced acute renal failure in mice. Am. J. Physiol. Renal Physiol. 283:F583–587 [DOI] [PubMed] [Google Scholar]
- 36. Davies B, Morris T. 1993. Physiological parameters in laboratory animals and humans. Pharm. Res. 10:1093–1095 [DOI] [PubMed] [Google Scholar]
- 37. Rodríguez CA, Smith DE. 1992. Influence of angiotensin II-induced alterations in renal flow on excretion of cefonicid in isolated perfused rat kidneys. Antimicrob. Agents Chemother. 36:616–619 [DOI] [PMC free article] [PubMed] [Google Scholar]
- 38. Hinshaw LB. 1996. Sepsis/septic shock: participation of the microcirculation: an abbreviated review. Crit. Care Med. 24:1072–1078 [DOI] [PubMed] [Google Scholar]
- 39. Ljubojević M, Balen D, Breljak D, Kusan M, Anzai N, Bahn A, Burckhardt G, Sabolić I. 2007. Renal expression of organic anion transporter OAT2 in rats and mice is regulated by sex hormones. Am. J. Physiol. Renal Physiol. 292:F361–F372 [DOI] [PubMed] [Google Scholar]
- 40. Shen H, Keep RF, Hu Y, Smith DE. 2005. PEPT2 (Slc15a2)-mediated unidirectional transport of cefadroxil from cerebrospinal fluid into choroid plexus. J. Pharmacol. Exp. Ther. 315:1101–1108 [DOI] [PubMed] [Google Scholar]
- 41. Silver IA. 1977. Tissue pO2 changes in acute inflammation. Adv. Exp. Med. Biol. 94:769–774 [DOI] [PubMed] [Google Scholar]
- 42. Sawyer RG, Spengler MD, Adams RB, Pruett TL. 1991. The peritoneal environment during infection. The effect of monomicrobial and polymicrobial bacteria on pO2 and pH. Ann. Surg. 213:253–260 [DOI] [PMC free article] [PubMed] [Google Scholar]
- 43. Swallow CJ, Grinstein S, Rotstein OD. 1992. Lipopolysaccharide impairs macrophage cytoplasmic pH regulation under conditions simulating the inflammatory microenvironment. J. Leukoc. Biol. 52:395–399 [DOI] [PubMed] [Google Scholar]
- 44. Piquette-Miller M, Pak A, Kim H, Anari R, Shahzamani A. 1998. Decreased expression and activity of P-glycoprotein in rat liver during acute inflammation. Pharm. Res. 15:706–711 [DOI] [PubMed] [Google Scholar]
- 45. Hartmann G, Kim H, Piquette-Miller M. 2001. Regulation of the hepatic multidrug resistance gene expression by endotoxin and inflammatory cytokines in mice. Int. Immunopharmacol. 1:189–199 [DOI] [PubMed] [Google Scholar]
- 46. Hartmann G, Cheung AK, Piquette-Miller M. 2002. Inflammatory cytokines, but not bile acids, regulate expression of murine hepatic anion transporters in endotoxemia. J. Pharmacol. Exp. Ther. 303:273–281 [DOI] [PubMed] [Google Scholar]
- 47. Bochud PY, Calandra T. 2003. Pathogenesis of sepsis: new concepts and implications for future treatment. BMJ 326:262–266 [DOI] [PMC free article] [PubMed] [Google Scholar]
- 48. Glauser MP, Zanetti G, Baumgartner JD, Cohen J. 1991. Septic shock: pathogenesis. Lancet 338:732–736 [DOI] [PubMed] [Google Scholar]
- 49. Bone RC. 1991. The pathogenesis of sepsis. Ann. Intern. Med. 115:457–469 [DOI] [PubMed] [Google Scholar]
- 50. Joynt GM, Lipman J, Gomersall CD, Young RJ, Wong EL, Gin T. 2001. The pharmacokinetics of once-daily dosing of ceftriaxone in critically ill patients. J. Antimicrob. Chemother. 47:421–429 [DOI] [PubMed] [Google Scholar]
- 51. Lipman J, Wallis SC, Rickard CM, Fraenkel D. 2001. Low cefpirome levels during twice daily dosing in critically ill septic patients: pharmacokinetic modelling calls for more frequent dosing. Intensive Care Med. 27:363–370 [DOI] [PubMed] [Google Scholar]
- 52. Tang GJ, Tang JJ, Lin BS, Kong CW, Lee TY. 1999. Factors affecting gentamicin pharmacokinetics in septic patients. Acta Anaesthesiol. Scand. 43:726–730 [DOI] [PubMed] [Google Scholar]
- 53. Takeda M, Tojo A, Sekine T, Hosoyamada M, Kanai Y, Endou H. 1999. Role of organic anion transporter 1 (OAT1) in cephaloridine (CER)-induced nephrotoxicity. Kidney Int. 56:2128–2136 [DOI] [PubMed] [Google Scholar]