Abstract
Ashbya gossypii grows as multinucleated and constantly elongating hyphae. Nuclei are in continuous forward and backward motion, also move during mitosis, and frequently bypass each other. Whereas these nuclear movements are well documented, comparatively little is known about the density and morphology of organelles which very likely influence these movements. To understand the three-dimensional subcellular organization of hyphae at high resolution, we performed large-scale electron tomography of the tip regions in A. gossypii. Here, we present a comprehensive space-filling model in which most membrane-limited organelles including nuclei, mitochondria, endosomes, multivesicular bodies, vacuoles, autophagosomes, peroxisomes, and vesicles are modeled. Nuclei revealed different morphologies and protrusions filled by the nucleolus. Mitochondria are very abundant and form a tubular network with a polarized spherical fraction. The organelles of the degradative pathways show a clustered organization. By analyzing vesicle-like bodies, we identified three size classes of electron-dense vesicles (∼200, ∼150, and ∼100 nm) homogeneously distributed in the cytoplasm which most likely represent peroxisomes. Finally, coated and uncoated vesicles with approximately 40-nm diameters show a polarized distribution toward the hyphal tip with the coated vesicles preferentially localizing at the hyphal periphery.
INTRODUCTION
Filamentous fungi have adopted a very characteristic growth mode. Their multinucleated cells, called hyphae, continuously and strictly elongate by polar surface expansion at the tips. The occasionally forming branches also continuously elongate, which leads to the typical fast-spreading network of a fungal mycelium. At the cellular level, the volume of a hypha or branch enlarges only in the direction of the growing tip, which leads to a continuous stream of cytoplasm toward the tip. The speed of the cytoplasmic stream depends on the speed of growth of the tip. Nuclei can passively comigrate with the cytoplasmic stream, which seems to be the mechanism of nuclear transport in mature hyphae of Neurospora crassa (1). In other filamentous fungi like Aspergillus nidulans and Ashbya gossypii, the cytoplasmic microtubule (cMT) cytoskeleton plays an active role in nuclear migration (2, 3). For example, nuclei in A. gossypii can migrate up to 10 times faster than the cytoplasmic stream and also frequently migrate against the stream during short-range bidirectional movements and during long-range nuclear bypassing. These movements depend on cMTs emanating from nuclear microtubule organization centers (MTOCs) because in the presence of MT-depolymerizing drugs or in mutants with defective MTOCs, nuclei migrate with the speed of the cytoplasmic stream (3, 4).
Details about the cMT-dependent mechanisms of nuclear migration in A. gossypii hyphae are well documented (5–7), but comparatively little is known about the density and morphology of organelles in hyphae which most likely will interfere with nuclear movements. Imaging of fluorescently labeled organelles have already shown dense tubular networks of mitochondria, nuclei surrounded by endoplasmic reticulum, or tubular and large spherical vacuoles in several filamentous fungi, including A. gossypii (8–11). These visualizations of individual organelles are very important for colocalization experiments but have so far not generated a comprehensive view of nuclei and other organelles within hyphae.
We therefore employed electron tomography to establish for the first time a high-resolution, three-dimensional (3D) map of nuclei, mitochondria, vacuoles, endosomes, multivesicular bodies (MVBs), peroxisomes, and vesicles within a hyphal tip segment. In the first step, we reconstructed serial 300-nm-thick sections of 12-μm-long tip segments of hyphae and stacked them to obtain a complete view of a hypha. We then tracked the membranes of organelles and vesicles to determine their density and 3D organization. We found that nuclei frequently assume irregular shapes with protrusions and that mitochondria form an abundant and highly branched network with a spherical fraction polarized toward the hyphal tip. Organelles of the degradation pathway aggregate in distinct clusters, while peroxisomes are randomly distributed. Finally, coated and uncoated vesicles show a polarized distribution toward the hyphal tip.
MATERIALS AND METHODS
Electron tomography.
The biological material for our study was obtained by incubating spores of A. gossypii for 10 h at 30°C in liquid YPD (10% yeast extract, 20% peptone, 20% glucose) supplemented with 1 g/liter myo-inositol. During this time, germ bubbles form with two to three slowly growing hyphae which occasionally already have started branching. These young mycelia were isolated by filtration and immediately cryoimmobilized by high-pressure freezing using Leica EMPACT-2 (Leica Microsystems, Vienna, Austria). Care was taken that the hyphae were surrounded by medium during the filtration step, and the wet filters were placed on YPD plates for handling so that nutrient conditions stayed unchanged until freezing. Freeze substitution of the cells was done using an EM-AFS2 instrument (Leica Microsystems, Vienna, Austria) with a solution containing 0.2% uranyl acetate, 0.1% glutaraldehyde, and 1% water dissolved in anhydrous acetone at −90°C for 50 h. The temperature was then increased at a rate of 5°C/h to −45°C, followed by 5 h of incubation at −45°C. The samples were rinsed with acetone and infiltrated with Lowicryl HM 20 (Polysciences, Warrington, PA, USA). This embedding medium was chosen because of its advantageous properties and its use in previous successful full cell volume reconstruction of fission yeast (12). Infiltration started at −45°C with 25% Lowicryl HM 20 in acetone for 2 h and continued with 50% Lowicryl HM 20 for 2 h and 75% Lowicryl HM 20 for 2 h. The samples were then incubated in 100% Lowicryl HM 20 for 12 h and in new 100% Lowicryl HM 20 for 2 h before polymerization. UV polymerization was applied for 48 h at −45°C and then again at room temperature for 48 h.
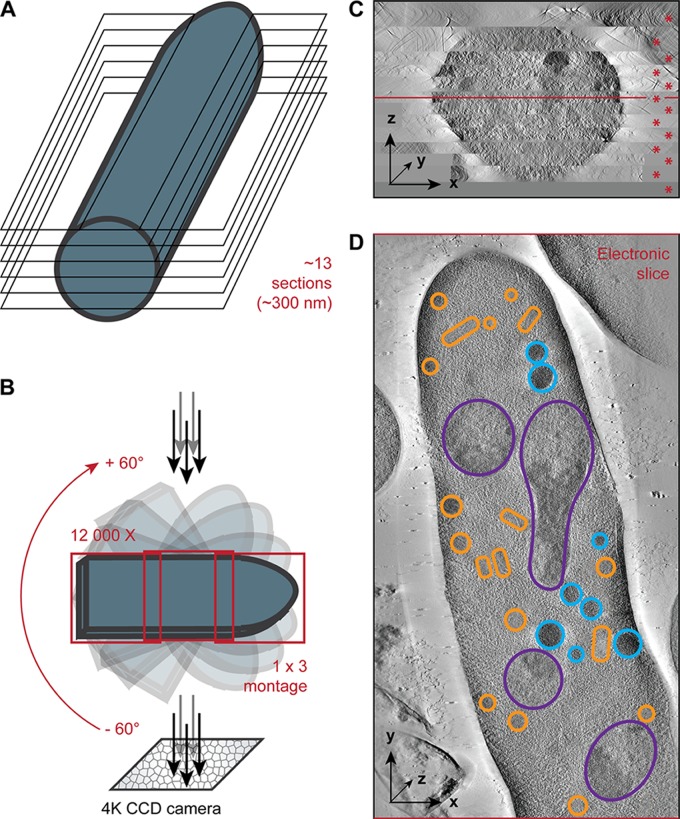
Serial thick sections (300 nm thick) were cut using a Reichert Ultracut-E microtome (Leica Microsystems). Sections were collected on Formvar-coated palladium-copper slot grids and poststained with 4% uranyl acetate in 70% methanol for 10 min and with lead citrate for 3 min. Digital images were taken at 300 kV from −60° to +60° tilt with 1° increment on a Tecnai F30 electron microscope equipped with an Eagle 4K charge-coupled-device (CCD) camera (FEI). As described in the legend to Fig. 1, montaged tomograms (1 by 3 frames) were used to acquire the hyphae at a magnification of ×12,000. The tilted images were aligned, and montaged tomograms collected from adjacent serial sections were generated by R-weighted back projection and joined in z. Here, specifically, the large-scale tomograms were intensively modeled and analyzed using IMOD software (13).
Fig 1.
From plastic-embedded A. gossypii hypha tips to 3D models. (A) Plastic-embedded samples were sectioned into 300-nm-thick slices. Hyphal tip regions cut longitudinally were selected. Twelve to fourteen 300-nm-thick slices composed a complete hyphal tip region. (B) Tilt series of each slice were acquired at the electron microscope at 300 kV from −60 to +60° with 1° of increment. To accommodate within the field of view 12-μm-long hyphal tip sections at a magnification of ×12,000, montages of 1 by 3 frames were acquired at each tilt angle. (C) Reconstructed tomograms for each of the 13 sections (indicated with red asterisks) were stacked together along the z axis. The red line indicates the location in z of the electronic slice shown in panel D. (D) Electronic slice of the center region of the hypha as shown in panel C. Such slices through the z axis were used to segment the different organelles. Segmented nuclei (purple), mitochondria (orange), and vacuoles (blue) are shown.
Analysis of distribution of small vesicles.
To obtain the distribution of vesicles along the cell axis, we used IMOD software (13) to extract the 3D coordinates of each small vesicle within the different subclasses as well as the coordinates of the cell axis. We projected the coordinates along the axis and binned the data to obtain a number of vesicles per segments. The data were normalized by dividing the percentage of vesicle for each segment by the cellular volume of the corresponding segment.
To obtain the distribution of vesicles from the cell cortex, we used the MTK program (IMOD suite) to extract the minimal distance from each vesicle to the plasma membrane. The data were binned, and the percentage of vesicles for each bin was divided by its corresponding cellular volume according to the distance from the cell periphery to the center.
Construction of gene deletions.
The complete open reading frames (ORFs) of the A. gossypii genes AgDNM1 and AgFZO1 were deleted by PCR-based gene targeting using the GEN3 selection marker (14). Deletion cassettes were amplified by PCR with the following primers each carrying 60 bases with homology to the targeted gene and 22 bases with homology to GEN3 (italic type): AgDNM1-S1 (5′-GATTGGTAAAGTTGGAACAATGGCGAGCTTGGAGGACCTGATTCCTACTGTGAACAAGCCGGGGATCCTCTAGAGTCGACC-3′), AgDNM1-S2 (5′-CAAGATTATCTACGACTACAGAAGTGGATACTAGAGTGTGAAAGGTTCTGAGGCATTGTCACCATGATTACGCCAAGCTTGC-3′), AgFZO1-S1 (5′-AGTGACTAACGGTTGGAGCAATGAGCGAAGATAAGCGAAACGGCAAGGACGCACCGTGGGCGGGGATCCTCTAGAGTCGAC-3′), and AgFZO1-S2 (5′-TCATCCGTATTAGTATATAGTTAACTATTTACATAACGTAGACGGGTCGCCAAAGAACCAACCATGATTACGCCAAGCTTGC-3′). Three independent homokaryotic deletions of AgDNM1 were isolated after transformation of the A. gossypii Δleu2Δthr4 strain and verified by PCR. Only two heterokaryotic deletions of AgFZO1 could be isolated and verified. Spores from these primary transformants did not yield viable colonies under selective conditions (200 mg/liter G418).
In vivo labeling of mitochondria and peroxisomes with GFP.
Mitochondria were labeled by transformation of the A. gossypii Δleu2 Δthr4 strain with the replicating plasmid pAgrMO-G1. This plasmid is a derivative of the Saccharomyces cerevisiae/Escherichia coli shuttle vector YCpLac111 (15). It carries the LEU2 gene and the autonomous replication sequence ARS1 from S. cerevisiae both of which are functional in A. gossypii. A cassette expressing a fusion of green fluorescent protein GFP(S65T) to the N terminus of S. cerevisiae Cox4 under the control of the S. cerevisiae HIS3 promoter was cloned into the multiple cloning site of YCpLac111. This heterologous promoter is also active in A. gossypii (16). We tested the Cox4-GFP fusion by costaining the transformed hyphae with MitoTracker (9). Both labels colocalized (data not shown).
Peroxisomes were labeled by transformation with the replicating plasmid pAGrPX-G1. This plasmid is also a derivative of YCpLac111. A DNA cassette expressing a fusion of GFP(S65T) to the S. cerevisiae peroxisome-targeting sequence PTS1 under the control of the S. cerevisiae HIS3 promoter was isolated from pEW161 (17) and cloned into the multiple cloning site of YCpLac111.
In vivo microscopy procedure.
Live-cell imaging of strains expressing GFP fused to the mitochondrial localization signal of cyclooxygenase 4 (COX4) (mitochondria) or the peroxisome-targeting sequence PST1 (peroxisomes) was performed using a system and applying protocols described previously (18). A small drop of selectively growing fungal cultures was mounted on a microscopy slide containing a thin layer of agarose with one-quarter AFM (10 g/liter yeast extract, 10 g/liter peptone, 20 g/liter glucose, 0.3 g/liter myo-inositol). In some experiments, 200 μM latrunculin B (L5288; Sigma-Aldrich) was added to the fungal culture prior to mounting a drop on the thin layer of agarose. As soon as a suitable hypha was identified, the time-lapse acquisition was started with two frames per minute. The Metamorph software program (Universal Imaging Corp.) was used for acquisition and image processing. Acquired z-stacks were merged using maximum-intensity projection. The individual channels were assigned with false colors, and the phase-contrast and fluorescence images were then overlaid with default color balance.
Results and Discussion
Electron tomography of organelles in A. gossypii.
To obtain a comprehensive view of organelles within a fungal hypha, we analyzed complete cellular tip volumes obtained from large-scale electron tomography (ET) of cryofixed, freeze-substituted, and plastic-embedded young mycelia of A. gossypii. The data were collected in parallel to our previous study on the microtubule cytoskeleton in this fungus (7). These large volumes were obtained by cutting hyphae into serial 300-nm-thick sections (Fig. 1A). Montages of 3 frames were used to acquire the sections of ∼12-μm-long hyphal segments, the maximal possible length within single tilt series at a magnification of ×12,000 (Fig. 1B). The tilt series of individual sections were acquired up to ±60° with 1° increments. Each section of selected hyphal volumes was reconstructed by ET. Tomograms of individual sections were aligned and stacked together in the z axis (Fig. 1C) to generate a final tomogram containing the complete ∼12-μm-long hyphal tip segment. Here, we tracked the membranes of the organelles of interest through the z axis of the tomogram within regularly spaced xy electronic slices (Fig. 1D). The organelles were identified according to the surrounding envelope (single or double membranes) and the presence of typical features such as nucleopores for nuclei or cristae for mitochondria, for instance. This allowed us to generate 3D models for thorough characterization of organelles in an A. gossypii hyphal tip region.
Diverse morphologies of nuclei.
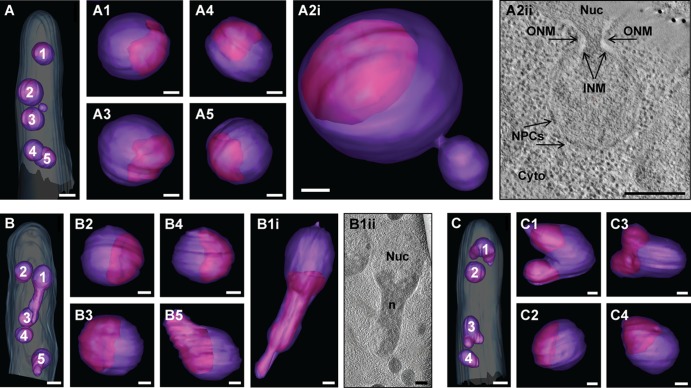
Three hyphal tip segments containing four or five nuclei were selected to document a snapshot of the nuclear shapes and their electron-dense regions representing the nucleolus (Fig. 2). Four nuclei of the hypha shown in Fig. 2A resemble the round nuclei known from many dynamic studies of histone-GFP-labeled nuclei (19, 20). The 3D image of nucleus 2 of this hypha surprisingly reveals a round micronucleus-like bud confirmed by the continuity of the nucleoplasm and the presence of nuclear pore complexes embedded in its envelope (Fig. 2A2i and A2ii). This structure may indicate a mechanism for pinching off nonessential portions of the nucleus for adjusting nuclear volumes distinct from the one described for budding yeast (21). Two of the five nuclei in hypha in Fig. 2B (panels B1i and B1ii and B5) and three of the four nuclei in hypha in Fig. 2C (panels C1, C3, and C4) show irregularly shaped protrusions. Noticeably, these protrusions appear to contain substantial parts of the nucleolus resulting in the delimitation of a more spherical half of the nucleus (Fig. 2B1i, B1ii, B5, and C4), even when two protrusions are emanating from it (Fig. 2C1 and C3). The enlarged nucleoli in these nuclei are probably important to support the high translation activities in expanding young A. gossypii mycelia as concluded from recent proteome studies (Lars Molzahn and Alexander Schmidt, personal communication). Interestingly, our previous study on the microtubule cytoskeleton (7) identified a mitotic spindle spanning the spherical part of the elongated nucleus in Fig. 2B (panels B1i and B1ii) perpendicular to the protrusion axis. The volume of the 14 modeled nuclei ranges from 0.96 to 2.56 μm3 with an average of 1.71 ± 0.56 μm3. The average volume of the eight spherical nuclei is 1.41 ± 0.27 μm3 which probably constitutes the mean minimal nuclear volume in hyphae growing in full medium (AFM). It should be noted that irregularly shaped nuclei have been previously observed in budding yeast in mutants with unregulated membrane proliferation (22). Taken together, these data suggest that irregularly shaped nuclei are the rule in growing A. gossypii hyphae and that enlarged nuclear volumes can probably be adjusted by a pinching-off pathway. The hypha in Fig. 2B containing three spherical nuclei and two irregularly shaped nuclei was selected for the high-resolution 3D modeling of membrane-limited organelles.
Fig 2.
Nuclei are of irregular shapes with protrusions containing the nucleolus. (A) Electron tomographic model view of the nuclei in the hypha (the plasma membrane [light blue] and nuclear envelope [purple] are indicated). Bar, 1 μm. (A1 to A5) Close-up views of the different nuclei with the nucleolus (the nuclear envelope [purple] and nucleolus [pink] are indicated). Bars, 300 nm. (A2ii) Electron tomographic slice of a micronucleus-like bud (the outer nuclear membrane [ONM], inner nuclear membrane [INM], nuclear pore complexes [NPCs], nucleus [Nuc], and cytoplasm [Cyto] are indicated). Bar, 300 nm. (B) Electron tomographic model view of the nuclei in the hypha. Bar, 1 μm. (B1 to B5) Close-up views of the different nuclei with the nucleolus. Bars, 300 nm. (B1ii) Electron tomographic slice of the nucleus labeled 1 in panel B showing the protrusion filled by the nucleolus (the nucleus [Nuc] and nucleolus [n] are indicated). Bar, 300 nm. (C) Electron tomographic model view of the nuclei in the hypha. Bar, 1 μm. (C1 to C4) Close-up views of the different nuclei with the nucleolus. Bars, 300 nm.
Abundance and morphology of mitochondria.
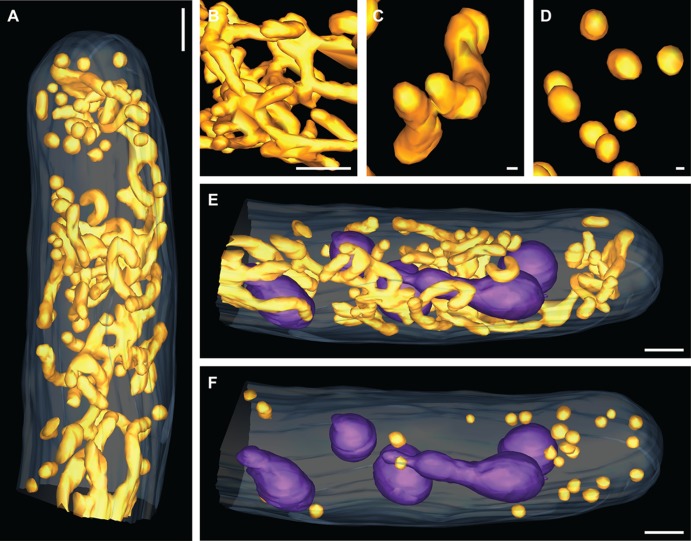
Mitochondria are essential organelles responsible in all eukaryotes for the production of ATP and key metabolites. Their morphology and abundance have been extensively studied in S. cerevisiae cells where they form interconnected tubules (23). Mitochondria occupy only a few percent of the cytoplasmic space in S. cerevisiae cells grown aerobically on standard glucose-containing YPD medium. When A. gossypii hyphae grow under the same conditions, mitochondria are very prominent organelles forming a dense network of long and highly interconnected tubules plus some individual tubular and spherical mitochondria (Fig. 3A to D). In this snapshot, the nuclei are clearly surrounded by the mitochondrial tubular network (Fig. 3E). The morphology and the membrane potential of mitochondria in A. gossypii have been shown to be independent of the nuclear cycle state in their vicinity (11). Interestingly, the tubular network is less present at the hyphal tip. In fact, a clear bias in distribution is seen for the single spherical mitochondria which are much more prominent in the hyphal tip (Fig. 3F). This may be due to the fact that a tubular network of energy-generating mitochondria in the growth zone of A. gossypii hyphae would very likely interfere with the tip-directed high traffic of secretory vesicles (16).
Fig 3.
Highly branched mitochondrial network with a polarized spherical fraction. (A) Electron tomographic model view of mitochondria subcellular organization within a hyphal tip region (the plasma membrane [light blue] and mitochondrial network [orange] are indicated). Bar, 1 μm. (B) Close-up view of branched mitochondria. Bar, 300 nm. (C) Close-up view of tubular mitochondria. Bar, 30 nm. (D) Close-up view of spherical mitochondria. Bar, 30 nm. (E) Electron tomographic model view of branched and tubular mitochondrial organization around nuclei within a hyphal tip region (the plasma membrane [light blue], nuclei [purple], and mitochondrial network [orange] are indicated). Bar, 1 μm. (F) Electron tomographic model view of spherical mitochondrial organization within a hyphal tip region (the plasma membrane [light blue], nuclei [purple], and mitochondrial network [orange] are indicated). Bar, 1 μm.
In vivo imaging of the mitochondrial network.
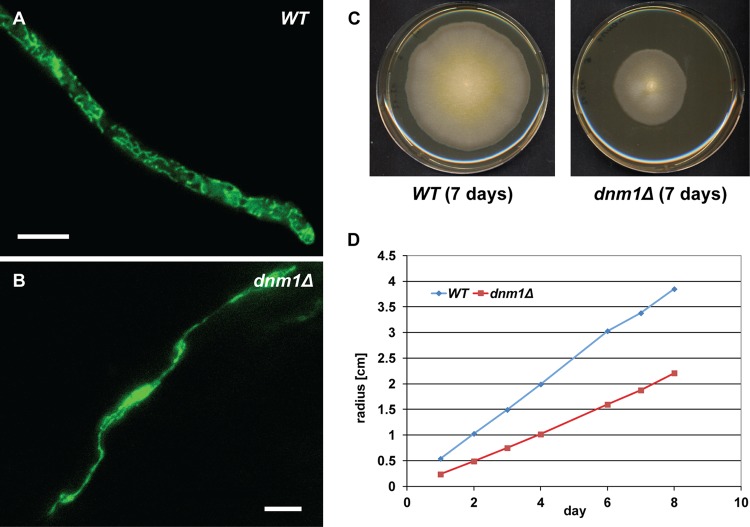
Hyphae expressing a fusion of GFP to the N-terminal part of the mitochondrial AgCox4 protein were imaged every 30 s. One example is documented in Movie S1 in the supplemental material. A dense tubular network occupies a major part of the cytoplasmic space (Fig. 4A). Areas with less-dense fluorescence very likely mark the positions of nuclei. In Movie S1 in the supplemental material, an overall movement in the direction of the growing hyphal tip is evident. Importantly, the appearance of the tubular network changes from one frame to the next, indicating a high dynamicity in time and space, confirming previous in vivo imaging studies (11). This may be caused in part by constant remodeling of the network using fission and fusion reactions as extensively studied in S. cerevisiae (23) and in addition by the back and forth movements of nuclei in A. gossypii hyphae (3, 19). Movie S1 also indicates that the tip region contains fewer mitochondria, confirming the tomography data (Fig. 3E and F).
Fig 4.
The mitochondrial network in dnm1Δ hyphae consists of an elongated and rarely branched structure. (A) Fluorescent image of the mitochondrial network using a fusion of GFP to the mitochondrial localization signal of AgCox4 in wild-type (WT) hypha. (B) Fluorescent image of the mitochondrial network using a fusion of GFP to the mitochondrial localization signal of AgCox4 in dnm1Δ hypha. Bars in panels A and B, 10 μm. (C) WT and dnm1Δ strains were grown on full medium (AFM) plates for 7 days. Representative images are presented. (D) Radial growth speed of WT and dnm1Δ mycelial colonies (centimeters/day) during 8 days on full medium (AFM) agar.
The dynamics of mitochondrial morphology depends on fusion and fission mechanisms which are controlled in S. cerevisiae by the Fzo1 and Dnm1dynamins, respectively (23). Inactivation of mitochondrial fusion is not lethal in S. cerevisiae but is lethal in A. gossypii because spores lacking the AgFZO1 gene stop growing after germination (data not shown). A heterokaryon mutant causes severely impaired growth as previously documented (11). As in S. cerevisiae, inactivation of mitochondrial fission is also not lethal in A. gossypii but significantly affects the morphology of the tubular network. Hyphae lacking the dynamin gene AgDNM1 form one long and only occasionally branched mitochondrial structure (Fig. 4B). The substantially reduced mitochondrial surface in this mutant most likely causes a marked decrease in ATP production which explains the observed much slower radial growth of the mycelium (Fig. 4C and D).
Organelles of the degradation pathways.
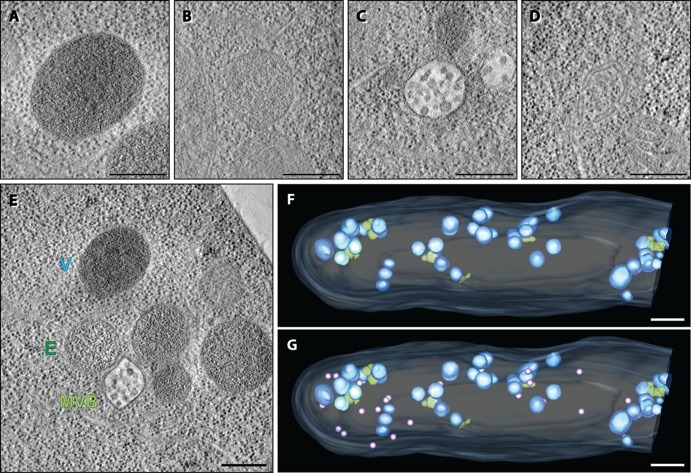
Another prominent group of organelles forms clusters with three types of material enclosed within a single membrane and characterized by different granularity and electron density (Fig. 5A to C). Late endosomal multivesicular bodies (MVBs) can be identified easily, because they are electron translucent and contain small vesicles of 38.86 ± 4.14 nm in diameter (n = 457; Fig. 5C). MVBs have been extensively studied in S. cerevisiae where they arise by invagination of the endosomal membrane and then associate and fuse with vacuoles (24). Interestingly, the mean diameter of vesicles within S. cerevisiae MVBs is only 24 nm compared to 39 nm in A. gossypii which may indicate differences in the timing of membrane scission potentially executed by the ESCRT-III (endosomal sorting complexes required for transport III) complex (25). The rather coarse-grained electron-translucent organelles and the fine-grained electron-dense organelles associated with MVBs are very likely endosomes and vacuoles, respectively (Fig. 5E). Vacuoles, endosomes, and MVBs are not evenly distributed like the mitochondrial network but mainly exist as aggregates of up to 14 organelles in which the electron-dense vacuoles predominate (Fig. 5F). The close proximity of these organelles supports their functional assignments. One large aggregate formed close to the hyphal tip most likely because this is a region with demonstrated increased endocytosis in filamentous fungi (16, 26).
Fig 5.
Clusters of endosomes, MVBs, and vacuoles. (A) Electron tomographic slice of a presumptive single-membrane vacuole. (B) Electron tomographic slice of a presumptive single-membrane endosome. (C) Electron tomographic slice of an MVB delimited by a single membrane and containing characteristic vesicles. (D) Electron tomographic slice of a presumptive autophagosome precursor characterized by curved double-membrane structures. (E) Example of an endosome-vacuole-MVB cluster. Bars in panels A to E, 300 nm. (F) Electron tomographic model view of the subcellular localization of presumptive endosomes, presumptive vacuoles, and MVBs (the plasma membrane [light blue], presumptive vacuoles [dark blue], presumptive endosomes [turquoise], and MVBs [green] are indicated). (G) Electron tomographic model view of the subcellular localization of presumptive vacuoles, presumptive endosomes, MVBs, and presumptive autophagosome precursors (violet). Bars in panels F and G, 1 μm.
We also searched for the presence of autophagosomes, double-membrane-limited organelles used for recycling of cellular components, including ribosomes and organelles through the vacuolar system (27, 28). This process is essential for survival during starvation conditions and also during development, e.g., spore formation in S. cerevisiae. Since the A. gossypii hyphae were growing in full medium (AFM), we did not expect to find autophagosomes. Nevertheless, double membranes partially engulfing cytoplasmic material, including ribosomes, were observed at several locations and may represent autophagosome precursors (Fig. 5D). These presumptive precursors of autophagosomes are spatially separated from the vacuole clusters but seem nonetheless to localize at their periphery, especially at the hyphal tip (violet spheres [Fig. 5G]). The presence of more than one curved double membrane may argue against the presumptive assignment of these organelles as autophagosome precursors, and we cannot exclude the possibility that these organelles may represent Golgi structures.
Vesicles in the 100- to 200-nm size range.
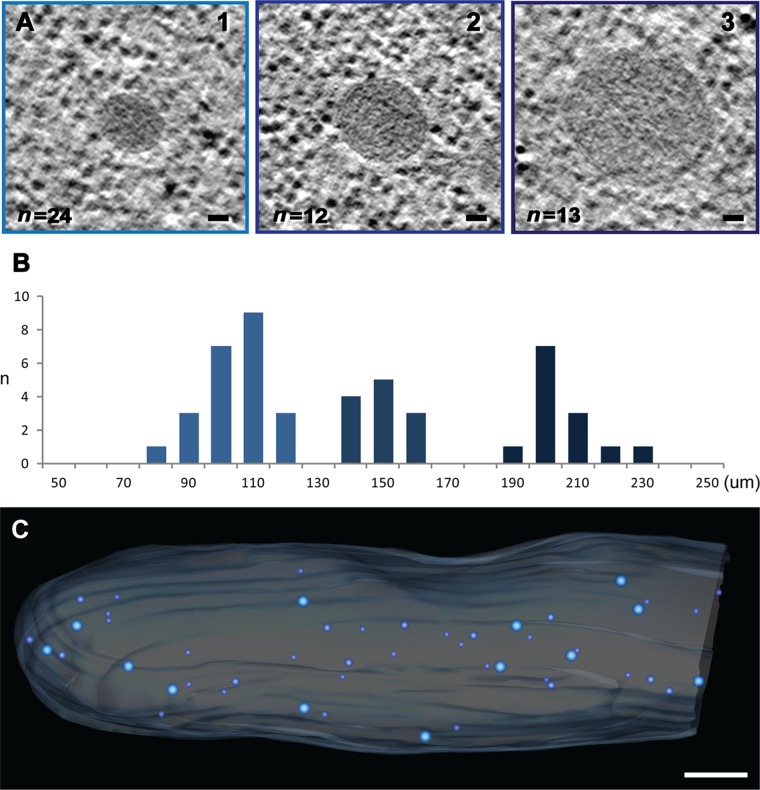
Vesicle-like bodies with similar electron density were observed with diameters ranging from 100 nm to 200 nm (Fig. 6A). The size distribution and a statistical analysis actually revealed three size classes (Fig. 6B) that do not show any relevant polarization or clustering (Fig. 6C). The smaller vesicles, with an average diameter of 100.31 ± 9.1 nm, could resemble the vesicles seen by classical electron microscopy analysis in the tips of fast-growing A. gossypii hyphae (16), but the different distribution of these 100-nm vesicles argue against a functional relation. The 100-nm vesicles seen in the cytoplasm of young hyphae plus the other vesicles with an average diameter of 145.89 ± 8.06 and 201.55 ± 9.85 nm have a higher electron density than the surrounding cytoplasm and could represent peroxisomes.
Fig 6.
Three size classes of electron-dense vesicles. (A) Electron tomographic slices representative of the three distinct size classes of vesicles. The three types present a similar morphology with a single membrane and electron-dense content. Bars, 30 nm. (B) Size distribution of the vesicles (in micrometers). (C) Electron tomographic model view of the subcellular localization of the three size classes (the plasma membrane [light blue] and large to small vesicles [dark blue to light blue] are indicated). Bar, 1 μm.
Peroxisomes do not have a characteristic morphology to allow their unambiguous identification without direct labeling, e.g., by GFP fused to a peroxisome-targeting sequence or by immunostaining of glyoxylate cycle enzymes, isocitrate lyase Icl1 or malate synthase Mls1 (17, 29–31). We tried to support our assumption that the 100- to 200-nm vesicles represent peroxisomes by analyzing the distribution, density, and approximate size of peroxisomes in hyphae expressing GFP tagged with the peroxisome-targeting sequence PTS1 (see Movie S2 in the supplemental material). In this movie, peroxisomes that move in the direction of the growing tip can be seen. Compared to the presumptive peroxisomes observed by ET, the distribution and sizes of peroxisomes are similar within the hyphal tip region of this movie. Interestingly, the density of peroxisomes increases further distant from the tip, a region which was not included in our 3D modeling. It is conceivable that A. gossypii forms peroxisomes when growing in the presence of glucose because S. cerevisiae cells grown under the same conditions lack an active glyoxylate cycle but still contain peroxisomes even though at a reduced density (32). Since the A. gossypii genome carries syntenic homologues of all peroxisome biogenesis (PEX) genes characterized in S. cerevisiae including those which encode the regulators for peroxisome number, size, and distribution (33), it is not unexpected that hyphae also contain peroxisomes. Finally, we did not observe any other membrane-limited vesicles or organelles in the size range of peroxisomes, which also supports our assumption that the 100- to 200-nm vesicles represent peroxisomes.
Distribution and polarization of small vesicles.
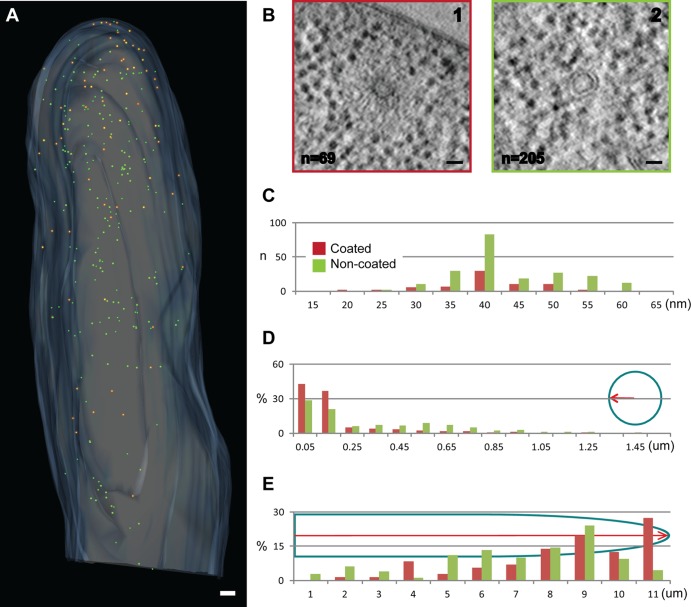
We found within A. gossypii hypha two classes of small vesicles (Fig. 7A). The first class of vesicles carries a coat, which was visible as filamentous, ribosome-free material around the vesicle (Fig. 7B1); these vesicles were initially described as “filasomes” (34). The other class lacks a coat (Fig. 7B2). These vesicles whether coated or uncoated show a similar size distribution (Fig. 7C). We measured a mean diameter of 38.32 ± 7.4 nm for vesicles surrounded by a coat (n = 69; with the coat 84.56 ± 15.18 nm) and a mean diameter of 40.87 ± 7.92 nm for the noncoated vesicles (n = 205). The coated vesicles most likely represent endocytic vesicles carrying an actin coat (35). Growing hyphae form an endocytic ring close to the tip (16, 26), and the coated vesicles clearly show a preferential distribution toward the hyphal cortex in the tip (Fig. 7D and E). The presence of some coated vesicles centrally located in the hypha suggests fast inward movements of actin-coated vesicles prior to disassembly of the coat. Most of the noncoated vesicles most likely represent secretory vesicles transported to the tip, which is confirmed by their accumulation in the tip region (Fig. 7E). It is possible that the uncoated vesicles may consist of subpopulations. We observed some differences in intraluminal electron density, but we were not sufficiently confident to assign subpopulations on the basis of these differences.
Fig 7.
Distribution of coated and uncoated vesicles. (A) Electron tomographic model view of subcellular localization of small vesicles (the plasma membrane [light blue], coated vesicles [orange], and noncoated vesicles [green] are indicated). Bar, 300 nm. (B) Electron tomographic slices showing a coated vesicle (panel 1) and a noncoated vesicle (panel 2). Bars, 30 nm. (C) Size distribution of coated and noncoated vesicles. (D) Spatial distribution of coated and noncoated vesicles with respect to the hyphal cortex.(E) Spatial distribution of coated and noncoated vesicles along the tip-directed growth axis. Size is shown in micrometers in panels D and E.
Much stronger accumulations of vesicles in hyphal tips have previously been documented for example in A. nidulans hyphae by ET of 200-nm-thick sections (36) or in A. gossypii hyphae by transmission electron microscopy (TEM) of 60-nm thin sections (16). These studies focused on fast-growing mature hyphae with a high demand for secretory vesicle transport toward the growing tip. In our study, young hyphae with slow tip extension speeds of 0.1 to 0.2 μm/min were analyzed, whereas the previous A. gossypii study, for example, investigated the vesicle accumulation in hyphae growing about 2 μm/min.
Conclusion.
The 3D modeling of organelles revealed a realistic view of the actual volume of these organelles in a hypha. The volumes of nuclei in the three hyphae analyzed add up to 8.26 μm3, which occupies 17.7% of the cytoplasm. In one representative hypha, all organelles were tracked (summarized in Movie S3 in the supplemental material) except the endoplasmic reticulum (ER), which could only be partially identified close to nuclei, in the cell center, and in the subcortex area. In total, 8.8% of the cytoplasm is occupied by mitochondria which is less than expected from images obtained by fluorescence microscopy of GFP-labeled mitochondria (11; our data). The tubular network of mitochondria partially surrounds nuclei but does not fully engulf nuclei, and thus, mitochondria very likely only marginally interfere with active forward or backward movements of nuclei in the direction of or against the cytoplasmic stream. The frequent fission and fusion events within the tubular network yield a flexible energy-providing matrix for nuclei, which has adjusted to the needs in multinucleated hyphae. Other organelles like MVBs, endosomes, and vacuoles add up to only 2.5% of the hyphal space. In the young hyphae analyzed, these organelles have diameters of less than 700 nm, which is about one fifth of the hyphal diameter, and thus very unlikely interfere with nuclear movements. Older hyphae develop larger vacuoles up to the size of nuclei (8). In such older hyphal compartments, movements of nuclei have not been studied so far but are very likely impeded by such large vacuoles. To fully describe and understand the movements of nuclei in hyphae, future studies also need to take into account the ER tightly associated with and surrounding the nuclei which increases the actual volume of nuclei moving in the hyphal space.
Supplementary Material
ACKNOWLEDGMENTS
We thank Anne Spang, Christian Ungermann, Ben Distel, and Robby Roberson for critical comments and the members of Claude Antony's research group and the EMBL Electron Microscopy Core Facility for technical support and helpful discussions. We especially thank Charlotta Funaya, Sabine Pruggnaller, and Willis Pinaud for their essential help in various steps of the process from sample preparation to tomogram analysis. We are grateful to Sandrine Grava for providing A. gossypii spores and protocols.
Part of the work was supported by the Swiss National Science Foundation (grant 3100A0-112688 to P.P.).
Footnotes
Published ahead of print 14 June 2013
Supplemental material for this article may be found at http://dx.doi.org/10.1128/EC.00106-13.
REFERENCES
- 1. Ramos-García SL, Roberson RW, Freitag M, Bartnicki-García S, Mouriño-Pérez RR. 2009. Cytoplasmic bulk flow propels nuclei in mature hyphae of Neurospora crassa. Eukaryot. Cell 8:1880–1890 [DOI] [PMC free article] [PubMed] [Google Scholar]
- 2. Xiang X, Fischer R. 2004. Nuclear migration and positioning in filamentous fungi. Fungal Genet. Biol. 41:411–419 [DOI] [PubMed] [Google Scholar]
- 3. Lang C, Grava S, Van den Hoorn T, Trimble R, Philippsen P, Jaspersen SL. 2010. Mobility, microtubule nucleation and structure of microtubule-organizing centers in multinucleated hyphae of Ashbya gossypii. Mol. Biol. Cell 21:18–28 [DOI] [PMC free article] [PubMed] [Google Scholar]
- 4. Lang C, Grava S, Finlayson M, Trimble R, Philippsen P, Jaspersen SL. 2010. Structural mutants of the spindle pole body cause distinct alteration of cytoplasmic microtubules and nuclear dynamics in multinucleated hyphae. Mol. Biol. Cell 21:753–766 [DOI] [PMC free article] [PubMed] [Google Scholar]
- 5. Grava S, Philippsen P. 2010. Dynamics of multiple nuclei in Ashbya gossypii hyphae depend on the control of cytoplasmic microtubules length by Bik1, Kip2, Kip3, and not on a capture/shrinkage mechanism. Mol. Biol. Cell 21:3680–3692 [DOI] [PMC free article] [PubMed] [Google Scholar]
- 6. Grava S, Keller M, Voegeli S, Seger S, Lang C, Philippsen P. 2011. Clustering of nuclei in multinucleated hyphae is prevented by dynein-driven bidirectional nuclear movements and microtubule growth control in Ashbya gossypii. Eukaryot. Cell 10:902–915 [DOI] [PMC free article] [PubMed] [Google Scholar]
- 7. Gibeaux R, Lang C, Politi AZ, Jaspersen SL, Philippsen P, Antony C. 2012. Electron tomography of the microtubule cytoskeleton in multinucleated hyphae of Ashbya gossypii. J. Cell Sci. 125:5830–5839 [DOI] [PubMed] [Google Scholar]
- 8. Walther A, Wendland J. 2004. Apical localization of actin patches and vacuolar dynamics in Ashbya gossypii depend on the WASP homolog Wal1p. J. Cell Sci. 117:4947–4958 [DOI] [PubMed] [Google Scholar]
- 9. Hickey PC, Read ND. 2009. Imaging living cells of Aspergillus in vitro. Med. Mycol. 47(Suppl 1):S110–S119 [DOI] [PubMed] [Google Scholar]
- 10. Bowman BJ, Draskovic M, Freitag M, Bowman EJ. 2009. Structure and distribution of organelles and cellular location of calcium transporters in Neurospora crassa. Eukaryot. Cell 8:1845–1855 [DOI] [PMC free article] [PubMed] [Google Scholar]
- 11. Gerstenberger JP, Occhipinti P, Gladfelter AS. 2012. Heterogeneity in mitochondrial morphology and membrane potential is independent of the nuclear division cycle in multinucleate fungal cells. Eukaryot. Cell 11:353–367 [DOI] [PMC free article] [PubMed] [Google Scholar]
- 12. Höög JL, Schwartz C, Noon AT, O'Toole ET, Mastronarde DN, McIntosh JR, Antony C. 2007. Organization of interphase microtubules in fission yeast analyzed by electron tomography. Dev. Cell 12:349–361 [DOI] [PubMed] [Google Scholar]
- 13. Kremer JR, Mastronarde DN, McIntosh JR. 1996. Computer visualization of three-dimensional image data using IMOD. J. Struct. Biol. 116:71–76 [DOI] [PubMed] [Google Scholar]
- 14. Wendland J, Ayad-Durieux Y, Knechtle P, Rebischung C, Philippsen P. 2000. PCR-based gene targeting in the filamentous fungus Ashbya gossypii. Gene 242:381–391 [DOI] [PubMed] [Google Scholar]
- 15. Gietz RD, Sugino A. 1988. New yeast-Escherichia coli shuttle vectors constructed with in vitro mutagenized yeast genes lacking six-base pair restriction sites. Gene 74:527–534 [DOI] [PubMed] [Google Scholar]
- 16. Köhli M, Galati V, Boudier K, Roberson RW, Philippsen P. 2008. Growth-speed-correlated localization of exocyst and polarisome components in growth zones of Ashbya gossypii hyphal tips. J. Cell Sci. 121:3878–3889 [DOI] [PubMed] [Google Scholar]
- 17. Hoepfner D, Van den Berg M, Philippsen P, Tabak HF, Hettema EH. 2001. A role for Vps1p, actin, and the Myo2p motor in peroxisome abundance and inheritance in Saccharomyces cerevisiae. J. Cell Biol. 155:979–990 [DOI] [PMC free article] [PubMed] [Google Scholar]
- 18. Hoepfner D, Brachat A, Philippsen P. 2000. Time-lapse video microscopy analysis reveals astral microtubule detachment in the yeast spindle pole mutant cnm67. Mol. Biol. Cell 11:1197–1211 [DOI] [PMC free article] [PubMed] [Google Scholar]
- 19. Alberti-Segui C, Dietrich FS, Altmann-Jöhl R, Hoepfner D, Philippsen P. 2001. Cytoplasmic dynein is required to oppose the force that moves nuclei towards the hyphal tip in the filamentous ascomycete Ashbya gossypii. J. Cell Sci. 114:975–986 [DOI] [PubMed] [Google Scholar]
- 20. Gladfelter AS, Hungerbuehler AK, Philippsen P. 2006. Asynchronous nuclear division cycles in multinucleated cells. J. Cell Biol. 172:347–362 [DOI] [PMC free article] [PubMed] [Google Scholar]
- 21. Krick R, Muehe Y, Prick T, Bremer S, Schlotterhose P, Eskelinen E-L, Millen J, Goldfarb DS, Thumm M. 2008. Piecemeal microautophagy of the nucleus requires the core macroautophagy genes. Mol. Biol. Cell 19:4492–4505 [DOI] [PMC free article] [PubMed] [Google Scholar]
- 22. Webster MT, McCaffery JM, Cohen-Fix O. 2010. Vesicle trafficking maintains nuclear shape in Saccharomyces cerevisiae during membrane proliferation. J. Cell Biol. 191:1079–1088 [DOI] [PMC free article] [PubMed] [Google Scholar]
- 23. Okamoto K, Shaw JM. 2005. Mitochondrial morphology and dynamics in yeast and multicellular eukaryotes. Annu. Rev. Genet. 39:503–536 [DOI] [PubMed] [Google Scholar]
- 24. Saksena S, Sun J, Chu T, Emr SD. 2007. ESCRTing proteins in the endocytic pathway. Trends Biochem. Sci. 32:561–573 [DOI] [PubMed] [Google Scholar]
- 25. Nickerson DP, West M, Henry R, Odorizzi G. 2010. Regulators of Vps4 ATPase activity at endosomes differentially influence the size and rate of formation of intralumenal vesicles. Mol. Biol. Cell 21:1023–1032 [DOI] [PMC free article] [PubMed] [Google Scholar]
- 26. Taheri-Talesh N, Horio T, Araujo-Bazán L, Dou X, Espeso EA, Peñalva MA, Osmani SA, Oakley BR. 2008. The tip growth apparatus of Aspergillus nidulans. Mol. Biol. Cell 19:1439–1449 [DOI] [PMC free article] [PubMed] [Google Scholar]
- 27. He C, Klionsky DJ. 2009. Regulation mechanisms and signaling pathways of autophagy. Annu. Rev. Genet. 43:67–93 [DOI] [PMC free article] [PubMed] [Google Scholar]
- 28. Nakatogawa H, Suzuki K, Kamada Y, Ohsumi Y. 2009. Dynamics and diversity in autophagy mechanisms: lessons from yeast. Nat. Rev. Mol. Cell Biol. 10:458–467 [DOI] [PubMed] [Google Scholar]
- 29. Erdmann R, Veenhuis M, Kunau WH. 1997. Peroxisomes: organelles at the crossroads. Trends Cell Biol. 7:400–407 [DOI] [PubMed] [Google Scholar]
- 30. Maeting I, Schmidt G, Sahm H, Revuelta JL, Stierhof Y-D, Stahmann K-P. 1999. Isocitrate lyase of Ashbya gossypii–transcriptional regulation and peroxisomal localization. FEBS Lett. 444:15–21 [DOI] [PubMed] [Google Scholar]
- 31. Kunze M, Kragler F, Binder M, Hartig A, Gurvitz A. 2002. Targeting of malate synthase 1 to the peroxisomes of Saccharomyces cerevisiae cells depends on growth on oleic acid medium. Eur. J. Biochem. 269:915–922 [DOI] [PubMed] [Google Scholar]
- 32. Chang CC, South S, Warren D, Jones J, Moser AB, Moser HW, Gould SJ. 1999. Metabolic control of peroxisome abundance. J. Cell Sci. 112(Part 1):1579–1590 [DOI] [PubMed] [Google Scholar]
- 33. Dietrich FS, Voegeli S, Brachat S, Lerch A, Gates K, Steiner S, Mohr C, Pöhlmann R, Luedi P, Choi S, Wing RA, Flavier A, Gaffney TD, Philippsen P. 2004. The Ashbya gossypii genome as a tool for mapping the ancient Saccharomyces cerevisiae genome. Science 304:304–307 [DOI] [PubMed] [Google Scholar]
- 34. Howard RJ. 1981. Ultrastructural analysis of hyphal tip cell growth in fungi: Spitzenkörper, cytoskeleton and endomembranes after freeze-substitution. J. Cell Sci. 48:89–103 [DOI] [PubMed] [Google Scholar]
- 35. Kaksonen M, Sun Y, Drubin DG. 2003. A pathway for association of receptors, adaptors, and actin during endocytic internalization. Cell 115:475–487 [DOI] [PubMed] [Google Scholar]
- 36. Hohmann-Marriott MF, Uchida M, Van de Meene AML, Garret M, Hjelm BE, Kokoori S, Roberson RW. 2006. Application of electron tomography to fungal ultrastructure studies. New Phytol. 172:208–220 [DOI] [PubMed] [Google Scholar]
Associated Data
This section collects any data citations, data availability statements, or supplementary materials included in this article.


