

Abstract
3′ untranslated regions (UTRs) are known to play an important role in posttranscriptional regulation of gene expression. Here we map the 3′ UTRs of Kaposi's sarcoma-associated herpesvirus (KSHV) using next-generation RNA sequencing, 3′ rapid amplification of cDNA ends (RACE), and tiled microarray analyses. Chimeric reporters containing the KSHV 3′ UTRs show a general trend toward reduced gene expression under conditions of latent infection. Those 3′ UTRs with a higher GC content are more likely to be associated with reduced gene expression. KSHV transcripts display an extensive use of shared polyadenylation sites allowing for partially overlapping 3′ UTRs and regulatory activities. In addition, a subset of KSHV 3′ UTRs is sufficient to convey increased gene expression under conditions of lytic infection. These results suggest a role for viral 3′ UTRs in contributing to differential gene expression during latent versus lytic infection.
INTRODUCTION
The 3′ untranslated regions (UTRs), defined as the portion of an mRNA transcript extending from the stop codon to the polyadenylated tail, are known to play an important role in posttranscriptional regulation of gene expression (1). 3′ UTRs can alter transcript stability, subcellular localization, and translation efficiency (2–5). Recent studies have demonstrated global alterations in host transcript 3′ UTR compositions under different biological conditions related to cell growth and transformation (6, 7). These findings imply a possible role for 3′ UTRs expressed by tumor viruses during infection.
Although well studied in some RNA viruses (8), the role of viral 3′ UTRs remains understudied in DNA viruses. KSHV is a large, double-stranded DNA virus associated with various hyperproliferative disorders, including Kaposi's sarcoma, primary effusion lymphoma, and multicentric Castleman's disease (9, 10). Like all herpesviruses, KSHV is characterized by a long-term latent infection, during which the virus effectively evades the host immune system. KSHV harbors approximately 85 well-established protein-encoding genes, at least 5 of which are expressed during latent infection (9, 11). A temporal cascade of gene expression occurs during lytic infection that culminates with the production and dissemination of virions (12–14). To date, only 38 of the ∼85 KSHV genes have a published, experimentally determined 3′ UTR. To our knowledge, no studies have yet examined differences in composition or changes in regulatory activity of DNA virus 3′ UTRs in latent (persistent) infection versus lytic (productive) infection.
Here, using high-throughput RNA deep sequencing (RNAseq) analysis, we map a majority of the predominant 3′ UTRs from most of the known mRNA transcripts (n = 84). We confirmed the accuracy of 66 of these 3′ UTRs using traditional rapid amplification of cDNA ends (RACE) analysis and of 5 additional 3′ UTRs using tiled microarray analysis. Furthermore, using chimeric reporter assays, we tested their functionality in different cellular contexts. This work unveils a likely role for some KSHV 3′ UTRs in the differential control of viral gene expression in latent versus lytic infection.
MATERIALS AND METHODS
Cell culture, transfection, and RNA isolation.
TREx-RTA BCBL-1 cells were maintained in RPMI 1604 medium supplemented with 20% fetal bovine serum (FBS) and hygromycin B (50 μg/ml) and induced into KSHV lytic replication with tetradecanoylphorbol-13-acetate (TPA) (20 ng/ml) and doxycycline (2 μg/ml) (15, 16). Cells were treated with the MNK1 inhibitor CGP57380 (20 μM) (15). Chemical treatments were confirmed by immunoblot analysis using antibodies that recognize the KSHV lytic gene replication transcriptional activator (RTA). BJAB cells were maintained in RPMI 1604 medium supplemented with 10% FBS. Human embryonic kidney (HEK 293) cells were maintained in Dulbecco's modified Eagle's medium (DMEM) supplemented with 10% FBS.
HEK 293 cells were transfected at 80% confluence by using Lipofectamine 2000 reagent. For cuvette electroporations, 7 × 10⁶ BJAB or TREx-RTA BCBL-1 cells were added to 24 μg of DNA and electroporated at 210 V and 950 μF. Cells were allowed to recover for 24 h before lytic induction by chemical treatment (3). For large-scale analysis using a 96-well electroporation plate (Bio-Rad), 1 × 10⁶ BJAB or TREx-RTA BCBL-1 cells were added to 10 μg of DNA and electroporated at 300 V and 350 μF. The cells were resuspended in 2 ml of culture medium. Electroporations were conducted by using the Gene Pulser MXcell electroporation system (Bio-Rad). Protein lysates for Western immunoblot analysis or luciferase analysis were harvested between 3 and 60 h after chemical treatment. Data presented are the averages and standard deviations of luciferase units determined from at least three replicates normalized to a cotransfected Renilla control and also normalized to a parental vector 3′ UTR.
Total RNA was harvested by using PIG-B solution (17) at 107 cells ml−1. Polyadenylated RNA was enriched by using the Oligotex mRNA miniprep kit (Qiagen).
Next-generation high-throughput RNA sequencing preparation and computational analysis.
Total RNA was harvested from TREx-RTA BCBL-1 cells at 0, 12, and 48 h after lytic induction. Poly(A)-enriched RNA was prepared by using a MicroPoly(A)Purist kit (Ambion) and subsequently treated with an exonuclease to remove rRNA before heat-induced fragmentation. Illumina RNA adaptors (3′ adaptor 5′-TGGAATTCTCGGGTGCCAAGG-3′ and 5′ adaptor 5′-GUUCAGAGUUCUACAGUCCGACGAUC-3′) were ligated to the fragments and used to prepare cDNA by using Superscript III reverse transcriptase. Samples were then analyzed by Illumina HiSeq 2000 RNAseq technology. Sequencing results were filtered for at least 10 adenine nucleotides before the 3′ adaptor sequence, and the non-poly(A) sequence was then mapped against the KSHV genome (GenBank accession number NC_009333), using the SHRiMP 2 software package. The last nucleotide before the poly(A) string was annotated the transcript cleavage site.
3′ RACE and 5′ RACE.
cDNA was synthesized by using Superscript III reverse transcriptase with 500 ng of poly(A) RNA and a gene-specific dT17 adaptor (GACTCGAGTCGACATCG) primer at 42°C to 50°C for 50 min (18). For 3′ RACE, after reverse transcription, PCR was used to amplify each 3′ UTR by using primers designed for the 3′ adaptor sequence (see Table S3 in the supplemental material) and a gene-specific primer within 50 bp upstream and 15 bp downstream of each annotated viral stop codon. For 5′ RACE, the RLM RACE kit (Ambion) was used according to the manufacturer's directions. Amplicons were cloned into the TOPO TA Cloning kit (Invitrogen), and plasmid DNA was harvested and sequenced from 10 different colonies. The primers used in this study were the K7-specific inner primer CCCTTTTATCTCCAGTGTTCCCAT and the K7-specific outer primer AAGCCAGGATGGGTATATTGCCAA.
KSHV DNA tiling array.
Latent and lytic cDNAs from BCBL-1 cells were analyzed on a custom high-resolution KSHV microarray as described previously (19). In brief, the KSHV DNA tiling array was designed with stepwise 60-bp windows from both strands of the KSHV genome (GenBank accession number NC_009333) and the terminal repeat unit (GenBank locus number KSU86666). The probes selected ranged from 45 to 60 bp, as necessary for an optimal melting temperature (Tm) of 80°C, and were adjusted to 60 bp by using a common linker (ATAACCGACGCCTAA). To map polyadenylation sites, we exploited the fact that the efficiency of an oligo(dT)-primed cDNA synthesis reaction decreases toward the 5′ end of an RNA molecule. On a tiled microarray, this leads to a characteristic hybridization signature that peaks near the polyadenylation cleavage site and features a sharp drop in the 3′ direction and a linearly decreasing signal intensity in the 5′ direction of transcription. cDNA synthesis and labeling were performed by using the Quick Amp two-color labeling kit (Agilent) according to the manufacturer's instructions. After hybridization and washing, arrays were scanned by using a GenePix Personal 4100A scanner (Axon Instruments). Primary analysis and data normalization were carried out by using GenePix Pro 6.0 software (Axon Instruments).
Vector construction and luciferase assay.
The luciferase reporters were cloned by using the LR Clonase II Gateway recombination system, including moving each UTR from the pENTR/d-TOPO vector into the pMSCV-gw-luc2cp-Puro vector (Invitrogen, Carlsbad, CA). RTA short hairpin RNA (shRNA) and control shRNA expression vectors were a kind gift from Ren Sun (UCLA). Cells were cotransfected with a pMSCV-luc2cp 3′ UTR reporter and a pcDNA3.1-Rluc vector at a 15:1 ratio. The cells were collected 36 h after transfection and analyzed by using the Dual-Glo luciferase assay system. Data presented are the averages and standard deviation of firefly luciferase activity normalized to Renilla luciferase activity. Statistical analysis using two-tailed Student's t test was used for correlation analysis.
Quantitative real-time PCR.
Total RNA was prepared as described above and treated with DNase I (20), and the mRNA was enriched by using mRNA purification columns (Qiagen). cDNA was synthesized by using Superscript III reverse transcriptase (Invitrogen) and a reverse primer that recognizes the PEST (proline, glutamic acid, serine, threonine) sequence located at the 3′ end of the coding region in both Renilla and firefly transcripts (TTAGACGTTGATCCTGGCGC). Quantitative real-time PCR (qRT-PCR) was performed by using TaqMan (ABI) primer-probe sets specific for the firefly and Renilla luciferase genes. Control reactions (no-template control [NTC] and reverse transcription negative [RT−]) were performed to monitor contamination of reagents and plasmid DNA. Quantitative PCR was performed on a Viia 7 real-time PCR machine (Applied Biosystems), using standard qRT-PCR run cycles.
RESULTS
Mapping of the KSHV 3′ UTRome.
To map the 3′ UTRs from KSHV transcripts (3′ UTRome), we harvested total RNA from TREx-RTA BCBL-1 cells undergoing latent and lytic infection. We then conducted RNAseq analysis on an Illumina HiSeq 2000 machine. Sequencing results were filtered for at least 10 nontemplated adenine nucleotides before the 3′ adaptor sequence and then sequence matched against the KSHV genome. The last nucleotide before the poly(A) string was annotated the transcript cleavage site. Using this strategy, we identified 82 peaks indicative of likely polyadenylation sites (Fig. 1; see also Table S1 in the supplemental material). In general, the majority of peaks that we identified also fell near a computationally predicted polyadenylation signal sequence (see Table S2 in the supplemental material).
Fig 1.

Map of the KSHV 3′ UTRs. KSHV transcript termination sites are shown in either the sense (upward peak) or antisense (downward peak) orientation annotated by next-generation RNAseq analysis. A linearized KSHV genomic map is presented, with each KSHV 3′ UTR (gray arrows) confirmed by 3′ RACE, KSHV DNA tiling microarray analysis, and/or bioinformatic prediction shown. Each of the 84 ORFs is displayed by its position and general timing of expression (green, latent; yellow, immediate early; orange, early; blue, late). Poly(A)-enriched RNA was prepared from latent or lytically induced (24 and 48 h) TREx-RTA BCBL-1 cells. Sequencing results are filtered for the last nucleotide after a string of 10 adenine nucleotides, indicating a transcription stop site. The y axis shows read density coverage plotted on a log scale; the x axis shows nucleotide position in the KSHV genome.
To validate these polyadenylation sites, we conducted 3′ RACE analysis (see Table S3 in the supplemental material) and identified 3′ UTRs for 66 of the KSHV transcripts (see Table S2 in the supplemental material). The vast majority (64/66) of these 3′ UTRs showed perfect agreement with our RNAseq data (Fig. 1). The remaining 18 3′ UTRs were not mapped by RACE analysis, likely due to either low transcript concentrations in the samples or the 3′ UTRs being too long for RACE analysis. Two of the 3′ UTRs (K1 and open reading frame [ORF] 30) mapped by 3′ RACE analysis identified alternative polyadenylation sites from the RNAseq analysis. A previous analysis of the K1 transcript identified two 3′ UTR variants formed from a bicistronic transcript with ORF 4. The first variant is ∼350 nucleotides, uses a noncanonical (ACUAAA) polyadenylation signal sequence downstream of ORF 4, and involves the removal of a 1,644-nucleotide intron (12). A possible unspliced transcript is also detectable with the bicistronic transcript (12). This variant was confirmed by our RNAseq analysis; however, our 3′ RACE analysis also identified a proximal 3′ UTR variant with a noncanonical (AUUAAA) polyadenylation signal sequence. Therefore, at least a minority of K1 transcripts may use the proximal polyadenylation site identified by 3′ RACE. The ORF 30 3′ UTR is predicted to use the same polyadenylation site as the ORF 31 to ORF 33 transcripts (see Table S2 in the supplemental material). However, 3′ RACE analysis identified a proximal polyadenylation site for ORF 30, which is also used by ORF 28 (KSHV genome position 51489 in the NCBI reference genome under accession number NC_009333.1). The majority (n = 64) of the 3′ UTRs showed consistent results between the two experimental mapping methods, indicating that these UTRs are likely the most abundant 3′ UTRs in infected BCBL-1 cells.
To validate the remaining 18 3′ UTRs identified by RNAseq analysis that were not identified in our RACE analysis, we used high-density custom DNA tiling microarray analysis conducted on RNA harvested from BCBL-1 PEL cells (see Table S4 in the supplemental material). Total RNA was reverse transcribed and hybridized to tiling microarrays that contain KSHV probes with approximately 60-nucleotide windows and 15 to 20 nucleotides of overlap between tiles. Areas where transcript density dropped and that were preceded by the canonical polyadenylation signal (AAUAAA) were considered high-probability candidate sites for the end of a viral 3′ UTR. This analysis showed good agreement with the 3′ RACE and RNAseq analyses (Fig. 1) in TREx-RTA BCBL-1 cells, arguing that transcript processing is largely preserved in different clonal derivatives of BCBL-1 cells. The tiled array analysis provided us with validation of 5 additional 3′ UTRs, bringing the total number of 3′ UTRs that were validated by two or more independent assays to 69. For the remaining 13 transcripts that were not identified by RNA sequencing, 3′ RACE, or tiled array analyses, we relied on computational prediction (see Table S2 in the supplemental material). We used a sequence-based prediction algorithm called polyA SVM (21) to predict likely polyadenylation signal sequences within 4,000 bp of a known KSHV stop sequence. For 10 of the remaining 13 3′ UTRs, we called the polyadenylation signal site with the highest E value score (see Table S2 in the supplemental material). For the three 3′ UTRs that did not return a poly(A) signal site prediction with the polyA SVM algorithm (ORF 7, ORF 8, and ORF 29), we relied on previous computational work (21) and the NCBI KSHV record (GenBank accession number NC_009333.1) to confirm our RNAseq analysis (see Table S2 in the supplemental material). Combined, our experimental mapping efforts identified a 3′ UTR for 71 transcripts with high confidence, and bioinformatics predicted 13 additional high-confidence 3′ UTRs, totaling 84 different KSHV genes included in our KSHV 3′ UTR map.
Analysis of the KSHV 3′ UTRs revealed 47 different high-confidence polyadenylation signals identified by RNAseq and independently supported by one or more other analyses (3′ RACE, tiled microarray, and/or bioinformatic prediction). Undoubtedly, this represents an underestimate, as RNAseq (Fig. 1) identified numerous other, likely polyadenylated transcription termination sites that were not validated by other wet-bench methods or predicted by bioinformatics. These high-confidence polyadenylation signals contribute to 22 clusters that have 2 or more transcripts sharing a polyadenylation signal sequence. Again, this number of clusters represents an underestimate, since it refers only to high-confidence polyadenylation signals identified in BCBL-1 derivative cells. Within a cluster, transcripts expressed upstream can contain entire downstream ORFs in their 3′ UTRs. Our data showed extensive shared usage of the same polyadenylation signal (Fig. 1), a phenomenon that was previously observed for KSHV and other viruses (22–26). In addition, several putative alternative polyadenylation sites were identified, including transcripts expressed from viral interferon regulatory factor 3 (v-IRF3), v-IRF2, ORF 40, K14, and the ORF 58 to ORF 61 cluster (Fig. 1). Consistent with human alternative polyadenylation (27), the distal KSHV polyadenylation sites are, in general, the stronger sequence (AAUAAA) and were detected more prevalently in our RACE analysis (Fig. 1 and data not shown). Compared to estimates that over 50% of human transcripts have variable usage of polyadenylation signal sequences (28, 29), KSHV polyadenylation seems to be more constant, with only ∼10% of the transcripts showing robustly used alternative sites for polyadenylation. Several KSHV 3′ UTRs use less common polyadenylation sequences to terminate transcription, such as AUUAAA (for example, K1, K3, ORF 16, and ORF 19) and ACUAAA (for example, ORF 4). Similar to human transcripts (30), ∼80 to 90% of KSHV mRNA transcripts utilize the canonical AAUAAA polyadenylation signal. The use of weaker polyadenylation signals is thought to provide another level of transcriptional regulation during gene expression (28, 31).
Previous studies on the KSHV transcripts identified 3′ UTRs for 38 of the ∼85 KSHV genes (see Table S5 in the supplemental material) (12, 23, 25, 32–58). Consistent with those studies, our work confirms each of these polyadenylation sites (Fig. 1). Our genome-wide analysis of the KSHV 3′ UTRs from BCBL cells shows that the GC content ranged from 26% (ORF 38) to 57% (ORF 46), with an average of 47.4%. This is within the range found for the GC content of human 3′ UTRs (42% ± 11%) (59). The 3′ UTR lengths ranged from 36 bp (K3) to 3,864 bp (ORF 7), with an average of 1,025 bp. On average, the KSHV 3′ UTRs are approximately 200 bp longer than human 3′ UTRs (60). As increasing the length of 3′ UTRs increases the probability of regulatory factor binding sites (60–63), viral 3′ UTRs may make a contribution to the control of viral gene expression.
Regulation of gene expression conveyed by KSHV 3′ UTRs.
To screen for potential regulatory activity of the KSHV 3′ UTRs, we cloned the genomic regions corresponding to 84 3′ UTRs behind the destabilized firefly luciferase gene in a plasmid expression vector. Essentially, these constructs replaced the vector-derived poly(A) signal with each individual KSHV poly(A) signal. We then individually transfected each plasmid along with a Renilla luciferase normalization control vector into latently infected TREx-RTA BCBL-1 cells. Under these conditions, 44 of the 3′ UTRs conveyed highly reproducible, negative regulation of at least 30%, compared to the parental vector-derived 3′ UTR (Fig. 2; see also Fig. S1 in the supplemental material). Thirty-two 3′ UTRs conveyed >50% reduction while a small number of 3′ UTRs, such as ORF 10, ORF 2, and ORF 60, conveyed 90% or greater reduction. A substantially smaller fraction (n = 11) of 3′ UTRs conveyed positive regulation of 30% or more, with the remaining 29 3′ UTRs conveying little difference in regulation compared to the vector 3′ UTR (Fig. 2). Thus, we conclude that half of the KSHV 3′ UTRs can direct negative regulation of gene expression compared to the vector 3′ UTR.
Fig 2.

Regulatory activity of KSHV 3′ UTRs on chimeric reporters. TREx-RTA BCBL-1 cells were transfected with chimeric 3′ UTR luciferase reporters, and luciferase assays were conducted. Half of the 3′ UTRs conveyed >30% negative regulation in cells latently infected with KSHV (TREx-RTA BCBL-1). In contrast, <15% of the 3′ UTRs conveyed >30% positive regulation of gene expression. Black bars represent negatively regulated reporters, gray bars represent neutral (unregulated) reporters, and white bars indicate positively regulated reporters. Data presented are the averages ± standard deviations of luciferase units from three biological replicates normalized to a cotransfected Renilla control and also normalized to a parental vector 3′ UTR.
To determine if the regulation observed in TREx-RTA BCBL-1 cells is cell type specific, we assayed the 84 3′ UTR reporters in two additional cell types: the transformed KSHV-negative BJAB B-cell line and the common laboratory HEK 293 cell line (see Fig. S2 in the supplemental material). Within each cell line, individual reporters conveyed a mostly similar expression pattern (see Table S6 in the supplemental material). Seventy-nine of the 84 KSHV 3′ UTRs conveyed the same mode of regulation in two or more of the cell types (Fig. 3). From these data, we conclude that a majority of the negatively regulated KSHV 3′ UTRs score in different cell types. These data demonstrate that virus-specific trans factors are not required for much of the KSHV 3′-UTR-mediated regulation that we observed.
Fig 3.
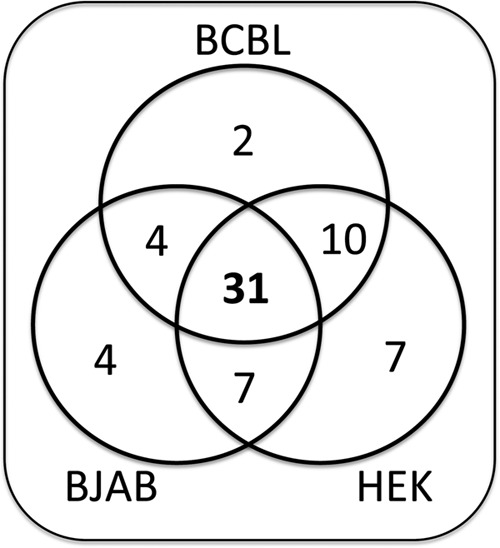
KSHV 3′ UTR chimeric reporters share regulatory potential in different cell lines. Each luciferase reporter was screened in latently infected B lymphocytes (BCBL), uninfected B lymphocytes (BJAB), or non-B cells (HEK 293) and is represented once on this Venn diagram (see Table S6 and Fig. S2 in the supplemental material). Seventy-eight of the 84 KSHV 3′ UTRs showed similar regulation in two or more cell lines. Only 6 of the KSHV 3′ UTRs conveyed negative regulation in only a single cell type.
Like all herpesviruses, KSHV expresses a subset of genes (approximately 5) in the latent phase of infection. Furthermore, lytic genes are expressed via a temporal cascade that initiates with immediate early followed by early and then late gene transcription, with the latter being expressed only after replication of the viral genome. Examination of the different classes of genes by timing of expression failed to reveal any striking pattern whereby a common mode of regulation was shared by the 3′ UTRs of each class. However, we noticed that individual clusters of genes that shared the same polyadenylation site, and therefore necessarily shared some 3′ UTR identity, frequently displayed similar regulation patterns (see Fig. S1 in the supplemental material). Eleven of the 22 clusters had all members that shared a common regulatory activity, including 8 clusters that had members with negative regulation (in blue), one cluster that conveyed positive regulation (in beige), and two clusters that did not impart regulation (in gray) compared to the control vector (see Fig. S1 in the supplemental material). Thus, while the different stages of the virus life cycle do not seem to be controlled by 3′-UTR-mediated expression, multiple genes of a single cluster can possess similar posttranscriptional regulations of gene expression via shared 3′ UTR elements.
We next examined the mechanism(s) of negative regulation conveyed by KSHV 3′ UTRs. Since it is commonly accepted that the 5′ and 3′ UTRs of a single transcript can be contiguous during translation (64–66), we first examined whether placing the 3′ UTR of a KSHV transcript in the context of a vector-derived 5′ UTR artificially alters the regulatory activity of the 3′ UTR. Therefore, for the K7 3′ UTR reporter, we replaced the parental vector-derived 5′ UTR with the natural K7 5′ UTR after performing 5′ RACE analysis to experimentally validate its sequence. In the context of the K7 5′ UTR, the K7 3′ UTR still conveyed negative regulation (Fig. 4). Consistent with numerous previous reports (67–69), our data suggest that studying the regulatory potential of a 3′ UTR in the context of a heterologous reporter transcript is valid for identifying regulatory activity.
Fig 4.
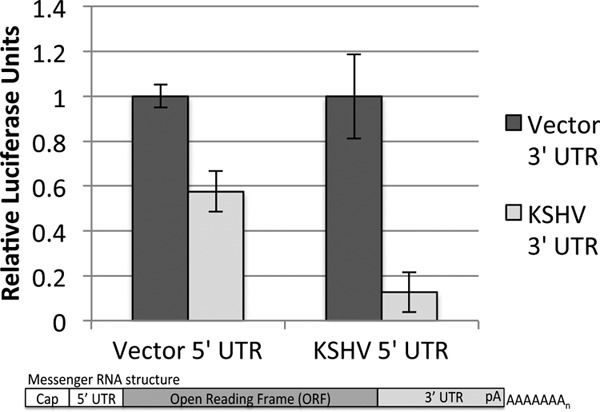
Preservation of the regulatory activity of the K7 3′ UTR in the context of its natural 5′ UTR. 5′ RACE was used to experimentally identify the native K7 5′ UTR expressed in TREx-RTA BCBL-1 cells. Luciferase assays were conducted on chimeric reporter constructs that contained either vector-derived or K7 5′ and 3′ UTRs. Data presented are the averages ± standard deviations of luciferase units from three biological replicates normalized to a cotransfected Renilla control and also normalized to a pair-matched vector 3′ UTR.
Next, we assayed a subset of negatively regulated KSHV 3′ UTRs via qRT-PCR to determine if the 3′ UTRs could convey negative regulation by altering the steady-state levels of transcripts (Fig. 5). Six transcripts that displayed ≥50% negative regulation in the luciferase reporter assay were chosen (Fig. 1), and our analysis demonstrated that all six were associated with decreased steady-state levels of their associated transcripts (Fig. 5). We conclude that decreased transcript steady-state levels contribute to the negative regulatory activity of at least a subset of KSHV 3′ UTRs.
Fig 5.
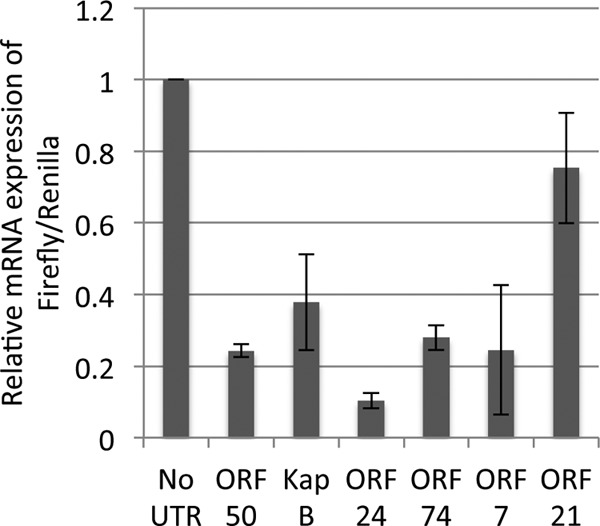
Decreased steady-state levels of transcripts bearing KSHV 3′ UTRs. A subset of chimeric luciferase reporter constructs shown to convey negative regulation (Fig. 2) were transfected into TREx-RTA BCBL-1 cells, and total RNA was prepared. Data from qRT-PCR analysis of the firefly luciferase chimeric reporter were normalized to data for transcripts from the Renilla luciferase control reporter. Data represent the averages ± standard errors of three independent experiments.
Previous studies of host 3′ UTRs demonstrated that discrete cis elements are required for negative regulation (4, 70). We therefore conducted bioinformatic analyses on the negatively regulated KSHV 3′ UTRs in an attempt to identify common cis elements. We did not detect enrichment for known primary sequence transcript-destabilizing elements such as AU-rich elements (data not shown). Furthermore, there was no correlation with length and the degree of negative regulation (data not shown). However, analysis of GC content showed that those 3′ UTRs with a higher GC content were more likely to be associated with negative regulation of gene expression (Fig. 6). Higher GC content can be associated with more stable secondary and tertiary structures (71) as well as alterations in efficiency of transcription and translation (72). To test a role for discrete structural elements in KSHV 3′ UTR negative regulatory activity, we assayed a series of internal deletion and truncation mutant reporters for six KSHV 3′ UTRs in two different cell lines (Fig. 7). These six 3′ UTRs were chosen because each reporter displayed negative regulation in at least two cell lines, and they had a broad range of 3′ UTR lengths. Strikingly, for all six 3′ UTRs tested, almost all mutant constructs demonstrated less negative regulation than the full-length 3′ UTR in both cell lines tested (Fig. 7). Although sequence elements may play a role in some of the regulation that we observed, our data suggest that the overall structure of at least some KSHV 3′ UTRs is also involved in mediating negative regulation of gene expression.
Fig 6.

Higher-GC-content KSHV 3′ UTRs are more likely to convey negative regulation. The KSHV 3′ UTRs were divided into four groups comprised of an equal number of members based on their GC content (n = 21 3′). The leftmost bar plots the transcripts with the lowest GC content, and the rightmost bar plots the transcripts with the highest GC content. The percentages of transcripts from each group are plotted.
Fig 7.

Most mutants of KSHV 3′ UTRs have less regulatory potential. Luciferase assays were conducted on mutants of select KSHV 3′ UTR reporters in BJAB and HEK 293 cells. The length of each 3′ UTR (base pairs) is shown next to the graphical representation for the UTR mutants. The 3′ UTRs assayed were ORF 74 (A), ORF 2 (B), v-IRF3 (C), K7 (D), ORF 24 (E), and ORF 59 (F). Each 3′ UTR mutant was designed to have a 60- to 100-bp truncation or internal deletion. The majority of the 3′ UTR mutants conveyed less regulation, indicating overall structure as a possible determinant in regulating gene expression. Cells were harvested for luciferase expression analysis 36 h after transfection. Data represent the averages ± standard deviations from three biological replicates normalized to data from a cotransfected Renilla transcript and a firefly luciferase parental vector-derived 3′ UTR control.
Differential degrees of KSHV 3′-UTR-mediated regulation in latent versus lytic infection.
Glaunsinger and colleagues identified a host shutoff activity during KSHV lytic infection whereby a majority of transcripts of both host and viral origins are subject to turnover, resulting in their decreased steady-state levels. A minority of host transcripts have been shown to escape host shutoff (73, 74), and at least one of these, the interleukin-6 (IL-6) transcript, does so in a manner involving its 3′ UTR (75). It is currently unknown whether viral transcripts escape shutoff-mediated turnover, and it has been suggested that some viral transcripts need not escape turnover since they are transcribed at high levels during lytic infection (76). We therefore tested whether any of the KSHV 3′ UTRs, similar to the IL-6 transcript, are sufficient to enhance gene expression during lytic infection. Twenty-four KSHV 3′ UTRs were chosen, which conveyed negative regulation in latent TREx-RTA BCBL-1 cells and had a high GC content. Each 3′ UTR was assayed for differential regulation during lytic infection. Consistent with the host shutoff phenomena, 15 of these transcripts displayed reduced expression levels of firefly luciferase (and the Renilla luciferase normalization control during lytic replication). In these cases, a greater effect was observed on the firefly luciferase transcripts, as represented by a reduction in the ratio of lytic/latent samples for the parental vector 3′ UTR control reporter (Fig. 8A). Interestingly, nine of the KSHV 3′ UTR reporters did not show a decrease in firefly luciferase expression levels in lytic replication, and in fact, six of these reporters showed an increase in the raw luciferase activity resulting in a lytic/latent ratio of >1.4 (Fig. 8A). To ensure that the effects that we observed were due to viral lytic replication (versus nonspecific effects of the drug regimen utilized to induce TREx-RTA BCBL-1 cells into lytic infection), we conducted the same experiment on the ORF 24 and ORF 74 3′ UTR reporters in the presence of an shRNA directed against the ORF 50 transcript (3, 77). The ORF 50 transcript gives rise to the master lytic switch protein that is necessary for KSHV lytic replication (13, 78–81). When RTA levels were knocked down, we observed a stark decrease (>2.5×) in the effects observed (Fig. 8B and C); that is, the ORF 24 and ORF 74 3′ UTR reporters no longer displayed positive regulation of gene expression, consistent with a role for lytic replication in increasing their expression levels.
Fig 8.

A subset of KSHV 3′ UTRs convey negative regulation during latent infection but positive regulation during lytic replication. Select KSHV 3′ UTR reporters were transfected into TREx-RTA BCBL-1 cells, and a portion of the cells was induced into lytic replication 24 h after transfection. (A) Luciferase assays were conducted 36 h after lytic induction. Most transcripts were subjected to a reduced or unchanged ratio of expression after lytic induction (light gray bars); however, six KSHV 3′ UTRs displayed a higher ratio of expression during lytic infection than in latently infected cells (dark gray bars). Each bar represents data from three biological experiments under conditions of both lytic and latent infection. For each individual experiment, the averages from three technical replicates of luciferase expression from lytic induction were compared to the averages from three technical replicates of luciferase expression from latent infection. (B and C) RTA is required during lytic replication to convey positive regulation of some KSHV 3′ UTRs. TREx-RTA BCBL-1 cells were electroporated with the luciferase constructs and an shRNA against KSHV RTA (shRTA) and allowed to recover for 24 h. Cells were then lytically induced, harvested after 36 h, and analyzed by Western blot analysis (B) or luciferase analysis (C). Cells treated with the shRNA against RTA showed a loss of positive gene expression conveyed by the ORF 24 and ORF 74 3′ UTRs after lytic induction (C). Data represent the averages ± standard deviations from three biological replicates normalized to data from a cotransfected Renilla luciferase transcript and to data from a firefly transcript containing a minimal vector 3′ UTR.
As an independent assay to determine the dependence of these effects on complete lytic infection, we also used a drug-based approach. Arias and colleagues previously showed that KSHV lytic infection induces Map kinase-interacting serine/threonine-protein kinase 1 (MNK1) and that inhibiting MNK1 leads to partial decreases in lytic replication and virus production (15). We analyzed 5 of the chimeric KSHV constructs that were not downregulated following lytic induction in the presence of a chemical MNK1 inhibitor (CGP57380) (Fig. 9). As controls, both the vector 3′ UTR and a 3′ UTR reporter that was not altered with lytic induction (ORF 20) did not show changes in expression levels after chemical treatment with the MNK1 inhibitor (Fig. 9). The ORF 49 and ORF 74 3′ UTR reporters did not show repeatable results under chemical inhibitor treatment after lytic induction (data not shown). However, when we assayed other reporters that convey differential regulation under lytic and latent conditions (ORFs 7, 21, and 24), we no longer observed an increase in reporter gene expression levels associated with lytic infection (Fig. 9). Thus, at least indirectly, KSHV induction of MNK1 activity during lytic infection is required for some 3′-UTR-mediated increased gene expression during lytic infection. Combined, the above-described data demonstrate that some KSHV 3′ UTRs are sufficient to promote an increase in gene expression levels during lytic infection, consistent with a role in evading virus-mediated host shutoff.
Fig 9.

MNK1 kinase activity is required for an increase in gene expression levels mediated by KSHV 3′ UTRs during lytic infection. TREx-RTA BCBL-1 cells were transfected with a subset of KSHV 3′ UTR reporters and allowed to recover for 24 h before lytic induction and treatment with an MNK1 inhibitor (CGP57380 [CGP]). Cells were harvested after 36 h (60 h after electroporation) and analyzed by a luciferase assay (A to E) or Western immunoblot analysis (F). 3′ UTR reporters that displayed increased gene expression during lytic infection (C to E) no longer showed this regulation in the presence of the MNK1 inhibitor. Data for luciferase assays represent the averages ± standard deviations from three biological replicates normalized to data for a cotransfected Renilla control transcript and to data for a firefly luciferase parental vector-derived 3′ UTR. Panel F shows an immunoblot analysis demonstrating the effects of the MNK1 inhibitor on the phosphorylation status of eIF4E and RTA protein levels. eIF4E-P refers to the phosphorylated form of eIF4E.
DISCUSSION
We have mapped the 3′ UTRs of the major KSHV transcripts from BCBL-1 cells. The fact that most of the 3′ UTRs that we mapped were confirmed by independent approaches (RNAseq, RACE, and tiled array analysis) supports their accuracy. A notable salient feature of the KSHV transcripts is the propensity for two or more mRNAs encoding different proteins to share the same polyadenylation site. These “clusters” of multiple genes possess partially overlapping 3′ UTRs. One possible reason why viruses may utilize common polyadenylation sites is to conserve genomic space. An alternative possibility revealed from our work is shared regulatory potential. Fifty percent (11/22) of clusters shared a similar trend in 3′-UTR-mediated regulation within all members of the same cluster.
Half (52%) of KSHV 3′ UTRs conveyed negative regulation under conditions of latent infection, while a smaller fraction (13%) promoted an increase in gene expression (Fig. 2). For a majority of transcripts, 3′-UTR-mediated regulation was common in at least two of the different cell lines tested (Fig. 3; see also Table S6 in the supplemental material). These data demonstrate that virus-derived trans factors are likely not required for most of the regulation conveyed by viral 3′ UTRs in our assays. Furthermore, these data suggest that any host trans factors required for KSHV 3′ UTR regulation must be common to different types of cells. The exact cis factors that convey KSHV 3′ UTR regulation remain to be defined with precision. However, our bioinformatic analysis suggests that the structure of the 3′ UTR plays a role in regulatory potential since those 3′ UTRs with the highest GC content were most likely to convey negative regulation. Indeed, most deletions made within negatively regulated KSHV 3′ UTRs were sufficient to reduce negative regulation. Previous work demonstrated that GC-rich sequence composition in RNA transcripts forms secondary structures that influence translation efficiency (82). This implies that overall structure, in addition to any local docking sites for trans factors, is likely important in KSHV 3′-UTR-mediated regulation.
To our knowledge, no studies have systematically looked at the role of viral 3′-UTR-mediated regulation in latent versus lytic infection. Our work revealed numerous KSHV transcripts that have regulatory potential within their 3′ UTRs. The reasons for the prevalence of this regulation remain to be determined. It is possible that some or even much of this regulation could be due to the artificial chimeric nature of our reporter assay. However, three lines of reasoning suggest that at least some of this regulation is likely relevant to natural transcripts. First, placing the K7 3′ UTR in a reporter context that carries the matched KSHV 5′ UTR preserves the mode of regulation observed from the 3′-UTR-only reporter (Fig. 4). Second, almost every internal deletion or truncation that we tested muted the regulatory potential of a particular 3′ UTR (Fig. 7), consistent with specific regulatory elements/structures. Finally, the fact that at least some of the regulation is dependent on the mode of infection (some of the 3′ UTRs convey negative regulation only during latent infection [Fig. 2 and 8]) supports the likely biological relevance of these 3′ UTRs.
The possible advantages that 3′-UTR-mediated negative regulation imparts on the virus include the ability to coregulate the expression of multiple genes in a cluster and to maintain tighter transcriptionally mediated control of gene expression through reducing the transcript half-life. Tight control of gene expression could be important in maintaining the proper timing of gene expression during the synchronized cascade of lytic infection (e.g., immediate early, early, and late) as well as differentially controlling gene expression during latent and lytic replication. It is interesting to note that at least one host transcript escapes KSHV-mediated shutoff during lytic infection partly through AU-rich elements in its 3′ UTR (75). Our work suggests the possibility that similar to IL-6, some viral transcripts may also utilize their 3′ UTR to help evade host shutoff. Some KSHV 3′ UTRs convey increased gene expression during lytic infection in a manner that is at least indirectly dependent on MNK1 kinase activity (Fig. 9). MNK1 phosphorylates different substrates and can selectively impact mRNA translation by phosphorylation of eukaryotic translation initiation factor 4E (eIF4E) or mRNA stability through the 3′ UTR. Buxade et al. showed previously that MNK1 controls the biosynthesis of tumor necrosis factor alpha (TNF-α) and can also enhance the expression of a reporter containing the TNF-α 3′ UTR (83). The mechanism for this mode of regulation may involve phosphorylation of the AU-rich element (ARE) binding protein heterogeneous nuclear ribonucleoprotein A1 (hnRNPA1) by MNK1. Alternatively, eIF4E phosphorylation by MNK1 could differentially translate select mRNAs through their 3′ UTR by an unknown mechanism (84, 85). As altering MNK1 kinase activity globally decreases lytic replication, it remains to be determined if either of these MNK1 effects applies directly to KSHV 3′ UTRs. Finally, the fact that half of the KSHV 3′ UTRs impart negative regulation during latent infection may suggest that this activity has been selected for, perhaps as a means to reduce antigenicity due to leaky foreign viral protein expression in vivo. Future efforts with in vivo models are required to test such a model.
In summary, our in-depth map of the KSHV 3′ UTRs serves as a resource for those interested in the control of KSHV gene expression. The prevalence of transcripts with regulatory potential and the differential regulation in latent versus lytic infection open new avenues of research for understanding how DNA viruses maintain persistent infections and differentially regulate gene expression.
Supplementary Material
ACKNOWLEDGMENTS
We thank the members and friends of the Sullivan laboratory for helpful conversations regarding this work; Don Ganem (Novartis), Britt Glaunsinger (UC Berkeley), Ren Sun (UCLA), and Craig McCormick (Dalhousie University) for numerous KSHV reagents; Jae Jung (USC) for the kind gift of the TREx-RTA BCBL-1 cells; and the Whiteley laboratory (UT Austin) for the use of their luminometer.
This work was supported by a Burroughs Wellcome Investigators in Pathogenesis and Infectious Disease award, a UT Austin Institute for Cellular and Molecular Biology fellowship, NIH grant RO1AI077746, and Cancer Prevention Research Institute of Texas (CPRIT) grant RP110098.
Footnotes
Published ahead of print 25 September 2013
Supplemental material for this article may be found at http://dx.doi.org/10.1128/JVI.02374-13.
REFERENCES
- 1.Elkon R, Ugalde AP, Agami R. 2013. Alternative cleavage and polyadenylation: extent, regulation and function. Nat. Rev. Genet. 14:496–506 [DOI] [PubMed] [Google Scholar]
- 2.Calin GA, Liu CG, Sevignani C, Ferracin M, Felli N, Dumitru CD, Shimizu M, Cimmino A, Zupo S, Dono M, Dell'Aquila ML, Alder H, Rassenti L, Kipps TJ, Bullrich F, Negrini M, Croce CM. 2004. MicroRNA profiling reveals distinct signatures in B cell chronic lymphocytic leukemias. Proc. Natl. Acad. Sci. U. S. A. 101:11755–11760 [DOI] [PMC free article] [PubMed] [Google Scholar]
- 3.Lin YT, Sullivan CS. 2011. Expanding the role of Drosha to the regulation of viral gene expression. Proc. Natl. Acad. Sci. U. S. A. 108:11229–11234 [DOI] [PMC free article] [PubMed] [Google Scholar]
- 4.Shaw G, Kamen R. 1986. A conserved AU sequence from the 3′ untranslated region of GM-CSF mRNA mediates selective mRNA degradation. Cell 46:659–667 [DOI] [PubMed] [Google Scholar]
- 5.Zhang Y, Xie RL, Croce CM, Stein JL, Lian JB, van Wijnen AJ, Stein GS. 2011. A program of microRNAs controls osteogenic lineage progression by targeting transcription factor Runx2. Proc. Natl. Acad. Sci. U. S. A. 108:9863–9868 [DOI] [PMC free article] [PubMed] [Google Scholar]
- 6.Jan CH, Friedman RC, Ruby JG, Bartel DP. 2011. Formation, regulation and evolution of Caenorhabditis elegans 3′UTRs. Nature 469:97–101 [DOI] [PMC free article] [PubMed] [Google Scholar]
- 7.Mangone M, Manoharan AP, Thierry-Mieg D, Thierry-Mieg J, Han T, Mackowiak SD, Mis E, Zegar C, Gutwein MR, Khivansara V, Attie O, Chen K, Salehi-Ashtiani K, Vidal M, Harkins TT, Bouffard P, Suzuki Y, Sugano S, Kohara Y, Rajewsky N, Piano F, Gunsalus KC, Kim JK. 2010. The landscape of C. elegans 3′UTRs. Science 329:432–435 [DOI] [PMC free article] [PubMed] [Google Scholar]
- 8.Pineiro D, Martinez-Salas E. 2012. RNA structural elements of hepatitis C virus controlling viral RNA translation and the implications for viral pathogenesis. Viruses 4:2233–2250 [DOI] [PMC free article] [PubMed] [Google Scholar]
- 9.Ganem D. 2007. Kaposi's sarcoma-associated herpesvirus, p 2847–2888 In Knipe DM, Howley PM, Griffin DE, Lamb RA, Martin MA, Roizman B, Straus SE. (ed), Fields virology, 5th ed. Lippincott Williams & Wilkins, Philadelphia, PA [Google Scholar]
- 10.Russo JJ, Bohenzky RA, Chien MC, Chen J, Yan M, Maddalena D, Parry JP, Peruzzi D, Edelman IS, Chang Y, Moore PS. 1996. Nucleotide sequence of the Kaposi sarcoma-associated herpesvirus (HHV8). Proc. Natl. Acad. Sci. U. S. A. 93:14862–14867 [DOI] [PMC free article] [PubMed] [Google Scholar]
- 11.Chang HH, Ganem D. 2013. A unique herpesviral transcriptional program in KSHV-infected lymphatic endothelial cells leads to mTORC1 activation and rapamycin sensitivity. Cell Host Microbe 13:429–440 [DOI] [PMC free article] [PubMed] [Google Scholar]
- 12.Chandriani S, Xu Y, Ganem D. 2010. The lytic transcriptome of Kaposi's sarcoma-associated herpesvirus reveals extensive transcription of noncoding regions, including regions antisense to important genes. J. Virol. 84:7934–7942 [DOI] [PMC free article] [PubMed] [Google Scholar]
- 13.Gradoville L, Gerlach J, Grogan E, Shedd D, Nikiforow S, Metroka C, Miller G. 2000. Kaposi's sarcoma-associated herpesvirus open reading frame 50/Rta protein activates the entire viral lytic cycle in the HH-B2 primary effusion lymphoma cell line. J. Virol. 74:6207–6212 [DOI] [PMC free article] [PubMed] [Google Scholar]
- 14.Mesri EA, Cesarman E, Boshoff C. 2010. Kaposi's sarcoma and its associated herpesvirus. Nat. Rev. Cancer 10:707–719 [DOI] [PMC free article] [PubMed] [Google Scholar]
- 15.Arias C, Walsh D, Harbell J, Wilson AC, Mohr I. 2009. Activation of host translational control pathways by a viral developmental switch. PLoS Pathog. 5:e1000334. 10.1371/journal.ppat.1000334 [DOI] [PMC free article] [PubMed] [Google Scholar]
- 16.Nakamura H, Lu M, Gwack Y, Souvlis J, Zeichner SL, Jung JU. 2003. Global changes in Kaposi's sarcoma-associated virus gene expression patterns following expression of a tetracycline-inducible Rta transactivator. J. Virol. 77:4205–4220 [DOI] [PMC free article] [PubMed] [Google Scholar]
- 17.Weber K, Bolander ME, Sarkar G. 1998. PIG-B: a homemade monophasic cocktail for the extraction of RNA. Mol. Biotechnol. 9:73–77 [DOI] [PubMed] [Google Scholar]
- 18.Chen CJ, Kincaid RP, Seo GJ, Bennett MD, Sullivan CS. 2011. Insights into Polyomaviridae microRNA function derived from study of the bandicoot papillomatosis carcinomatosis viruses. J. Virol. 85:4487–4500 [DOI] [PMC free article] [PubMed] [Google Scholar]
- 19.Gunther T, Grundhoff A. 2010. The epigenetic landscape of latent Kaposi sarcoma-associated herpesvirus genomes. PLoS Pathog. 6:e1000935. 10.1371/journal.ppat.1000935 [DOI] [PMC free article] [PubMed] [Google Scholar]
- 20.Sonenberg N, Hinnebusch AG. 2009. Regulation of translation initiation in eukaryotes: mechanisms and biological targets. Cell 136:731–745 [DOI] [PMC free article] [PubMed] [Google Scholar]
- 21.Cheng Y, Miura RM, Tian B. 2006. Prediction of mRNA polyadenylation sites by support vector machine. Bioinformatics 22:2320–2325 [DOI] [PubMed] [Google Scholar]
- 22.Chiou HC, Dabrowski C, Alwine JC. 1991. Simian virus 40 late mRNA leader sequences involved in augmenting mRNA accumulation via multiple mechanisms, including increased polyadenylation efficiency. J. Virol. 65:6677–6685 [DOI] [PMC free article] [PubMed] [Google Scholar]
- 23.Lin SF, Robinson DR, Miller G, Kung HJ. 1999. Kaposi's sarcoma-associated herpesvirus encodes a bZIP protein with homology to BZLF1 of Epstein-Barr virus. J. Virol. 73:1909–1917 [DOI] [PMC free article] [PubMed] [Google Scholar]
- 24.Lukac DM, Kirshner JR, Ganem D. 1999. Transcriptional activation by the product of open reading frame 50 of Kaposi's sarcoma-associated herpesvirus is required for lytic viral reactivation in B cells. J. Virol. 73:9348–9361 [DOI] [PMC free article] [PubMed] [Google Scholar]
- 25.Majerciak V, Yamanegi K, Zheng ZM. 2006. Gene structure and expression of Kaposi's sarcoma-associated herpesvirus ORF56, ORF57, ORF58, and ORF59. J. Virol. 80:11968–11981 [DOI] [PMC free article] [PubMed] [Google Scholar]
- 26.Polson AG, Huang L, Lukac DM, Blethrow JD, Morgan DO, Burlingame AL, Ganem D. 2001. Kaposi's sarcoma-associated herpesvirus K-bZIP protein is phosphorylated by cyclin-dependent kinases. J. Virol. 75:3175–3184 [DOI] [PMC free article] [PubMed] [Google Scholar]
- 27.Legendre M, Gautheret D. 2003. Sequence determinants in human polyadenylation site selection. BMC Genomics 4:7. 10.1186/1471-2164-4-7 [DOI] [PMC free article] [PubMed] [Google Scholar]
- 28.Edwalds-Gilbert G, Veraldi KL, Milcarek C. 1997. Alternative poly(A) site selection in complex transcription units: means to an end? Nucleic Acids Res. 25:2547–2561 [DOI] [PMC free article] [PubMed] [Google Scholar]
- 29.Tian B, Hu J, Zhang H, Lutz CS. 2005. A large-scale analysis of mRNA polyadenylation of human and mouse genes. Nucleic Acids Res. 33:201–212 [DOI] [PMC free article] [PubMed] [Google Scholar]
- 30.Colgan DF, Manley JL. 1997. Mechanism and regulation of mRNA polyadenylation. Genes Dev. 11:2755–2766 [DOI] [PubMed] [Google Scholar]
- 31.Beaudoing E, Freier S, Wyatt JR, Claverie JM, Gautheret D. 2000. Patterns of variant polyadenylation signal usage in human genes. Genome Res. 10:1001–1010 [DOI] [PMC free article] [PubMed] [Google Scholar]
- 32.Bello LJ, Davison AJ, Glenn MA, Whitehouse A, Rethmeier N, Schulz TF, Barklie Clements J. 1999. The human herpesvirus-8 ORF 57 gene and its properties. J. Gen. Virol. 80(Part 12):3207–3215 [DOI] [PubMed] [Google Scholar]
- 33.Bieleski L, Hindley C, Talbot SJ. 2004. A polypyrimidine tract facilitates the expression of Kaposi's sarcoma-associated herpesvirus vFLIP through an internal ribosome entry site. J. Gen. Virol. 85:615–620 [DOI] [PubMed] [Google Scholar]
- 34.Bisson SA, Page AL, Ganem D. 2009. A Kaposi's sarcoma-associated herpesvirus protein that forms inhibitory complexes with type I interferon receptor subunits, Jak and STAT proteins, and blocks interferon-mediated signal transduction. J. Virol. 83:5056–5066 [DOI] [PMC free article] [PubMed] [Google Scholar]
- 35.Chen L, Park MS. 2009. Identification and characterization of the promoter region of Kaposi's sarcoma-associated herpesvirus ORF11. Virus Res. 142:160–168 [DOI] [PubMed] [Google Scholar]
- 36.Chiou CJ, Poole LJ, Kim PS, Ciufo DM, Cannon JS, ap Rhys CM, Alcendor DJ, Zong JC, Ambinder RF, Hayward GS. 2002. Patterns of gene expression and a transactivation function exhibited by the vGCR (ORF74) chemokine receptor protein of Kaposi's sarcoma-associated herpesvirus. J. Virol. 76:3421–3439 [DOI] [PMC free article] [PubMed] [Google Scholar]
- 37.Cunningham C, Barnard S, Blackbourn DJ, Davison AJ. 2003. Transcription mapping of human herpesvirus 8 genes encoding viral interferon regulatory factors. J. Gen. Virol. 84:1471–1483 [DOI] [PubMed] [Google Scholar]
- 38.Deng H, Song MJ, Chu JT, Sun R. 2002. Transcriptional regulation of the interleukin-6 gene of human herpesvirus 8 (Kaposi's sarcoma-associated herpesvirus). J. Virol. 76:8252–8264 [DOI] [PMC free article] [PubMed] [Google Scholar]
- 39.Dittmer D, Lagunoff M, Renne R, Staskus K, Haase A, Ganem D. 1998. A cluster of latently expressed genes in Kaposi's sarcoma-associated herpesvirus. J. Virol. 72:8309–8315 [DOI] [PMC free article] [PubMed] [Google Scholar]
- 40.Gonzalez CM, Wong EL, Bowser BS, Hong GK, Kenney S, Damania B. 2006. Identification and characterization of the Orf49 protein of Kaposi's sarcoma-associated herpesvirus. J. Virol. 80:3062–3070 [DOI] [PMC free article] [PubMed] [Google Scholar]
- 41.Grundhoff A, Ganem D. 2001. Mechanisms governing expression of the v-FLIP gene of Kaposi's sarcoma-associated herpesvirus. J. Virol. 75:1857–1863 [DOI] [PMC free article] [PubMed] [Google Scholar]
- 42.Haque M, Chen J, Ueda K, Mori Y, Nakano K, Hirata Y, Kanamori S, Uchiyama Y, Inagi R, Okuno T, Yamanishi K. 2000. Identification and analysis of the K5 gene of Kaposi's sarcoma-associated herpesvirus. J. Virol. 74:2867–2875 [DOI] [PMC free article] [PubMed] [Google Scholar]
- 43.Haque M, Wang V, Davis DA, Zheng ZM, Yarchoan R. 2006. Genetic organization and hypoxic activation of the Kaposi's sarcoma-associated herpesvirus ORF34-37 gene cluster. J. Virol. 80:7037–7051 [DOI] [PMC free article] [PubMed] [Google Scholar]
- 44.Krishnan HH, Naranatt PP, Smith MS, Zeng L, Bloomer C, Chandran B. 2004. Concurrent expression of latent and a limited number of lytic genes with immune modulation and antiapoptotic function by Kaposi's sarcoma-associated herpesvirus early during infection of primary endothelial and fibroblast cells and subsequent decline of lytic gene expression. J. Virol. 78:3601–3620 [DOI] [PMC free article] [PubMed] [Google Scholar]
- 45.Lin HR, Ganem D. 2011. Viral microRNA target allows insight into the role of translation in governing microRNA target accessibility. Proc. Natl. Acad. Sci. U. S. A. 108:5148–5153 [DOI] [PMC free article] [PubMed] [Google Scholar]
- 46.Lin SF, Sun R, Heston L, Gradoville L, Shedd D, Haglund K, Rigsby M, Miller G. 1997. Identification, expression, and immunogenicity of Kaposi's sarcoma-associated herpesvirus-encoded small viral capsid antigen. J. Virol. 71:3069–3076 [DOI] [PMC free article] [PubMed] [Google Scholar]
- 47.Masa SR, Lando R, Sarid R. 2008. Transcriptional regulation of the open reading frame 35 encoded by Kaposi's sarcoma-associated herpesvirus. Virology 371:14–31 [DOI] [PubMed] [Google Scholar]
- 48.Murphy E, Vanicek J, Robins H, Shenk T, Levine AJ. 2008. Suppression of immediate-early viral gene expression by herpesvirus-coded microRNAs: implications for latency. Proc. Natl. Acad. Sci. U. S. A. 105:5453–5458 [DOI] [PMC free article] [PubMed] [Google Scholar]
- 49.Nador RG, Milligan LL, Flore O, Wang X, Arvanitakis L, Knowles DM, Cesarman E. 2001. Expression of Kaposi's sarcoma-associated herpesvirus G protein-coupled receptor monocistronic and bicistronic transcripts in primary effusion lymphomas. Virology 287:62–70 [DOI] [PubMed] [Google Scholar]
- 50.Rimessi P, Bonaccorsi A, Sturzl M, Fabris M, Brocca-Cofano E, Caputo A, Melucci-Vigo G, Falchi M, Cafaro A, Cassai E, Ensoli B, Monini P. 2001. Transcription pattern of human herpesvirus 8 open reading frame K3 in primary effusion lymphoma and Kaposi's sarcoma. J. Virol. 75:7161–7174 [DOI] [PMC free article] [PubMed] [Google Scholar]
- 51.Sadler R, Wu L, Forghani B, Renne R, Zhong W, Herndier B, Ganem D. 1999. A complex translational program generates multiple novel proteins from the latently expressed kaposin (K12) locus of Kaposi's sarcoma-associated herpesvirus. J. Virol. 73:5722–5730 [DOI] [PMC free article] [PubMed] [Google Scholar]
- 52.Santarelli R, Farina A, Granato M, Gonnella R, Raffa S, Leone L, Bei R, Modesti A, Frati L, Torrisi MR, Faggioni A. 2008. Identification and characterization of the product encoded by ORF69 of Kaposi's sarcoma-associated herpesvirus. J. Virol. 82:4562–4572 [DOI] [PMC free article] [PubMed] [Google Scholar]
- 53.Talbot SJ, Weiss RA, Kellam P, Boshoff C. 1999. Transcriptional analysis of human herpesvirus-8 open reading frames 71, 72, 73, K14, and 74 in a primary effusion lymphoma cell line. Virology 257:84–94 [DOI] [PubMed] [Google Scholar]
- 54.Taylor JL, Bennett HN, Snyder BA, Moore PS, Chang Y. 2005. Transcriptional analysis of latent and inducible Kaposi's sarcoma-associated herpesvirus transcripts in the K4 to K7 region. J. Virol. 79:15099–15106 [DOI] [PMC free article] [PubMed] [Google Scholar]
- 55.Wang L, Pietrek M, Brinkmann MM, Havemeier A, Fischer I, Hillenbrand B, Dittrich-Breiholz O, Kracht M, Chanas S, Blackbourn DJ, Schulz TF. 2009. Identification and functional characterization of a spliced rhesus rhadinovirus gene with homology to the K15 gene of Kaposi's sarcoma-associated herpesvirus. J. Gen. Virol. 90:1190–1201 [DOI] [PubMed] [Google Scholar]
- 56.Wu FY, Ahn JH, Alcendor DJ, Jang WJ, Xiao J, Hayward SD, Hayward GS. 2001. Origin-independent assembly of Kaposi's sarcoma-associated herpesvirus DNA replication compartments in transient cotransfection assays and association with the ORF-K8 protein and cellular PML. J. Virol. 75:1487–1506 [DOI] [PMC free article] [PubMed] [Google Scholar]
- 57.Zhu FX, Cusano T, Yuan Y. 1999. Identification of the immediate-early transcripts of Kaposi's sarcoma-associated herpesvirus. J. Virol. 73:5556–5567 [DOI] [PMC free article] [PubMed] [Google Scholar]
- 58.Li H, Komatsu T, Dezube BJ, Kaye KM. 2002. The Kaposi's sarcoma-associated herpesvirus K12 transcript from a primary effusion lymphoma contains complex repeat elements, is spliced, and initiates from a novel promoter. J. Virol. 76:11880–11888 [DOI] [PMC free article] [PubMed] [Google Scholar]
- 59.Pesole G, Mignone F, Gissi C, Grillo G, Licciulli F, Liuni S. 2001. Structural and functional features of eukaryotic mRNA untranslated regions. Gene 276:73–81 [DOI] [PubMed] [Google Scholar]
- 60.Santhanam AN, Bindewald E, Rajasekhar VK, Larsson O, Sonenberg N, Colburn NH, Shapiro BA. 2009. Role of 3′UTRs in the translation of mRNAs regulated by oncogenic eIF4E—a computational inference. PLoS One 4:e4868. 10.1371/journal.pone.0004868 [DOI] [PMC free article] [PubMed] [Google Scholar]
- 61.Bartel DP. 2009. MicroRNAs: target recognition and regulatory functions. Cell 136:215–233 [DOI] [PMC free article] [PubMed] [Google Scholar]
- 62.St Johnston D. 2005. Moving messages: the intracellular localization of mRNAs. Nat. Rev. Mol. Cell Biol. 6:363–375 [DOI] [PubMed] [Google Scholar]
- 63.Stubbs SH, Hunter OV, Hoover A, Conrad NK. 2012. Viral factors reveal a role for REF/Aly in nuclear RNA stability. Mol. Cell. Biol. 32:1260–1270 [DOI] [PMC free article] [PubMed] [Google Scholar]
- 64.Meijer HA, Kong YW, Lu WT, Wilczynska A, Spriggs RV, Robinson SW, Godfrey JD, Willis AE, Bushell M. 2013. Translational repression and eIF4A2 activity are critical for microRNA-mediated gene regulation. Science 340:82–85 [DOI] [PubMed] [Google Scholar]
- 65.Nicholson BL, Wu B, Chevtchenko I, White KA. 2010. Tombusvirus recruitment of host translational machinery via the 3′ UTR. RNA 16:1402–1419 [DOI] [PMC free article] [PubMed] [Google Scholar]
- 66.Stupina VA, Yuan X, Meskauskas A, Dinman JD, Simon AE. 2011. Ribosome binding to a 5′ translational enhancer is altered in the presence of the 3′ untranslated region in cap-independent translation of turnip crinkle virus. J. Virol. 85:4638–4653 [DOI] [PMC free article] [PubMed] [Google Scholar]
- 67.Conrad NK, Steitz JA. 2005. A Kaposi's sarcoma virus RNA element that increases the nuclear abundance of intronless transcripts. EMBO J. 24:1831–1841 [DOI] [PMC free article] [PubMed] [Google Scholar]
- 68.Krek A, Grun D, Poy MN, Wolf R, Rosenberg L, Epstein EJ, MacMenamin P, da Piedade I, Gunsalus KC, Stoffel M, Rajewsky N. 2005. Combinatorial microRNA target predictions. Nat. Genet. 37:495–500 [DOI] [PubMed] [Google Scholar]
- 69.Lim LP, Lau NC, Garrett-Engele P, Grimson A, Schelter JM, Castle J, Bartel DP, Linsley PS, Johnson JM. 2005. Microarray analysis shows that some microRNAs downregulate large numbers of target mRNAs. Nature 433:769–773 [DOI] [PubMed] [Google Scholar]
- 70.Ray D, Kazan H, Cook KB, Weirauch MT, Najafabadi HS, Li X, Gueroussov S, Albu M, Zheng H, Yang A, Na H, Irimia M, Matzat LH, Dale RK, Smith SA, Yarosh CA, Kelly SM, Nabet B, Mecenas D, Li W, Laishram RS, Qiao M, Lipshitz HD, Piano F, Corbett AH, Carstens RP, Frey BJ, Anderson RA, Lynch KW, Penalva LO, Lei EP, Fraser AG, Blencowe BJ, Morris QD, Hughes TR. 2013. A compendium of RNA-binding motifs for decoding gene regulation. Nature 499:172–177 [DOI] [PMC free article] [PubMed] [Google Scholar]
- 71.Qu X, Wen JD, Lancaster L, Noller HF, Bustamante C, Tinoco I., Jr 2011. The ribosome uses two active mechanisms to unwind messenger RNA during translation. Nature 475:118–121 [DOI] [PMC free article] [PubMed] [Google Scholar]
- 72.Kudla G, Lipinski L, Caffin F, Helwak A, Zylicz M. 2006. High guanine and cytosine content increases mRNA levels in mammalian cells. PLoS Biol. 4:e180. 10.1371/journal.pbio.0040180 [DOI] [PMC free article] [PubMed] [Google Scholar]
- 73.Chandriani S, Ganem D. 2007. Host transcript accumulation during lytic KSHV infection reveals several classes of host responses. PLoS One 2:e811. 10.1371/journal.pone.0000811 [DOI] [PMC free article] [PubMed] [Google Scholar]
- 74.Glaunsinger B, Ganem D. 2004. Highly selective escape from KSHV-mediated host mRNA shutoff and its implications for viral pathogenesis. J. Exp. Med. 200:391–398 [DOI] [PMC free article] [PubMed] [Google Scholar]
- 75.Hutin S, Lee Y, Glaunsinger BA. 2013. An RNA element in human interleukin 6 confers escape from degradation by the gammaherpesvirus SOX protein. J. Virol. 87:4672–4682 [DOI] [PMC free article] [PubMed] [Google Scholar]
- 76.Glaunsinger B, Ganem D. 2004. Lytic KSHV infection inhibits host gene expression by accelerating global mRNA turnover. Mol. Cell 13:713–723 [DOI] [PubMed] [Google Scholar]
- 77.Li X, Chen S, Feng J, Deng H, Sun R. 2010. Myc is required for the maintenance of Kaposi's sarcoma-associated herpesvirus latency. J. Virol. 84:8945–8948 [DOI] [PMC free article] [PubMed] [Google Scholar]
- 78.Bu W, Palmeri D, Krishnan R, Marin R, Aris VM, Soteropoulos P, Lukac DM. 2008. Identification of direct transcriptional targets of the Kaposi's sarcoma-associated herpesvirus Rta lytic switch protein by conditional nuclear localization. J. Virol. 82:10709–10723 [DOI] [PMC free article] [PubMed] [Google Scholar]
- 79.Sun R, Lin SF, Gradoville L, Yuan Y, Zhu F, Miller G. 1998. A viral gene that activates lytic cycle expression of Kaposi's sarcoma-associated herpesvirus. Proc. Natl. Acad. Sci. U. S. A. 95:10866–10871 [DOI] [PMC free article] [PubMed] [Google Scholar]
- 80.Xu Y, AuCoin DP, Huete AR, Cei SA, Hanson LJ, Pari GS. 2005. A Kaposi's sarcoma-associated herpesvirus/human herpesvirus 8 ORF50 deletion mutant is defective for reactivation of latent virus and DNA replication. J. Virol. 79:3479–3487 [DOI] [PMC free article] [PubMed] [Google Scholar]
- 81.Xi X, Persson LM, O'Brien MW, Mohr I, Wilson AC. 2012. Cooperation between viral interferon regulatory factor 4 and RTA to activate a subset of Kaposi's sarcoma-associated herpesvirus lytic promoters. J. Virol. 86:1021–1033 [DOI] [PMC free article] [PubMed] [Google Scholar]
- 82.Tuxworth WJ, Jr, Saghir AN, Spruill LS, Menick DR, McDermott PJ. 2004. Regulation of protein synthesis by eIF4E phosphorylation in adult cardiocytes: the consequence of secondary structure in the 5′-untranslated region of mRNA. Biochem. J. 378:73–82 [DOI] [PMC free article] [PubMed] [Google Scholar]
- 83.Buxade M, Parra JL, Rousseau S, Shpiro N, Marquez R, Morrice N, Bain J, Espel E, Proud CG. 2005. The Mnks are novel components in the control of TNF alpha biosynthesis and phosphorylate and regulate hnRNP A1. Immunity 23:177–189 [DOI] [PubMed] [Google Scholar]
- 84.Furic L, Rong L, Larsson O, Koumakpayi IH, Yoshida K, Brueschke A, Petroulakis E, Robichaud N, Pollak M, Gaboury LA, Pandolfi PP, Saad F, Sonenberg N. 2010. eIF4E phosphorylation promotes tumorigenesis and is associated with prostate cancer progression. Proc. Natl. Acad. Sci. U. S. A. 107:14134–14139 [DOI] [PMC free article] [PubMed] [Google Scholar]
- 85.Herdy B, Jaramillo M, Svitkin YV, Rosenfeld AB, Kobayashi M, Walsh D, Alain T, Sean P, Robichaud N, Topisirovic I, Furic L, Dowling RJ, Sylvestre A, Rong L, Colina R, Costa-Mattioli M, Fritz JH, Olivier M, Brown E, Mohr I, Sonenberg N. 2012. Translational control of the activation of transcription factor NF-kappaB and production of type I interferon by phosphorylation of the translation factor eIF4E. Nat. Immunol. 13:543–550 [DOI] [PMC free article] [PubMed] [Google Scholar]
Associated Data
This section collects any data citations, data availability statements, or supplementary materials included in this article.