

Abstract
The level of microbial translocation from the intestine is increased in HIV-1 infection. Proinflammatory cytokine production by peripheral antigen-presenting cells in response to translocated microbes or microbial products may contribute to systemic immune activation, a hallmark of HIV-1 infection. We investigated the cytokine responses of peripheral blood myeloid dendritic cells (mDCs) and monocytes to in vitro stimulation with commensal enteric Escherichia coli in peripheral blood mononuclear cells (PBMC) from untreated HIV-1-infected subjects and from uninfected controls. Levels of interleukin 23 (IL-23) produced by PBMC from HIV-1-infected subjects in response to E. coli stimulation were significantly higher than those produced by PBMC from uninfected subjects. IL-23 was produced primarily by CD16+ monocytes. This subset of monocytes was increased in frequency and expressed higher levels of Toll-like receptor 4 (TLR4) in HIV-1-infected individuals than in controls. Blocking TLR4 on total CD14+ monocytes reduced IL-23 production in response to E. coli stimulation. Levels of soluble CD27, an indicator of systemic immune activation, were elevated in HIV-1-infected subjects and were associated with the percentage of CD16+ monocytes and the induction of IL-23 by E. coli, providing a link between these parameters and systemic inflammation. Taken together, these results suggest that IL-23 produced by CD16+ monocytes in response to microbial stimulation may contribute to systemic immune activation in HIV-1-infected individuals.
INTRODUCTION
Systemic immune activation, a hallmark of human immunodeficiency virus type 1 (HIV-1) infection, is characterized by increased frequencies of activated immune cells such as B cells (1) and T cells (2, 3), increased T cell turnover (4–6), and increased levels of proinflammatory cytokines, such as interleukin 6 (IL-6) and tumor necrosis factor alpha (TNF-α), in serum (7, 8). Several studies have demonstrated a link between systemic immune activation and HIV-1 disease pathogenesis through a direct association between activated peripheral blood CD8 T cells and blood CD4 T cell depletion (9–11). Furthermore, blood CD8 T cell activation has been shown to be predictive of the development of AIDS and shorter survival times (12–15).
Although the mechanisms leading to systemic immune activation during HIV-1 infection are not fully understood, evidence suggests that the movement of bacteria and/or bacterial products from the intestinal lumen into the systemic circulation, a process called microbial translocation, may be a contributing factor. Initial studies demonstrated that levels of lipopolysaccharide (LPS) and bacterial DNA genes in plasma, indicators of systemic microbial translocation, were higher in HIV-1-infected subjects than in uninfected controls (16, 17) and correlated with CD8+ T cell activation in peripheral blood (16, 17). Further, levels of soluble CD14 (sCD14), an LPS receptor, in plasma were elevated in HIV-1-infected individuals, were correlated inversely with the CD4 T cell count in peripheral blood, and were found to be an independent predictor of mortality in HIV-1 infection (18, 19). Bacterial translocation is polymicrobial, with several different bacterial orders detectable in the plasma of HIV-1-infected individuals by bacterial rRNA gene sequencing (20). In support of a gut origin of microbial translocation, Estes et al. showed evidence of Escherichia coli bacteria and LPS in the intestinal lamina propria (LP) and draining lymph nodes during early stages of disease in a rhesus macaque model of simian immunodeficiency virus (SIV) infection (21).
One mechanism by which microbial products may contribute to immune activation is innate stimulation of antigen-presenting cells (APCs), such as monocytes and dendritic cells (DCs). Stimulation of human peripheral blood monocytes and DCs with different commensal bacteria induced the production of a range of pro- and anti-inflammatory cytokines, including TNF-α, IL-6, IL-8, IL-10, and IL-12 (22–26). In addition, we showed previously that commensal Escherichia coli and Bacteroides fragilis stimulation resulted in differential IL-10 and IL-23 production by human blood monocytes and myeloid DCs (mDCs) (27). These findings suggest that under normal circumstances, peripheral blood APCs would likely be capable of recognizing and producing cytokines in response to translocated commensal microbes. However, several studies have demonstrated that the function or activation state of APCs is altered in the setting of chronic HIV-1 infection, with evidence of increased DC activation and coreceptor expression (28, 29), altered spontaneous production of cytokines (30), and impaired ability to stimulate allogeneic T cells (31). In addition, HIV-1-infected individuals showed a higher frequency of the activated CD16+ monocyte subset than controls (32, 33). Moreover, plasma levels of cytokines typically produced by APCs, including IL-6 and TNF-α, are increased in HIV-1-infected individuals, further suggesting in vivo APC activation (7, 8, 34).
In the setting of untreated HIV-1 infection, it is possible that APC dysfunction is exacerbated by chronic exposure to both bacterial and viral antigens in vivo. One study examining peripheral blood mononuclear cells (PBMC) from both HIV-1-infected and uninfected donors suggested that decreased coproduction of TNF-α and IL-1β by CD14+ monocytes in vitro was due to LPS tolerance developed in vivo (16). However, several in vitro studies suggested that combined viral and bacterial stimulation might lead to elevated proinflammatory responses. For example, initial in vitro stimulation of PBMC through Toll-like receptor 8 (TLR8), which recognizes viral motifs such as HIV-1 single-stranded RNA (ssRNA), or with Aldrithiol-2-inactivated HIV-1, resulted in increased TNF-α production (35, 36). Moreover, we have demonstrated previously that stimulation of PBMC with a TLR7 and TLR8 (TLR7/8) ligand in combination with a TLR4 ligand leads to the production of the proinflammatory cytokine IL-23 (37). These data suggest that combined exposure to HIV-1 and translocated enteric bacteria or bacterial products in vivo might drive peripheral APCs toward a more proinflammatory profile. To address this issue, we characterized the cytokine responses of peripheral blood APCs from untreated HIV-1-infected individuals who had high plasma viremia and evidence of microbial translocation, based on elevated sCD14 levels, to in vitro stimulation with commensal enteric bacteria and compared them to APC responses from uninfected controls. We identified a bacterially induced increase in IL-23 production by HIV-1-infected PBMC that arose from blood CD16+ monocytes. We further showed that the frequency of CD16+ monocytes, and associated IL-23 production, was positively associated with soluble CD27 (sCD27), an indicator of systemic immune activation. These results support the role of IL-23 as an important cytokine linking bacterium-associated monocyte activation to the pathogenic state of chronic immune activation.
MATERIALS AND METHODS
Study participants.
Peripheral blood samples were obtained from 42 HIV-1-infected individuals who were nonsmokers and were either antiretroviral treatment (ART) naïve (n = 27) or had been off treatment for at least 6 months (n = 15). No statistical differences in the median plasma viral load or blood CD4 count were observed between ART-naïve and previously treated subjects (ART-naïve individuals had a median plasma viral load [range] of 47,150 [5,950 to 330,000] HIV-1 RNA copies/ml and a median blood CD4 cell count [range] of 443.5 [170 to 975] cells/μl, while for previously treated individuals, the corresponding values were 96,400 [4,080 to 2,690,000] HIV-1 RNA copies/ml and 274 [40 to 1,050] CD4 cells/μl). Samples from 41 nonsmoking individuals, self-identifying as non-HIV-1 infected, were also collected. All donors voluntarily gave written informed consent. The characteristics of study subject are detailed in Table 1. There were no statistical differences in the age range or gender ratio between the two cohorts. Collection of peripheral blood samples was approved by the Colorado Multiple Institutional Review Board (COMIRB) at the University of Colorado, Anschutz Medical Campus.
Table 1.
Study subject characteristics
| Characteristic | Value for group |
|
|---|---|---|
| Uninfected | HIV-1 infected | |
| No. of subjects | 41 | 43 |
| No. male/femalea | 25/16 | 29/14 |
| Age (yr)b,c | 29 (22–63) | 25 (19–54) |
| CD4+ cell count (cells/μl)c | N/A | 377 (40–1,050) |
| Viral load (HIV-1 RNA copies/ml plasma)c | N/A | 54,200 (3,230–2,690,000) |
The statistical significance of the difference between the ratios of male to female individuals for the HIV-1-infected and uninfected groups was calculated using Fisher's exact test. P = 0.65.
The statistical significance of the difference between the age ranges of the HIV-1-infected and uninfected groups was calculated using the Mann-Whitney test. P = 0.14.
Values are medians (ranges). N/A, not applicable.
Collection and preparation of human PBMC.
Peripheral blood samples were collected into heparin and EDTA Vacutainer tubes (Becton Dickinson [BD], Franklin Lakes, NJ), and whole blood was centrifuged to isolate plasma. PBMC were isolated from heparinized blood by standard Ficoll-Hypaque (Amersham Biosciences, Piscataway, NJ) density gradient centrifugation as described previously (27). PBMC were either used in in vitro assays immediately following isolation or cryopreserved for use in baseline flow cytometry staining.
In vitro stimulation of PBMC.
PBMC were stimulated in vitro with heat-inactivated E. coli or B. fragilis (ATCC 25922 and ATCC 25285, respectively; ATCC, Manassas, VA) or with ultrapure lipopolysaccharide (LPS) derived from E. coli K-12 (Invivogen, San Diego, CA). Whole bacteria were expanded, heat inactivated, and frozen in single-use aliquots at −20°C as described previously (27). PBMC were cultured in complete medium (CM) consisting of RPMI medium (Invitrogen, Carlsbad, CA) supplemented with 1% penicillin–streptomycin–l-glutamine (Sigma-Aldrich, St. Louis, MO) and 10% human AB serum (HS; Gemini Bioproducts, West Sacramento, CA). PBMC were stimulated with E. coli or B. fragilis at a ratio of 1 PBMC to 5 bacteria, or with LPS (10 μg/ml), or were cultured without stimuli for 18 to 24 h at 37°C under a 5% CO2 atmosphere. For assessment of intracellular cytokines, 1 μg/ml GolgiPlug (brefeldin A; BD Biosciences, San Jose, CA) was added 1 h after PBMC were placed into culture. For assessment of secreted cytokines, culture supernatants were collected and frozen at −20°C.
In vitro stimulation of enriched classical and CD16+ monocytes.
Total monocytes were enriched from PBMC by negative selection using a Pan Monocyte Isolation kit (Miltenyi Biotec, Auburn, CA) as per the manufacturer's recommended protocol. To ensure that mDCs were removed, the enriched monocytes were subsequently treated with biotin-labeled CD1c followed by anti-biotin microbeads (both from Miltenyi Biotec). The average purity of the enriched monocytes, based on positive CD14 staining, was 88.7%. Enriched monocytes were further separated into CD16-positive and -negative fractions using CD16+ microbeads (Miltenyi Biotec). The classical monocyte fraction contained an average of 96.07% classical monocytes (defined as CD14hi CD16− cells) and 1.07% CD16+ monocytes (defined as CD14+ CD16+ cells). The CD16+ monocyte fraction contained, on average, 40.99% CD16+ (CD14+ CD16+) monocytes and 20.55% classical (CD14hi CD16−) monocytes and was enriched, on average, 53-fold over the percentage of CD16+ monocytes within total PBMC. We also observed the appearance of a population of CD16+ cells that lacked CD14 expression, suggesting downregulation or shedding of CD14 during the isolation of CD16 monocytes from the enriched monocyte population. This fraction of cells accounted for 32.0% of the total cells. Minimal proportions of CD3+ T cells (0.39%), CD19+ B cells (1.78%), CD56+ cells (0.61%), and total DCs (1.15%) remained. Enriched classical and CD16+ monocyte populations were cultured at 2 × 10⁶ cells/ml in CM and were stimulated with E. coli at a 5:1 bacterium-to-cell ratio. Culture supernatants were collected after 18 to 24 h in culture and were stored at −20°C.
TLR4 blocking on enriched monocytes.
Total CD14+ monocytes were isolated from PBMC by positive selection using CD14+ microbeads (Miltenyi Biotec), as per the manufacturer's recommended protocol. The average purity of isolated CD14+ monocytes was 97.99% (range, 96.7 to 98.7%). CD14+ monocytes were cultured at 2 × 10⁶ cells/ml in CM and were preincubated with an anti-human TLR4 blocking antibody or an isotype control (both at 20 μg/ml; both from eBioscience, San Diego, CA) for 30 min at 37°C. CD14+ monocytes were then stimulated with E. coli or were cultured in medium alone for 16 h at 37°C. Culture supernatants were collected and stored at −20°C.
Addition of rhIL-10 or an anti-IL-10 antibody to stimulated PBMC.
Either recombinant human IL-10 (rhIL-10; dose range, 0.1 ng/ml to 20 ng/ml), an anti-human IL-10 antibody (10 μg/ml), or an isotype control (10 μg/ml) (all from R&D Systems, Minneapolis, MN) was added to PBMC cultures concurrently with E. coli, as described previously (27).
Flow cytometry protocol.
Standard flow cytometry protocols were used to assess the levels of expression of surface markers and intracellular cytokines by mDCs and monocytes on an LSR II flow cytometer (BD Immunocytometry Systems, San Jose, CA), as described previously (27, 29, 37). Quality control on the LSR II was performed daily through the Cytometer Setup and Tracking component of the BD FACSDiva software (BD Biosciences) as described previously (27, 38).
In all experiments, cells were stained with a Live/Dead fixable cell viability dye (Aqua-fluorescent reactive dye; Invitrogen) to identify viable cells. To detect intracellular cytokines produced by mDCs and monocytes, PBMC were surface stained with DC-identifying antibodies, including Lineage cocktail (fluorescein isothiocyanate [FITC]-conjugated antibodies against CD3, CD14, CD16, CD19, CD20, and CD56), allophycocyanin-Cy7-conjugated HLA-DR, phycoerythrin (PE)-Cy5-conjugated anti-CD11c, and peridinin chlorophyll protein (PerCP)-Cy5.5-conjugated anti-CD123 (all from BD Biosciences). mDCs were identified as Lineage cocktail− HLA-DR+ CD123low CD11c+. To identify monocytes, large cells were first gated, and lymphocytes were then excluded using forward and side scatter (FSC and SSC, respectively) properties. Monocytes were identified within this population as Lineage cocktail+ HLA-DR+. To identify IL-23 production within mDCs and monocytes, cells were stained with eFluor 450-conjugated IL-12p40/70, PE-conjugated IL-23p19, and matched isotype controls (all from eBioscience, San Diego, CA). Representative flow plots of the mDC and monocyte intracellular cytokine staining gating strategy are shown in Fig. S1 in the supplemental material.
To assess monocyte frequencies and the expression of TLR2, TLR4, and IL-10 receptor (IL-10R) on monocyte subsets prior to in vitro culture (baseline), PBMC were first stained with biotin-labeled TLR2, biotin-labeled TLR4, or an isotype control (all from eBioscience) and an FcR blocking reagent (Miltenyi Biotec). Next, the cells were stained with streptavidin-ECD (Beckman Coulter, Fullerton, CA), V450-conjugated CD14, Alexa Fluor 700-conjugated CD16 (both from BD Biosciences), and PE-conjugated IL-10R or an isotype control (BioLegend, San Diego, CA). Monocytes were identified by first gating on large, granular cells within an FSC and SSC gate, as described previously (39), and then subdividing the large, granular cells into CD14hi CD16− (classical) and CD14+ CD16+ (CD16+) monocyte subsets. The expression of TLR2, TLR4, and IL-10R was assessed on each subset. Within the CD16+ monocytes, the percentages of intermediate (CD14hi CD16+) and nonclassical (CD14low CD16−) monocytes were also assessed. This monocyte population gating strategy was also used to determine the purity of the monocyte populations in monocyte isolation experiments. Representative flow plots of the baseline monocyte gating strategy are shown in Fig. S2 in the supplemental material.
To assess the frequency of activated T cells, PBMC were surface stained with ECD-conjugated anti-CD3, allophycocyanin-conjugated anti-CD4, PE-conjugated anti-CD8, allophycocyanin-Cy7-conjugated anti-HLA-DR, and PE-Cy5-conjugated anti-CD38 or isotype controls. Activation of CD3+ CD4+ and CD3+ CD8+ T cells was determined by coexpression of CD38 and HLA-DR. Gates were placed using appropriate matched isotype controls. Representative flow plots are shown in Fig. S3 in the supplemental material.
Detection of cytokines within culture supernatants.
IL-12p70, IL-23, IL-10, and IL-6 enzyme-linked immunosorbent assays (ELISAs; eBioscience) were performed by using thawed culture supernatants according to the manufacturer's recommended protocols. Lower detection limits were 4 pg/ml for IL-12p70, 15 pg/ml for IL-23, 2.3 pg/ml for IL-10, and 1.6 pg/ml for IL-6.
Detection of LPS, soluble CD14, IL-6, and CD27 in plasma samples.
Levels of bacterial endotoxin (LPS) were evaluated using the Limulus amebocyte lysate assay (Lonza, Switzerland) in freshly thawed EDTA plasma that was diluted 1:10 (assays of samples with optical densities [ODs] above 0.1 were repeated with a 1:20 dilution) in HyClone endotoxin-free water and then heat inactivated at 80°C for 15 min. EDTA plasma was also used to evaluate levels of IL-6 (in undiluted plasma; R&D Systems) or soluble CD27 (sCD27) (in plasma diluted 1:20 in dilution buffer; Sanquin Blood Systems, Amsterdam, The Netherlands) by ELISA. Levels of sCD14 were evaluated in freshly thawed heparin plasma (diluted 1:500 in calibration diluent; R&D Systems) by ELISA.
Data and statistical analysis.
All flow cytometry data analysis was performed using FACSDiva software, version 6.1.2 (BD Biosciences). Isotype control values were subtracted from the antibody values as appropriate. Net values for the percentage of cytokine-positive cells and the amount of soluble cytokine production were calculated by subtracting the background (medium-only values) from the stimulation condition values. Statistical significance was evaluated using a Mann-Whitney test for comparison of the HIV-1-infected group to the uninfected controls, and a Wilcoxon matched-pairs signed-rank test was used for matched pairs. Spearman's test was used to assess statistical significance for associations between two parameters. For small sample sizes (n, ≤4), statistical significance was assessed using paired and unpaired t tests. A Fisher exact test was used to determine the significance of differences between the male/female ratios of the two cohorts. P values of <0.05 were considered significant. Statistical analysis was performed using GraphPad Prism statistical software (version 5.0; GraphPad Software, San Diego, CA).
RESULTS
PBMC from HIV-1-infected subjects produce levels of cytokines different from those of uninfected controls in response to commensal bacterial stimulation.
To assess HIV-1-infected and uninfected donors for differences in the PBMC cytokine response to commensal bacterial stimulation, PBMC from both cohorts were stimulated with E. coli or B. fragilis in vitro or were cultured in medium alone. PBMC from both HIV-1-infected individuals and uninfected controls that were cultured in medium only produced minimal and similar levels of IL-23, IL-12p70, IL-10, and IL-6 (data not shown). In response to in vitro E. coli stimulation, PBMC from HIV-1-infected individuals produced significantly more IL-23 than PBMC from uninfected donors (P < 0.0001) (Fig. 1), whereas IL-12p70 production was minimal, and no significant difference between the two groups was detected (P = 0.78) (Fig. 1). E. coli induced high levels of IL-10 and IL-6, and the production of both cytokines trended higher in HIV-1-infected subjects than in uninfected donors (P = 0.05 and 0.07, respectively) (Fig. 1).
Fig 1.

Cytokine production by PBMC in response to E. coli stimulation. Total PBMC from uninfected or HIV-1-infected subjects were cultured with or without heat-inactivated E. coli. Levels of IL-23 (from 38 uninfected and 40 HIV-1-infected subjects), IL-12p70 (from 25 uninfected and 27 HIV-1-infected subjects), IL-10 (from 41 uninfected and 40 HIV-1-infected subjects), and IL-6 (from 18 uninfected and 18 HIV-1-infected subjects) (log2 scale) were evaluated in culture supernatants. Values are shown as net cytokine production, which was calculated by subtracting the value for the medium-only control. Horizontal lines indicate median values. The statistical significance of the difference between uninfected and HIV-1-infected groups was calculated using a Mann-Whitney test.
In contrast to the response to E. coli stimulation, no statistical difference in the production of IL-23 by PBMC in response to B. fragilis was found between the HIV-1-infected and uninfected subjects (P = 0.97) (see Fig. S4 in the supplemental material). However, significantly lower IL-12p70 levels were produced by PBMC from HIV-1-infected subjects in response to B. fragilis (P = 0.01) (see Fig. S4). As with E. coli stimulation, IL-10 production trended higher in HIV-1-infected subjects (P = 0.08) (see Fig. S4), and IL-6 production in response to B. fragilis stimulation was significantly higher in HIV-1-infected individuals than in uninfected controls (P = 0.007) (see Fig. S4).
In our previous study, B. fragilis induced significantly more IL-23 production than did E. coli in normal PBMC (27). However, similar levels of IL-23 were induced by E. coli and B. fragilis in PBMC from HIV-1-infected subjects (data not shown), suggesting that the mechanism for recognition and response to E. coli was altered in HIV-1-infected donors. Therefore, to investigate the mechanism(s) underlying the E. coli-induced increase in IL-23 production in HIV-1-infected individuals, all further experiments in this report focused on characterizing the response to E. coli.
CD16+ monocytes produce the majority of IL-23 in response to E. coli stimulation, and their frequency is increased in HIV-1-infected individuals.
The contributions of mDCs and monocytes to the total IL-23 production observed in PBMC in response to E. coli stimulation in both HIV-1-infected individuals and uninfected controls were next evaluated. No significant difference in the percentage of mDCs producing IL-23 in response to E. coli was observed between HIV-1-infected individuals and uninfected controls (P = 0.25) (Fig. 2A). However, the percentage of monocytes producing IL-23 in response to E. coli was significantly increased in HIV-1-infected individuals (P = 0.02) (Fig. 2A).
Fig 2.

CD16+ monocytes are the predominant producers of IL-23 in response to E. coli stimulation. (A) Total PBMC from uninfected (n = 10) and HIV-1-infected (n = 10) subjects were either left unstimulated or stimulated with heat-inactivated E. coli, and the frequencies of IL-23+ (IL-12p40/70+ IL-23p19+) mDCs and lineage cocktail+ HLA-DR+ cells (monocytes) were determined by flow cytometry. The value for background (isotype) staining was subtracted from each antibody value. Data are shown as the net percentage of total mDCs or monocytes positive for IL-23 expression, calculated by subtracting the medium-only value. Horizontal lines indicate median values. The statistical significance of the difference between uninfected and HIV-1-infected individuals was calculated using a Mann-Whitney test. (B) Classical and CD16+ monocytes from uninfected donors (n = 3) were cultured with E. coli, and levels of IL-23 or IL-10 were evaluated in culture supernatants. Data are shown as the net production of the indicated cytokine, calculated by subtracting the value for the medium-only control.
To determine if IL-23 production by monocytes differed between the classical and CD16+ monocyte subsets, isolated monocytes from uninfected donors were separated into classical and CD16+ monocyte fractions, which were stimulated with E. coli, and IL-23 and IL-10 production was measured in culture supernatants (Fig. 2B). In all three donors tested, CD16+ monocytes produced more IL-23 than did classical monocytes. Although both monocyte populations produced IL-10 in response to E. coli stimulation, the classical monocytes were the main producers of this cytokine.
In order to determine the relationship between monocyte subsets and elevated E. coli-induced IL-23 production, we first determined the percentage of each monocyte subset within PBMC from HIV-1-infected and uninfected individuals prior to in vitro culture (baseline). Frequencies of CD16+ monocytes were significantly higher (P < 0.0001) in the peripheral blood of HIV-1-infected subjects than in that of uninfected donors (Fig. 3A), whereas classical monocyte frequencies did not differ significantly (P = 0.43) (Fig. 3B). Comparisons of absolute numbers of CD16+ and classical monocytes between HIV-1-infected and uninfected donors revealed similar increases in the CD16+ population (data not shown). When CD16+ monocytes were further separated into intermediate and nonclassical monocyte subpopulations based on differential CD14 expression, the percentages of each of these subsets were significantly higher in HIV-1-infected individuals than in uninfected controls (P < 0.0001 and 0.041, respectively) (see Fig. S5A and B in the supplemental material).
Fig 3.

Percentages of CD16+ and classical monocytes and correlation with E. coli-induced cytokine levels. (A and B) The percentages of large, granular cells within PBMC that were CD16+ (A) or classical (B) monocytes were determined by flow cytometry for HIV-1-infected (n = 32) and uninfected (n = 29) subjects prior to in vitro culture (baseline). Percentages were calculated relative to the total quantity of large, granular cells. Horizontal lines indicate median values. The statistical significance of the difference between HIV-1-infected and uninfected groups was calculated using a Mann-Whitney test. (C and D) The correlations between the percentages of CD16+ (C) and classical (D) monocytes and the amount of IL-23 produced by PBMC from HIV-1-infected individuals (n = 30) in response to in vitro E. coli stimulation were calculated using a Spearman test. (E and F) The correlations between the percentages of CD16+ (E) and classical (F) monocytes and the amount of IL-10 produced by PBMC from HIV-1-infected individuals (n = 32) in response to in vitro E. coli stimulation were calculated using a Spearman test.
Associations between baseline frequencies of monocyte subsets and in vitro E. coli-induced cytokine production were next evaluated. CD16+ monocyte frequencies correlated positively (r = 0.44; P = 0.015), whereas classical monocyte frequencies correlated negatively (r = −0.49; P = 0.005), with E. coli-induced IL-23 levels (Fig. 3C and D). The frequencies of both monocyte subsets failed to correlate significantly with E. coli-induced IL-10 levels (for CD16+ monocytes, r was −0.14 and P was 0.44; for classical monocytes, r was 0.18 and P was 0.33) (Fig. 3E and F). When CD16+ monocytes were divided into intermediate and nonclassical subpopulations, nonclassical monocyte frequencies correlated significantly with IL-23 production (r = 0.28; P = 0.03), whereas the frequencies of the intermediate monocytes did not (r = 0.4; P = 0.13) (see Fig. S5 in the supplemental material). Neither intermediate nor nonclassical monocytes correlated with IL-10 production (data not shown). These data suggest that increased percentages of CD16+ monocytes may be responsible for elevated E. coli-induced IL-23 production in HIV-1-infected individuals and that the nonclassical monocytes within this subset may be particularly involved in IL-23 production in response to E. coli stimulation.
The failure of IL-10 suppression does not fully explain increased HIV-1-associated IL-23 production.
We showed previously that IL-10 produced in response to bacterial stimulation regulates the concurrent production of both IL-23 and IL-12p70 (27). We therefore hypothesized that the increased production of IL-23 in response to E. coli could result from a lack of IL-10 suppression, via either altered IL-10R expression or a decreased responsiveness to IL-10 by CD16+ monocytes. Although slightly lower percentages (medians, 31.24% for uninfected subjects and 27.39% for HIV-1-infected subjects; P = 0.13) (Fig. 4A) and expression levels (median MFI [mean fluorescent intensity], 278.5 for uninfected subjects and 259.1 for HIV-1 infected subjects; P = 0.08) (Fig. 4B) of IL-10R on CD16+ monocytes were observed for HIV-1-infected subjects than for uninfected subjects, these differences did not reach statistical significance. Further, the addition of rhIL-10 inhibited IL-23 production in response to E. coli stimulation in a similarly dose-dependent manner in both HIV-1-infected and uninfected subjects (Fig. 4C). The addition of an anti-IL-10 blocking antibody led to a significant increase in IL-23 production over that with the isotype control in both HIV-1-infected and uninfected PBMC (P = 0.008 and 0.02, respectively) (Fig. 4D). Taken together, these data indicate that an inability to recognize or respond to IL-10 is unlikely to be responsible for the E. coli-induced increase in IL-23 production in HIV-1-infected individuals.
Fig 4.

IL-10 receptor expression on CD16+ monocytes and responsiveness to IL-10 signaling. (A and B) The percentage of CD16+ monocytes in PBMC that expressed the IL-10 receptor (IL-10R) (A) and the expression level of IL-10R on CD16+ monocytes (B) was determined prior to in vitro culture (baseline) by flow cytometry for HIV-1-infected (n = 28) and uninfected (n = 21) subjects. The expression level was expressed as mean fluorescent intensity (MFI). Horizontal lines indicate median values. The statistical significance of the difference between HIV-1-infected and uninfected groups was calculated using a Mann-Whitney test. (C) Inhibition of IL-23 production by total-PBMC cultures from HIV-1-infected (n = 4) and uninfected (n = 4) individuals in response to E. coli stimulation by recombinant human IL-10 (rhIL-10). Results are mean percentages of inhibition of IL-23 levels in the presence of varying doses of rhIL-10. Error bars, standard errors of the means. The statistical significance of the difference in the percentage of inhibition between HIV-1-infected and uninfected individuals at different doses of rhIL-10 was calculated using an unpaired t test. (D) Production of IL-23 by total-PBMC cultures from HIV-1-infected (n = 8) and uninfected (n = 8) donors stimulated with E. coli in the presence of an anti-IL-10 (αIL-10) blocking antibody or an isotype control. Results are shown as net IL-23 production, calculated by subtracting the value for the medium-only background control from the value for the stimulation condition. Lines connect data from the same donor. The statistical significance of the difference between the blocking-antibody and isotype control conditions was calculated using a Wilcoxon matched-pairs signed-rank test.
TLR4 expression is increased on CD16+ monocytes in HIV-1-infected individuals and contributes to IL-23 production.
Since altered expression of pattern recognition receptors (PRRs), such as TLRs, that recognize conserved bacterial motifs known as microbe-associated molecular patterns (MAMPs) could explain the increased production of IL-23 by CD16+ monocytes in response to E. coli stimulation, the expression of TLR2 and TLR4 on CD16+ monocytes was measured in HIV-1-infected and uninfected PBMC. Both the percentage of CD16+ monocytes expressing TLR4 and the expression level of TLR4 on CD16+ monocytes were higher in HIV-1-infected individuals than in uninfected controls (P = 0.003 and 0.02, respectively) (Fig. 5A and B). Increased TLR4 expression among CD16+ monocytes was dominated by higher TLR4 expression on the nonclassical CD16+ monocyte subset (data not shown). Conversely, the expression of TLR2 on CD16+ monocytes was significantly lower in HIV-1-infected individuals (P = 0.005) (Fig. 5D), although the percentages of CD16+ monocytes expressing TLR2 were high and similar for infected and uninfected subjects (P = 0.66) (Fig. 5C). Among CD16+ monocytes from HIV-1-infected subjects, decreased TLR2 expression was observed in both the intermediate and nonclassical CD16+ monocyte subsets (data not shown).
Fig 5.

Percentages of CD16+ monocytes expressing TLR4 and TLR2. Flow cytometry was used to evaluate the percentages of CD16+ monocytes expressing TLR4 (A) and TLR2 (C) as well as the expression levels of TLR4 (B) and TLR2 (D) within total PBMC from HIV-1-infected (n = 32) and uninfected (n = 29) subjects prior to in vitro culture (baseline). Expression levels are shown as mean fluorescent intensity (MFI). Horizontal lines indicate median values. The statistical significance of the difference between HIV-1-infected and uninfected subjects was calculated using a Mann-Whitney test.
Given the higher TLR4 levels on HIV-1-infected CD16+ monocytes, we next determined if levels of cytokine production differed following in vitro stimulation of PBMC with commensal E. coli LPS, a purified TLR4 ligand. LPS stimulation induced IL-23 production in both cohorts, at levels slightly below those induced with whole E. coli bacteria (Fig. 6A; compare with Fig. 1). Although median IL-23 levels were higher in PBMC from HIV-1-infected subjects, these differences were not statistically significant (P = 0.11) (Fig. 6A). IL-23 production in response to both LPS and E. coli was significantly decreased in the presence of a neutralizing antibody against TLR4 (37.9% [P = 0.005] and 11% [P, 0.04] reductions, respectively) (Fig. 6B), confirming a role for TLR4 signaling in IL-23 production in response to E. coli stimulation. Finally, to determine whether there was an association between the expression level of TLR4 on CD16+ monocytes and E. coli-induced IL-23, these parameters were assessed for correlations. The expression level of TLR4 on CD16+ monocytes did not correlate with levels of E. coli-induced IL-23 (data not shown). The facts that the IL-23 response to LPS was inhibited to a greater extent than its response to E. coli as a result of TLR4 blockade and that the level of TLR4 expression on CD16+ monocytes did not correlate with the level of E. coli-induced IL-23 production suggest that TLR4 signaling may be only partly responsible for the IL-23 produced in response to intact bacteria.
Fig 6.
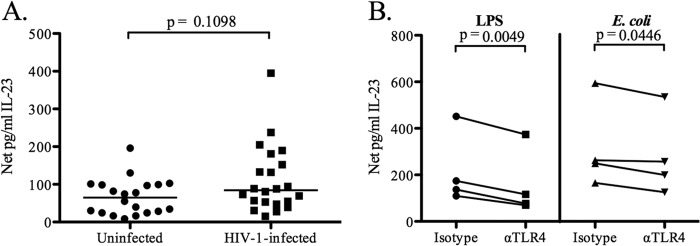
Contribution of TLR4 signaling to IL-23 production by total PBMC and CD14+ monocytes. (A) Production of IL-23 by total PBMC from HIV-1-infected (n = 22) and uninfected (n = 20) subjects after stimulation with purified LPS from E. coli. Results are shown as net IL-23 production. Horizontal lines indicate median values. The statistical significance of the difference between HIV-1-infected and uninfected subjects was calculated using a Mann-Whitney test. (B) Production of IL-23 by CD14+ monocytes from uninfected controls (n = 4) stimulated with purified LPS or whole E. coli in the presence of an anti-TLR4 antibody or an isotype control. Lines connect data from the same donor. The statistical significance of the difference between the blocking-antibody and isotype control conditions was calculated using a paired t test.
E. coli-induced IL-23 production and CD16+ monocyte frequencies in HIV-1-infected individuals correlate with sCD27, a plasma biomarker of systemic immune activation.
Levels of sCD27 and IL-6, indicators of inflammation, and of LPS and sCD14, indicators of microbial translocation, in the plasma of HIV-1-infected and uninfected subjects were evaluated. Levels of sCD27, IL-6, and sCD14 were higher in HIV-1-infected individuals than in uninfected individuals (P < 0.01 for all) (see Fig. S6 in the supplemental material). Plasma LPS levels were slightly higher in HIV-1-infected individuals than in uninfected individuals, although this difference did not reach statistical significance (P = 0.15) (see Fig. S6).
Associations between plasma biomarkers and either E. coli-induced cytokine levels or baseline monocyte subset percentages were determined for HIV-1-infected donors. Plasma sCD27 levels were found to correlate positively with both the level of E. coli-induced IL-23 (r = 0.39; P = 0.02) (Fig. 7A) and the baseline percentage of CD16+ monocytes (r = 0.38; P = 0.04) (Fig. 7C). Furthermore, levels of sCD27 correlated negatively with both the level of E. coli-induced IL-10 (r = −0.42; P = 0.01) (Fig. 7B) and the baseline percentage of classical monocytes (r = −0.43; P = 0.01) (Fig. 7D). Plasma sCD27 levels correlated strongly with the percentages of CD38+ HLA-DR+ CD8+ and CD38+ HLA-DR+ CD4+ T cells when HIV-1-infected and uninfected donors were combined (see Fig. S6 in the supplemental material), as has been demonstrated previously (40), but in HIV-1-infected individuals alone, sCD27 levels correlated significantly only with CD38+ HLA-DR+ CD4+ T cells (r = 0.44; P = 0.01). Neither E. coli-induced IL-23 or IL-10 production nor the percentage of classical or CD16+ monocytes correlated with the percentage of activated CD8+ or CD4+ T cells in HIV-1-infected donors (see Table S1 in the supplemental material). Additional analyses with the HIV-1-infected donor cohort found that neither E. coli-induced IL-10 or IL-23 production nor the percentage of CD16+ or classical monocytes correlated significantly with the HIV-1 viral load, the CD4 T cell count, or the level of sCD14, IL-6, or LPS in plasma (see Table S1).
Fig 7.

Correlation of plasma sCD27 levels with E. coli-induced IL-23 and IL-10 and with the frequencies of CD16+ and classical monocytes. Levels of sCD27 in the plasma of HIV-1-infected individuals (n = 38) were evaluated by ELISA. (A and B) Levels of sCD27 were correlated with levels of IL-23 (n = 35) (A) and IL-10 (n = 38) (B) produced by total PBMC from HIV-1-infected individuals after in vitro stimulation with E. coli. (C and D) Levels of sCD27 were correlated with the percentages of CD16+ (n = 31) (C) and classical (n = 31) (D) monocytes within total PBMC prior to in vitro culture (baseline). Levels of sCD27 are shown on a log2 scale. Correlations between parameters were calculated using a Spearman test.
DISCUSSION
In this report, we investigated the cytokine responses of DCs and monocytes to in vitro stimulation with commensal enteric bacteria in an effort to model potential interactions between translocated bacteria and blood APCs in HIV-1 infection and to determine whether these responses could contribute to systemic immune activation. PBMC from untreated HIV-1-infected individuals produced significantly more proinflammatory IL-23 in response to in vitro E. coli stimulation than PBMC from uninfected individuals. This novel finding expands on a previous study in which PBMC from acutely HIV-1 infected individuals were shown to produce IL-23 in response to LPS stimulation (41). We further addressed the cellular source of increased IL-23 production and found that IL-23 was preferentially produced by CD16+ monocytes. CD16+ monocyte levels were higher in HIV-1-infected individuals than in controls, in agreement with previous studies (32, 33). Furthermore, increased percentages of CD16+ monocytes, primarily the nonclassical monocyte subset, were associated with increased IL-23 production in our cohort and thus were likely responsible for increased IL-23 production in response to in vitro stimulation with E. coli.
We have shown previously that production of the anti-inflammatory cytokine IL-10 can regulate the production of both IL-12p70 and IL-23 (27). However, increased IL-23 production in response to E. coli stimulation in HIV-1-infected individuals was not due primarily to a lack of responsiveness to IL-10. Increased signaling through TLR4, due to its higher expression levels, provides one potential mechanism by which increased frequencies of CD16+ monocytes, particularly nonclassical monocytes, contribute to increased IL-23 production in response to E. coli stimulation in HIV-1-infected individuals. Previous studies have shown that monocyte TLR2 expression was elevated, but TLR4 expression unchanged, in HIV-1-infected individuals (42, 43). However, these studies evaluated TLR expression on total monocytes and were performed in a combined cohort of antiretroviral-treated and untreated HIV-1-infected individuals. In contrast, our study addressed TLR expression on the CD16+ monocyte subset and was focused solely on expression in PBMC from untreated, viremic HIV-1-infected individuals.
A previous study examining CD14+ monocyte coproduction of TNF-α and IL-1β within PBMC from both HIV-1-infected individuals and uninfected controls demonstrated an inverse correlation between plasma LPS levels and the production of these cytokines in response to in vitro LPS stimulation, implying that increased exposure to microbial products in vivo might lead to tolerance (16). In contrast, we did not find a significant positive or negative association between plasma LPS or sCD14 levels in untreated HIV-1-infected donors and either the percentage of CD16+ monocytes or the level of IL-23 production by PBMC in response to E. coli stimulation. These findings suggest that potential exposure to LPS in vivo does not necessarily lead to hyporesponsiveness to further bacterial stimulation, but they also fail to demonstrate conclusively that in vivo exposure to bacterial products alone drives monocytes toward elevated proinflammatory cytokine production. It is more likely that a combination of in vivo signals, perhaps from viral and bacterial products as well as from cytokines, is responsible for activating monocytes and skewing them toward a more proinflammatory profile.
It is important to consider that the translocation of microbial products from the intestine during HIV-1 infection probably includes more than just LPS from Gram-negative bacteria (20). Although the exact innate in vivo triggers responsible for skewing monocytes toward elevated proinflammatory cytokine production in HIV-1-infected individuals remain to be determined, PRR recognition of multiple MAMPs from various commensal bacteria may dictate the innate proinflammatory response elicited (44). Indeed, in the present study, B. fragilis induced significantly higher IL-6 production by PBMC from HIV-1-infected individuals, whereas E. coli stimulation did not induce as great an increase. Thus, exposure of APCs to several types of commensal bacteria and their respective MAMPs in vivo could lead to elevated production of multiple proinflammatory cytokines and thereby contribute to overall systemic immune activation. It will be important to determine the exact bacteria and bacterial products that are preferentially translocated, since it is clear that different bacterial MAMPs can induce differential cytokine responses from peripheral APCs.
In our study, we observed that plasma sCD27 levels were higher in untreated HIV-1-infected individuals than in uninfected controls and were positively correlated with the percentages of activated blood CD4+ and CD8+ T cells when data from HIV-1-infected and uninfected individuals were combined, in agreement with results from a study of HIV-1-infected Ethiopians (40). These findings suggest that the higher plasma sCD27 levels in HIV-1-infected individuals reflect HIV-1-associated systemic immune activation. Plasma sCD27 levels were positively associated with increased IL-23 production in response to E. coli stimulation and with the percentage of CD16+ monocytes, demonstrating a link between these parameters and systemic immune activation in HIV-1-infected individuals. However, we did not observe a similar positive association between E. coli-induced IL-23 or baseline CD16+ monocyte frequency and activated CD4+ or CD8+ T cell frequencies. The positive associations with plasma sCD27 levels, but lack of association with peripheral blood T cell activation, may be due to the fact that sCD27 is shed from multiple activated cell types, including both T cells and B cells (45–47). In the setting of untreated infection, therefore, increased proinflammatory monocyte frequencies and cytokine production may reflect more generalized or complex immune activation processes than are reflected by measuring T cell activation markers alone.
A recent study using a rhesus macaque model of acute SIV infection demonstrated that IL-23 mRNA expression by CD14+ monocytes was elevated and correlated with levels of sCD14 and LPS binding protein in plasma, suggesting that monocyte production of IL-23 can occur in vivo and is associated with markers of microbial translocation (48). Elevated in vivo IL-23 production could contribute to systemic immune activation through the role of IL-23 in the expansion and activation of Th17 cells (49). Th17 cells have been shown to protect against extracellular bacteria and to aid in the maintenance of the intestinal mucosal barrier (50–52). Increased IL-23 production in response to translocated bacteria could potentially lead to the activation and expansion of Th17 cells, promoting their infection and depletion. Indeed, Th17 cells are preferentially depleted from the gut during HIV-1 infection (53). Therapies targeting CD16+ monocyte production of proinflammatory cytokines, including IL-23, or limiting microbial translocation could reduce systemic inflammation in the context of HIV-1 infection.
Supplementary Material
ACKNOWLEDGMENTS
This work was supported by grants R01 DK088663 (to C.C.W.) and K24 AI074343 (to C.C.W.) from the NIDDK and NIAID. J.A.M. was supported by NIH/NCRR Colorado CTSI grant number TL1 RR025778 and by a NIAID training grant to the Integrated Department of Immunology at the University of Colorado, Denver (T32-AI07405).
We thank all of the subjects who participated in this study. We acknowledge the ClinImmune Flow Core for maintaining the flow cytometers.
Footnotes
Published ahead of print 25 September 2013
Supplemental material for this article may be found at http://dx.doi.org/10.1128/JVI.01767-13.
REFERENCES
- 1.Lane HC, Masur H, Edgar LC, Whalen G, Rook AH, Fauci AS. 1983. Abnormalities of B-cell activation and immunoregulation in patients with the acquired immunodeficiency syndrome. N. Engl. J. Med. 309:453–458 [DOI] [PubMed] [Google Scholar]
- 2.Giorgi JV, Detels R. 1989. T-cell subset alterations in HIV-infected homosexual men: NIAID Multicenter AIDS cohort study. Clin. Immunol. Immunopathol. 52:10–18 [DOI] [PubMed] [Google Scholar]
- 3.Prince HE, Jensen ER. 1991. Three-color cytofluorometric analysis of CD8 cell subsets in HIV-1 infection. J. Acquir. Immune Defic. Syndr. 4:1227–1232 [PubMed] [Google Scholar]
- 4.Ho DD, Neumann AU, Perelson AS, Chen W, Leonard JM, Markowitz M. 1995. Rapid turnover of plasma virions and CD4 lymphocytes in HIV-1 infection. Nature 373:123–126 [DOI] [PubMed] [Google Scholar]
- 5.Hellerstein M, Hanley MB, Cesar D, Siler S, Papageorgopoulos C, Wieder E, Schmidt D, Hoh R, Neese R, Macallan D, Deeks S, McCune JM. 1999. Directly measured kinetics of circulating T lymphocytes in normal and HIV-1-infected humans. Nat. Med. 5:83–89 [DOI] [PubMed] [Google Scholar]
- 6.Mohri H, Perelson AS, Tung K, Ribeiro RM, Ramratnam B, Markowitz M, Kost R, Hurley A, Weinberger L, Cesar D, Hellerstein MK, Ho DD. 2001. Increased turnover of T lymphocytes in HIV-1 infection and its reduction by antiretroviral therapy. J. Exp. Med. 194:1277–1287 [DOI] [PMC free article] [PubMed] [Google Scholar]
- 7.Breen EC, Rezai AR, Nakajima K, Beall GN, Mitsuyasu RT, Hirano T, Kishimoto T, Martinez-Maza O. 1990. Infection with HIV is associated with elevated IL-6 levels and production. J. Immunol. 144:480–484 [PubMed] [Google Scholar]
- 8.Aukrust P, Liabakk NB, Muller F, Lien E, Espevik T, Froland SS. 1994. Serum levels of tumor necrosis factor-alpha (TNF α) and soluble TNF receptors in human immunodeficiency virus type 1 infection—correlations to clinical, immunologic, and virologic parameters. J. Infect. Dis. 169:420–424 [DOI] [PubMed] [Google Scholar]
- 9.Deeks SG, Kitchen CM, Liu L, Guo H, Gascon R, Narvaez AB, Hunt P, Martin JN, Kahn JO, Levy J, McGrath MS, Hecht FM. 2004. Immune activation set point during early HIV infection predicts subsequent CD4+ T-cell changes independent of viral load. Blood 104:942–947 [DOI] [PubMed] [Google Scholar]
- 10.Leng Q, Borkow G, Weisman Z, Stein M, Kalinkovich A, Bentwich Z. 2001. Immune activation correlates better than HIV plasma viral load with CD4 T-cell decline during HIV infection. J. Acquir. Immune Defic. Syndr. 27:389–397 [DOI] [PubMed] [Google Scholar]
- 11.Wilson CM, Ellenberg JH, Douglas SD, Moscicki AB, Holland CA. 2004. CD8+CD38+ T cells but not HIV type 1 RNA viral load predict CD4+ T cell loss in a predominantly minority female HIV+ adolescent population. AIDS Res. Hum. Retroviruses 20:263–269 [DOI] [PubMed] [Google Scholar]
- 12.Giorgi JV, Hultin LE, McKeating JA, Johnson TD, Owens B, Jacobson LP, Shih R, Lewis J, Wiley DJ, Phair JP, Wolinsky SM, Detels R. 1999. Shorter survival in advanced human immunodeficiency virus type 1 infection is more closely associated with T lymphocyte activation than with plasma virus burden or virus chemokine coreceptor usage. J. Infect. Dis. 179:859–870 [DOI] [PubMed] [Google Scholar]
- 13.Giorgi JV, Liu Z, Hultin LE, Cumberland WG, Hennessey K, Detels R. 1993. Elevated levels of CD38+ CD8+ T cells in HIV infection add to the prognostic value of low CD4+ T cell levels: results of 6 years of follow-up. The Los Angeles Center, Multicenter AIDS Cohort Study. J. Acquir. Immune Defic. Syndr. 6:904–912 [PubMed] [Google Scholar]
- 14.Hazenberg MD, Otto SA, van Benthem BH, Roos MT, Coutinho RA, Lange JM, Hamann D, Prins M, Miedema F. 2003. Persistent immune activation in HIV-1 infection is associated with progression to AIDS. AIDS 17:1881–1888 [DOI] [PubMed] [Google Scholar]
- 15.Liu Z, Cumberland WG, Hultin LE, Prince HE, Detels R, Giorgi JV. 1997. Elevated CD38 antigen expression on CD8+ T cells is a stronger marker for the risk of chronic HIV disease progression to AIDS and death in the Multicenter AIDS Cohort Study than CD4+ cell count, soluble immune activation markers, or combinations of HLA-DR and CD38 expression. J. Acquir. Immune Defic. Syndr Hum. Retrovirol. 16:83–92 [DOI] [PubMed] [Google Scholar]
- 16.Brenchley JM, Price DA, Schacker TW, Asher TE, Silvestri G, Rao S, Kazzaz Z, Bornstein E, Lambotte O, Altmann D, Blazar BR, Rodriguez B, Teixeira-Johnson L, Landay A, Martin JN, Hecht FM, Picker LJ, Lederman MM, Deeks SG, Douek DC. 2006. Microbial translocation is a cause of systemic immune activation in chronic HIV infection. Nat. Med. 12:1365–1371 [DOI] [PubMed] [Google Scholar]
- 17.Jiang W, Lederman MM, Hunt P, Sieg SF, Haley K, Rodriguez B, Landay A, Martin J, Sinclair E, Asher AI, Deeks SG, Douek DC, Brenchley JM. 2009. Plasma levels of bacterial DNA correlate with immune activation and the magnitude of immune restoration in persons with antiretroviral-treated HIV infection. J. Infect. Dis. 199:1177–1185 [DOI] [PMC free article] [PubMed] [Google Scholar]
- 18.Lien E, Aukrust P, Sundan A, Muller F, Froland SS, Espevik T. 1998. Elevated levels of serum-soluble CD14 in human immunodeficiency virus type 1 (HIV-1) infection: correlation to disease progression and clinical events. Blood 92:2084–2092 [PubMed] [Google Scholar]
- 19.Sandler NG, Wand H, Roque A, Law M, Nason MC, Nixon DE, Pedersen C, Ruxrungtham K, Lewin SR, Emery S, Neaton JD, Brenchley JM, Deeks SG, Sereti I, Douek DC. 2011. Plasma levels of soluble CD14 independently predict mortality in HIV infection. J. Infect. Dis. 203:780–790 [DOI] [PMC free article] [PubMed] [Google Scholar]
- 20.Merlini E, Bai F, Bellistri GM, Tincati C, d'Arminio Monforte A, Marchetti G. 2011. Evidence for polymicrobic flora translocating in peripheral blood of HIV-infected patients with poor immune response to antiretroviral therapy. PLoS One 6:e18580. 10.1371/journal.pone.0018580 [DOI] [PMC free article] [PubMed] [Google Scholar]
- 21.Estes JD, Harris LD, Klatt NR, Tabb B, Pittaluga S, Paiardini M, Barclay GR, Smedley J, Pung R, Oliveira KM, Hirsch VM, Silvestri G, Douek DC, Miller CJ, Haase AT, Lifson J, Brenchley JM. 2010. Damaged intestinal epithelial integrity linked to microbial translocation in pathogenic simian immunodeficiency virus infections. PLoS Pathog. 6:e1001052. 10.1371/journal.ppat.1001052 [DOI] [PMC free article] [PubMed] [Google Scholar]
- 22.Fink LN, Zeuthen LH, Ferlazzo G, Frokiaer H. 2007. Human antigen-presenting cells respond differently to gut-derived probiotic bacteria but mediate similar strain-dependent NK and T cell activation. FEMS Immunol. Med. Microbiol. 51:535–546 [DOI] [PubMed] [Google Scholar]
- 23.Hart AL, Lammers K, Brigidi P, Vitali B, Rizzello F, Gionchetti P, Campieri M, Kamm MA, Knight SC, Stagg AJ. 2004. Modulation of human dendritic cell phenotype and function by probiotic bacteria. Gut 53:1602–1609 [DOI] [PMC free article] [PubMed] [Google Scholar]
- 24.Hessle C, Andersson B, Wold AE. 2000. Gram-positive bacteria are potent inducers of monocytic interleukin-12 (IL-12) while gram-negative bacteria preferentially stimulate IL-10 production. Infect. Immun. 68:3581–3586 [DOI] [PMC free article] [PubMed] [Google Scholar]
- 25.Hessle CC, Andersson B, Wold AE. 2005. Gram-positive and Gram-negative bacteria elicit different patterns of pro-inflammatory cytokines in human monocytes. Cytokine 30:311–318 [DOI] [PubMed] [Google Scholar]
- 26.Karlsson H, Larsson P, Wold AE, Rudin A. 2004. Pattern of cytokine responses to gram-positive and gram-negative commensal bacteria is profoundly changed when monocytes differentiate into dendritic cells. Infect. Immun. 72:2671–2678 [DOI] [PMC free article] [PubMed] [Google Scholar]
- 27.Manuzak J, Dillon S, Wilson C. 2012. Differential interleukin-10 (IL-10) and IL-23 production by human blood monocytes and dendritic cells in response to commensal enteric bacteria. Clin. Vaccine Immunol. 19:1207–1217 [DOI] [PMC free article] [PubMed] [Google Scholar]
- 28.Barron MA, Blyveis N, Palmer BE, MaWhinney S, Wilson CC. 2003. Influence of plasma viremia on defects in number and immunophenotype of blood dendritic cell subsets in human immunodeficiency virus 1-infected individuals. J. Infect. Dis. 187:26–37 [DOI] [PubMed] [Google Scholar]
- 29.Dillon SM, Robertson KB, Pan SC, Mawhinney S, Meditz AL, Folkvord JM, Connick E, McCarter MD, Wilson CC. 2008. Plasmacytoid and myeloid dendritic cells with a partial activation phenotype accumulate in lymphoid tissue during asymptomatic chronic HIV-1 infection. J. Acquir. Immune Defic. Syndr. 48:1–12 [DOI] [PMC free article] [PubMed] [Google Scholar]
- 30.Almeida M, Cordero M, Almeida J, Orfao A. 2005. Different subsets of peripheral blood dendritic cells show distinct phenotypic and functional abnormalities in HIV-1 infection. AIDS 19:261–271 [PubMed] [Google Scholar]
- 31.Donaghy H, Gazzard B, Gotch F, Patterson S. 2003. Dysfunction and infection of freshly isolated blood myeloid and plasmacytoid dendritic cells in patients infected with HIV-1. Blood 101:4505–4511 [DOI] [PubMed] [Google Scholar]
- 32.Allen JB, Wong HL, Guyre PM, Simon GL, Wahl SM. 1991. Association of circulating receptor FcγRIII-positive monocytes in AIDS patients with elevated levels of transforming growth factor-beta. J. Clin. Invest. 87:1773–1779 [DOI] [PMC free article] [PubMed] [Google Scholar]
- 33.Thieblemont N, Weiss L, Sadeghi HM, Estcourt C, Haeffner-Cavaillon N. 1995. CD14low CD16high: a cytokine-producing monocyte subset which expands during human immunodeficiency virus infection. Eur. J. Immunol. 25:3418–3424 [DOI] [PubMed] [Google Scholar]
- 34.Valdez H, Lederman MM. 1997. Cytokines and cytokine therapies in HIV infection. AIDS Clin. Rev. 1997–1998:187–228 [PubMed] [Google Scholar]
- 35.Lester RT, Yao XD, Ball TB, McKinnon LR, Omange WR, Kaul R, Wachihi C, Jaoko W, Rosenthal KL, Plummer FA. 2009. HIV-1 RNA dysregulates the natural TLR response to subclinical endotoxemia in Kenyan female sex-workers. PLoS One 4:e5644. 10.1371/journal.pone.0005644 [DOI] [PMC free article] [PubMed] [Google Scholar]
- 36.Mureith MW, Chang JJ, Lifson JD, Ndung'u T, Altfeld M. 2010. Exposure to HIV-1-encoded Toll-like receptor 8 ligands enhances monocyte response to microbial encoded Toll-like receptor 2/4 ligands. AIDS 24:1841–1848 [DOI] [PMC free article] [PubMed] [Google Scholar]
- 37.Dillon SM, Rogers LM, Howe R, Hostetler LA, Buhrman J, McCarter MD, Wilson CC. 2010. Human intestinal lamina propria CD1c+ dendritic cells display an activated phenotype at steady state and produce IL-23 in response to TLR7/8 stimulation. J. Immunol. 184:6612–6621 [DOI] [PubMed] [Google Scholar]
- 38.Dillon SM, Friedlander LJ, Rogers LM, Meditz AL, Folkvord JM, Connick E, McCarter MD, Wilson CC. 2011. Blood myeloid dendritic cells from HIV-1-infected individuals display a proapoptotic profile characterized by decreased Bcl-2 levels and by caspase-3+ frequencies that are associated with levels of plasma viremia and T cell activation in an exploratory study. J. Virol. 85:397–409 [DOI] [PMC free article] [PubMed] [Google Scholar]
- 39.Han J, Wang B, Han N, Zhao Y, Song C, Feng X, Mao Y, Zhang F, Zhao H, Zeng H. 2009. CD14high CD16+ rather than CD14low CD16+ monocytes correlate with disease progression in chronic HIV-infected patients. J. Acquir. Immune Defic. Syndr. 52:553–559 [DOI] [PubMed] [Google Scholar]
- 40.Messele T, Brouwer M, Girma M, Fontanet AL, Miedema F, Hamann D, Rinke de Wit TF. 2001. Plasma levels of viro-immunological markers in HIV-infected and non-infected Ethiopians: correlation with cell surface activation markers. Clin. Immunol. 98:212–219 [DOI] [PubMed] [Google Scholar]
- 41.Louis S, Dutertre CA, Vimeux L, Fery L, Henno L, Diocou S, Kahi S, Deveau C, Meyer L, Goujard C, Hosmalin A. 2010. IL-23 and IL-12p70 production by monocytes and dendritic cells in primary HIV-1 infection. J. Leukoc. Biol. 87:645–653 [DOI] [PubMed] [Google Scholar]
- 42.Heggelund L, Muller F, Lien E, Yndestad A, Ueland T, Kristiansen KI, Espevik T, Aukrust P, Froland SS. 2004. Increased expression of toll-like receptor 2 on monocytes in HIV infection: possible roles in inflammation and viral replication. Clin. Infect. Dis. 39:264–269 [DOI] [PubMed] [Google Scholar]
- 43.Hernandez JC, Stevenson M, Latz E, Urcuqui-Inchima S. 2012. HIV type 1 infection up-regulates TLR2 and TLR4 expression and function in vivo and in vitro. AIDS Res. Hum. Retroviruses 28:1313–1328 [DOI] [PMC free article] [PubMed] [Google Scholar]
- 44.Trinchieri G, Sher A. 2007. Cooperation of Toll-like receptor signals in innate immune defence. Nat. Rev. Immunol. 7:179–190 [DOI] [PubMed] [Google Scholar]
- 45.Hintzen RQ, de Jong R, Hack CE, Chamuleau M, de Vries EF, ten Berge IJ, Borst J, van Lier RA. 1991. A soluble form of the human T cell differentiation antigen CD27 is released after triggering of the TCR/CD3 complex. J. Immunol. 147:29–35 [PubMed] [Google Scholar]
- 46.van Oers MH, Pals ST, Evers LM, van der Schoot CE, Koopman G, Bonfrer JM, Hintzen RQ, von dem Borne AE, van Lier RA. 1993. Expression and release of CD27 in human B-cell malignancies. Blood 82:3430–3436 [PubMed] [Google Scholar]
- 47.Widney D, Gundapp G, Said JW, van der Meijden M, Bonavida B, Demidem A, Trevisan C, Taylor J, Detels R, Martinez-Maza O. 1999. Aberrant expression of CD27 and soluble CD27 (sCD27) in HIV infection and in AIDS-associated lymphoma. Clin. Immunol. 93:114–123 [DOI] [PubMed] [Google Scholar]
- 48.Bixler SL, Sandler NG, Douek DC, Mattapallil JJ. 2013. Suppressed Th17 levels correlate with elevated PIAS3, SHP2, and SOCS3 expression in CD4 T cells during acute simian immunodeficiency virus infection. J. Virol. 87:7093–7101 [DOI] [PMC free article] [PubMed] [Google Scholar]
- 49.Langrish CL, Chen Y, Blumenschein WM, Mattson J, Basham B, Sedgwick JD, McClanahan T, Kastelein RA, Cua DJ. 2005. IL-23 drives a pathogenic T cell population that induces autoimmune inflammation. J. Exp. Med. 201:233–240 [DOI] [PMC free article] [PubMed] [Google Scholar]
- 50.Kinugasa T, Sakaguchi T, Gu X, Reinecker HC. 2000. Claudins regulate the intestinal barrier in response to immune mediators. Gastroenterology 118:1001–1011 [DOI] [PubMed] [Google Scholar]
- 51.Liang SC, Tan XY, Luxenberg DP, Karim R, Dunussi-Joannopoulos K, Collins M, Fouser LA. 2006. Interleukin (IL)-22 and IL-17 are coexpressed by Th17 cells and cooperatively enhance expression of antimicrobial peptides. J. Exp. Med. 203:2271–2279 [DOI] [PMC free article] [PubMed] [Google Scholar]
- 52.Zheng Y, Valdez PA, Danilenko DM, Hu Y, Sa SM, Gong Q, Abbas AR, Modrusan Z, Ghilardi N, de Sauvage FJ, Ouyang W. 2008. Interleukin-22 mediates early host defense against attaching and effacing bacterial pathogens. Nat. Med. 14:282–289 [DOI] [PubMed] [Google Scholar]
- 53.Brenchley JM, Paiardini M, Knox KS, Asher AI, Cervasi B, Asher TE, Scheinberg P, Price DA, Hage CA, Kholi LM, Khoruts A, Frank I, Else J, Schacker T, Silvestri G, Douek DC. 2008. Differential Th17 CD4 T-cell depletion in pathogenic and nonpathogenic lentiviral infections. Blood 112:2826–2835 [DOI] [PMC free article] [PubMed] [Google Scholar]
Associated Data
This section collects any data citations, data availability statements, or supplementary materials included in this article.