Abstract
Purpose: The treatment of ventral hernias (VH) has been a challenging problem for medical care. Repair of these hernias is fraught with failure; recurrence rates ranging from 24% to 43% have been reported, even with the use of biocompatible mesh. Currently, computed tomography (CT) is used to guide intervention through expert, but qualitative, clinical judgments, notably, quantitative metrics based on image-processing are not used. The authors propose that image segmentation methods to capture the three-dimensional structure of the abdominal wall and its abnormalities will provide a foundation on which to measure geometric properties of hernias and surrounding tissues and, therefore, to optimize intervention.
Methods: In this study with 20 clinically acquired CT scans on postoperative patients, the authors demonstrated a novel approach to geometric classification of the abdominal. The authors’ approach uses a texture analysis based on Gabor filters to extract feature vectors and follows a fuzzy c-means clustering method to estimate voxelwise probability memberships for eight clusters. The memberships estimated from the texture analysis are helpful to identify anatomical structures with inhomogeneous intensities. The membership was used to guide the level set evolution, as well as to derive an initial start close to the abdominal wall.
Results: Segmentation results on abdominal walls were both quantitatively and qualitatively validated with surface errors based on manually labeled ground truth. Using texture, mean surface errors for the outer surface of the abdominal wall were less than 2 mm, with 91% of the outer surface less than 5 mm away from the manual tracings; errors were significantly greater (2–5 mm) for methods that did not use the texture.
Conclusions: The authors’ approach establishes a baseline for characterizing the abdominal wall for improving VH care. Inherent texture patterns in CT scans are helpful to the tissue classification, and texture analysis can improve the level set segmentation around the abdominal region.
Keywords: ventral hernia, abdominal wall, texture analysis, level set, segmentation
INTRODUCTION
Ventral hernias (VH) include primary abdominal wall defects (e.g., umbilical hernias) and acquired incisional defects resulting from previous abdominal operations. The management of ventral hernias remains a challenging problem for primary care physicians, surgeons, and patients. VHs occur in up to 28% of patients undergoing abdominal operations even in optimal conditions.1, 2 Repair of these hernias is fraught with failure; recurrence rates ranging from 24% to 43% are reported, even with the use of biocompatible mesh.3 Recurrence of previously repaired VHs increases costs and morbidity to patients and can require multiple repairs. The common clinical problem of VH and wide variation in care present a unique opportunity for improvement in classification and outcomes. For each 1% reduction in recurrence of VH after repair, an estimated annual cost savings of $32 million could be realized.4
Computed tomography (CT) is used to make qualitative clinical judgments about a particular patient's hernia for treatment and prognosis. However, the only quantitative metric currently in use is the transverse dimension of the hernia defect. We posit that the CT image obtained from these studies is underutilized and provides a potentially rich—and automated—means of better characterizing VH. Three-dimensional structural measurements based on computational tools have been the subject of extensive study in the brain in the search for biomarkers for clinical development of therapeutics,5 and have been targeted for therapeutic modifications and as surrogate endpoints in clinical trials (e.g., Refs. 6 and 7). These methods have yet to be applied to VH.
Image segmentation methods to capture the three-dimensional VH-related anatomical structures could provide a foundation on which to measure geometric properties of hernias and surrounding tissues. For example, given the segmentation, we could numerically locate the hernia with respect to anatomical landmarks, compute the area of disruption and volume of herniated tissue, estimate the displacement and volumetric changes in abutting wall structures versus change at distant relatively normal tissues, and thus help surgeons to classify the VHs and optimize the treatment delivery. In a parallel study,8 we consider a manual labeling protocol that uses the normal appearing anterior abdominal wall and the herniated region to describe the shape-related characteristics of VH, and uses fascial boundaries and bony landmarks as the features to extract the location-related characteristics. Herein, we target reproducible automated segmentation of the outer surface of anterior abdominal wall.
There are few studies involving the segmentation of abdominal wall. Feng et al. used a 3D flipping-free deformable model to register the inner boundary of the wall for ease of segmentation and visualization of abdominal organs.9 Zhu et al. provided an interactive approach to remove the entire abdominal wall to reduce the sliding motion effect on the non-rigid registration of abdominal images.10 Yao et al. segmented the outer surface of the abdominal wall to separate subcutaneous and visceral adipose tissue by fuzzy c-means clustering and active contour models.11 Among these studies, the abdominal wall was extracted to provide a better access to other abdominal structures, but not considered as the main entity for precise quantitative analysis. However, for our purpose of large-scale VH classification and characterization, a fully automated approach is required to provide the segmentation of a smooth surface of the anterior abdominal wall accurately and reproducibly. Level set image processing methods can be ideally adapted to finding contours between objects of different intensities in the presence of noise, artifacts, and disruption through the use of tuned regularization criteria.12 Abnormal hernia geometries and various image artifacts can make the voxel-wise intensity information misleading, and thus cause the segmentation of the abdominal wall to be challenging (Fig. 1). On the other hand, the intratissue variability appears to form repeated patterns within local regions. These local textures are visually distinguishable between different tissues, e.g., adipose tissue looks grainy, whereas muscles and bones are dense. This poses an interesting question: can texture analysis improve the level set segmentation within the abdominal region, especially for the segmentation of anterior abdominal wall?
Figure 1.
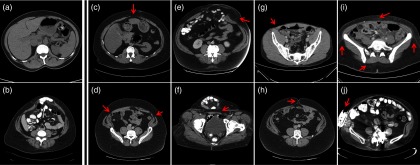
Illustration of the image qualities in Ventral Hernia CT. (a) and (b) demonstrate CT scans with low artifacts for normal abdominal wall and for herniated region, respectively. (c)–(j) illustrate challenges from the segmentation of anterior abdominal wall, where red arrows indicate the challenging regions in each scenario. (c) The linea alba is thin and of lower intensity than normal. (d) The linea semilunaris is thin and of lower intensity than normal. (e) At the herniated region, the abdominal wall is stretched and can be barely seen. (f) The hernia volume is folded, which introduces a large curvature. (g) The patient is slim, which makes it hard to differentiate the muscles from the skin. (h) The umbilicus can interfere with the smooth contour of the abdominal wall. (i) Speckles in the fat are of similar intensity with muscles. (j) Metal implants result in streaking artifacts in CT scans.
Texture analysis has been a long studied technique in computer vision,13 and has been applied to medical imaging.14 Statistical methods (e.g., cooccurrence matrices15, 16) are used if the texture is considered as the spatial distribution of intensities, where second-order statistics of the image is estimated. Geometrical methods (e.g., Voronoi tessellation17) identify building elements for texture, and then assess the statistical properties of these elements, or extract the placement rule that characterizes the texture. Model-based methods (e.g., Markov random fields,18 fractals19) establish image models that capture essential qualities of texture for ease of texture description and synthesis. Filter-based methods extract features in frequency domain by passing images through multichannel filter operators. Gabor filters, for example, are capable of extracting frequencies and orientations at multiple scales from images as texture features for classification and segmentation.20, 21, 22, 23, 24 Several studies have integrated texture analysis with level set techniques,25, 26, 27 among which Paragios et al. proposed a sophisticated geodesic active regions framework that combines both boundary- and region-based modules extracted from texture analysis into one level set objective function for supervised texture segmentation28—these studies mainly targeted partitioning regular textures (wood, fabric, zebra, leopard, etc.). Here, we assess the feasibility of the perceived local textures (as an alternative of/in addition to the intensity values) to drive more effective level set segmentation for anterior abdominal wall. We propose a direct approach to use texture analysis for level set segmentation. In particular, we learn texture features by Gabor filters, cluster the features into voxelwise probability membership, and guide level set evolution by the local differences of the membership in place of original intensity values. Segmentation results of the proposed approach are compared against the methods only using intensity information.
We note that our interest in the abdominal wall is motivated by our desire to study VHs. Therefore, our population of interest includes subjects with poor imaging contrast, abnormal anatomy, metallic implants, etc. The existence of VHs greatly challenges the segmentation of abdominal wall (Fig. 1). We are evaluating the performance of our image processing methods in the context of these considerations to preserve robustness. These issues motivate the potential clinical impact of this work.
THEORY
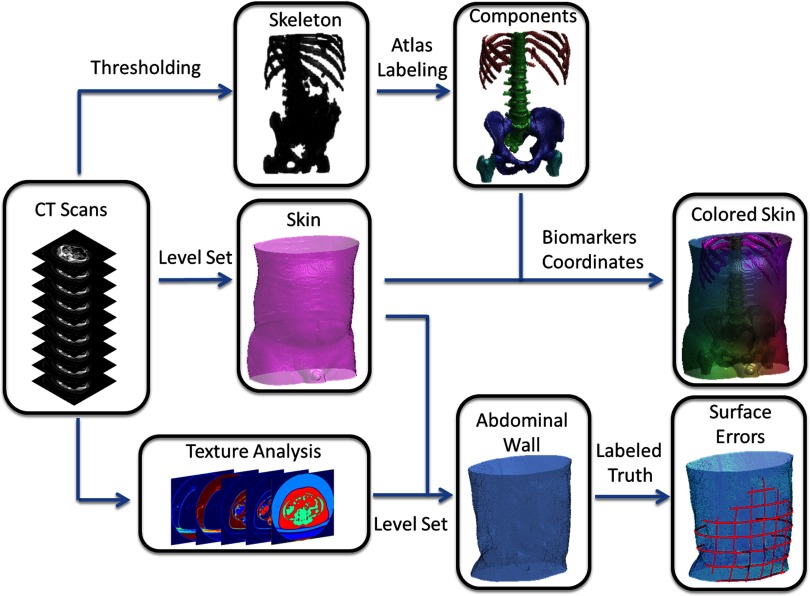
Herein, we describe the details on the algorithm and implementation of the proposed texture-segmentation of abdominal wall on ventral CT scans with suspected VH. We provide brief description of the segmentation of bony skeleton and skin surface as other essential structures for VH characterization (Fig. 2).
Figure 2.
Flowchart of the proposed method. The target image was affine-registered to a probabilistic atlas in terms of the extracted high intensity structures. Specific types of bony structures were then identified by transferring labels from the atlas to the target image based on a Bayesian framework, which incorporated the position information from the atlas and the intensity distribution for each label. After the skin is segmented by a curvature-constrained level set method, the two anterior iliac crests and all visible ribs are selected as landmarks, based on which three coordinates were created. The skin is then colored with RGB values converted by the normalized shortest distances to the biomarkers. Texture analysis followed by a fuzzy c-means procedure was used to estimate a voxel-wise probabilistic membership. An edge map was derived from the membership to guide the level set evolution, while the hard segmentation of muscles from the membership combined with the segmented skin was used to derive the initial start. Ground truth was manually labeled for the abdominal wall to calculate the surface errors of automatic segmentation.
ALGORITHM
The anterior abdominal wall is formed by muscles (e.g., rectus, obliques) and fascial connections (e.g., linea alba, linea semilunaris) encompassing the abdominal cavity. Given the distinguishable intensities between muscles and adipose tissue in CT scans, an intuitive approach could be to extract the muscles by intensity thresholding, and then use a series of appropriate morphological operations to obtain the whole abdomen region surrounded by the muscles. However, three facts can greatly challenge its reproducibility: (1) Skin can be difficult to eliminate due to variable thicknesses and variable distances to the muscles around the body across different subjects, given overlapping intensity distribution with muscles; (2) Muscles are greatly stretched in herniated regions and have much lower intensities than usual, which often results in gaps in muscle walls after thresholding; (3) Selection of morphological operators becomes challenging to construct a smooth abdominal region from thresholded images for the existence of imaging artifacts, especially in speckled adipose tissue.
Level set approaches, on the other hand, are more generally applicable with well-designed evolution functions. In the level set approach,29 an evolving surface is embedded as the zero level set of a higher dimensional level set function Φ(x, t), and propagates implicitly through the temporal evolution of Φ in terms of a given speed function F. Φ(x, t) is defined as signed distance function to the evolving surface with negative value inside the surface and positive outside. The speed function, which can be spatially varying, is usually determined by advection forces (e.g., constant inward or outward motion), intrinsic geometry (e.g., mean curvature), and image attributes (e.g., intensity, and its gradient). The temporal evolution of the level set function is usually described in the following form:
| (1) |
where |∇Φ| represents the normalized gradient of the level set function.
Region-based level set methods,30, 31, 32 which rely on the global homogeneity of spatial localized features and properties, are not well-suited to our problem because the abdominal region contains not only muscles but also visceral adipose tissue, bones, and organs with and/or without contrast. Edge-based approaches,33, 34, 35 which rely on the local differences in the image, seem a reasonable approach to start with, to extract a continuous smooth outer surface of the anterior abdominal wall, although challenges (Fig. 1) remain to be dealt with.Here, we construct an evolution function that follows the Geodesic Active Contours (GAC) model:34
| (2) |
| (3) |
| (4) |
| (5) |
| (6) |
where g is usually called edge-stopping function, proposed by Malladi et al.36 to stop the level set evolution at the boundaries of objects, which can be typically measured for an image I in the form as follows:
| (7) |
κ represents the local curvature of the signed distance function
| (8) |
In the evolution function shown in Eq. 2, Fballoon acts as an inward/outward normal pressure force, also known as balloon force, to speed up the evolution process. Fcurv is a curvature-constraint term to smooth the level set evolution adjusted by edge stopping function. Fedge is a term to reinforce the edge-preserving capability, especially under the balloon force. We append a regularization term Freg proposed by Li et al.37 to enable the level set evolution free from additional reinitialization. The weights associated with the four terms can be customized for specific purposes.
Local optimum and boundary leaking problem are the two biggest issues for edge-based level set methods. Particularly, the evolution of edge-based level set is likely to be stuck at noisy regions away from the target boundary, or on the contrary, pass through the target boundary where the contrast is not high enough. Both cases can be present in our VH data. This leaves the edge stopping function and the initial start of level set critical to the segmentation results.
The edge stopping function estimates the edginess across the image to guide the proceeding and stopping of the evolving surface. Regarding the image of edge stopping function as an edge map, we expect it to be clean and high-contrast, while the edge map derived from the original image can barely satisfy our expectation. Nonlinearly smoothing the image by an anisotropic filter, which averages each voxel with local voxels of similar intensity, can be an option to reduce the noise in an image while preserving the edges between regions. Yao et al.11 proposed to classify the body into adipose tissue and nonadipose tissue by fuzzy c-means (FCM) clustering on smoothed images, and derived the edge map by the probabilistic membership of the two clusters instead of intensity. However, these intensity-based efforts may be less effective when the intratissue variability is nearly on par with the intertissue variability, which is not uncommon in VH CT scans.
We focus on textures. Adipose tissue is embedded with scattered speckles and is also distinguishable from muscle groups constructed with muscle fibers, and solid bony structures. In addition, streaking artifacts are more severe in adipose tissue than in muscles and bones. Therefore, we consider texture analysis a potential tool for tissue classification around the abdominal region. The frequency- and orientation-selective properties of a Gabor filter provides us a multichannel approach to extract texture features at multiple scales. A Gabor filter can be considered as the product of a Gaussian envelope and a sinusoid function.38 For our specific use, we use a 3D Gabor filter in the form of
| (9) |
where λ and ϕ are the wavelength and phase offset of the sinusoid function, respectively, σ is the standard deviation of the spatially isotropic Gaussian envelop, specified as a dependent variable of λ (i.e., 0.56λ), and (x′, y′, z′)T are the rotated spatial coordinates of Gaussian envelope:
| (10) |
where θ denotes the orientation of the Gabor filter in xy plane. Note that we only take the in-plane texture features into consideration by the setting of sinusoid function in Eq. 9 and coordinates rotation in Eq. 10.
Multiple filtered images can be obtained by convolving the original image with a bank of Gabor filters. In practice, we set the phase offset as zero, choose [0°, 45°, 90°, 135°] as four possible values for orientations, and follows a frequency selection scheme proposed by Zhang et al.,39 which emphasizes on intermediate frequency bands. Suppose the size of the cross-sectional image is N × N, the selected frequencies F can be estimated as follows:
| (11) |
Filtered images are converted into feature images by a nonlinear transformation, ψ(t) = tanh (αt) with α set as 1, where the sinusoidal modulations in the filtered images are transformed into square modulations, or in other words, the features are enhanced.22 The stack of all these feature images forms a feature vector for each voxel of the original image, which enables us to use FCM clustering for classification. Here, we empirically set the number of clusters as eight, and obtain the probabilistic membership for these eight clusters as soft segmentation (Fig. 3). We define Mi as the probabilistic membership for the ith cluster, and Nc as the number of clusters, and characterize the edge map in terms of the texture:
| (12) |
where |∇Mi|2 indicates the local difference based on each texture membership as opposed to intensity defined in Eq. 7 so that edges between distinct textures can be enhanced. Note that we sum over all probabilistic membership to ensure that all texturewise differences are captured.
Figure 3.
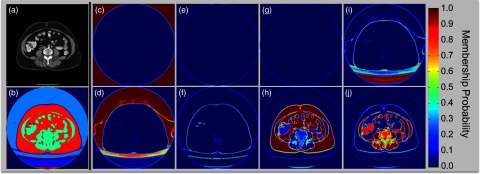
Proposed texture analysis. (a) Original CT image; (b) Hard segmentation of different structures; (c)–(j) illustrate the membership probability for each of the eight clusters, which are estimated from fuzzy c-means clustering on texture features extracted by Gabor filters. Within each cluster, the probability value indicates partial membership to the cluster. Note that fat tissue and muscles can be identified from (h) and (j), respectively. (b) is constructed by the modes of among the eight clusters for all voxels, where we note that the muscles and fat tissue are effectively partitioned for assistance of the following edge-based level set segmentation.
The contrast of the edge map is enhanced by an approximated Heaviside function for ease of edge-based level set, where the edge map is expected to be almost zero at abdominal walls, while approaching one for adipose tissue. Comparing to other three methods using (1) original image; (2) smoothed image; (3) intensity clustering, the edge map derived from the texture analysis provides better contrast, i.e., strengthened wall boundaries with reasonably cleared adipose, which enables the level set to evolve right at the abdominal wall, rather than get stuck by nonmuscle structures or break into the abdominal cavity (Fig. 4).
Figure 4.
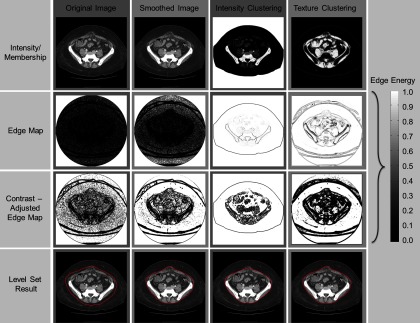
Edge map and level set results of four methods. The four columns illustrate the results on the original image, the image smoothed by an anisotropic filter, the membership estimated by an intensity-based fuzzy c-means clustering, and the membership estimated by a texture-based fuzzy c-means clustering, respectively. The first row shows the intensity images (first two columns) and membership images (last two columns). The second row shows the edge maps directly derived from the images of the first row. The third row illustrates the contrast-adjusted edge maps for ease of level set evolution. Note that the level set front tends to proceed at brighter regions, and to stop at darker regions on the edge map. The fourth row presents the level set results (represented with red contours) on anterior abdominal wall segmentation for four methods with the same parameters.
We note that within the hard segmentation [Fig. 3b], i.e., the voxel-wise mode cluster member of the soft segmentation, muscles are quite well-distinguishable from skin in terms of texture clusters as opposed to the scenario of intensity thresholding, which leaves a good opportunity to derive an initial start of level set evolving surface close enough to the abdominal wall. In particular, we start with the largest component of the hard-segmented muscles (Fig. 5, 1st col), and filled the holes within the surface 30 voxels outside the zero level set surface of the muscle (Fig. 5, 2nd col). Then from the surface of the hole-filled volume, we go inside by 20 voxels, and eliminate the regions outside the segmented skin surface. The surface of the rest volume (Fig. 5, 3rd col) is considered as our initial start for the following level set evolution (Fig. 5, 4th–6th col) for abdominal wall segmentation. Note that all the distances discussed here are in the unit of voxel in 3D.
Figure 5.
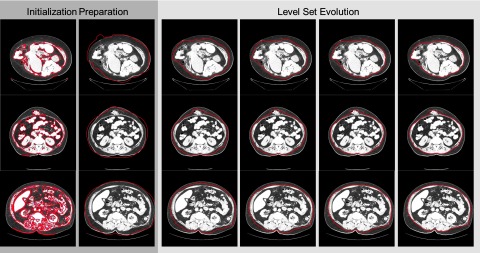
Process of level set segmentation on anterior abdominal wall for three subjects. The red contours indicate the current segmentation for each process. The first two columns show the preparation for the initial start. The last four columns illustrate the iterations of level set evolution. Note the third column demonstrates the initial start of the level set segmentation.
IMPLEMENTATION
Detailed parameters during the implementation for the segmentation of abdominal wall not covered above are given as follows.
We enhance the contrast of the edge map from the proposed texture analysis by an approximated Heaviside function
| (13) |
where x0 is the threshold and ɛ is a small number which determines the steepness of the Heaviside function. For our method after texture clustering, we assign x0 and ɛ to be 0.995 and 0.001, respectively.
Weighting parameters are specified as 5, 50, 5, and 10 for the four terms in Eq. 2, i.e., balloon force, curvature-constraint, edge-preserving, and regularization, respectively. We run the level set evolution on the whole volume for 500 iterations.
The other three methods we test for comparison share the same weighting parameters, iteration number, and the same initial start as our texture clustering method, which leaves the difference only on the edge maps. Specifically,
Original image: We measure the edge map from the raw CT image, and enhance its contrast by applying Eq. 13 with x0 = 0.005 and ɛ = 0.001.
Smoothed image: We smooth the raw CT image with an anisotropic filter via SUSAN (Smallest Univalue Segment Assimilating Nucleus)40 in FSL (FMRIB Software Library, University of Oxford, Oxford, UK). We specify the anisotropic filter a spatial size of 10 mm, and a brightness threshold of 20, under which is considered as noise to eliminate. The edge map measured from the smoothed image is enhanced by applying Eq. 13 with x0 = 0.005 and ɛ = 0.001.
Intensity clustering: We cluster the intensity of the smoothed image into adipose and nonadipose regions by FCM following the two-step procedure described in Ref. 11. The edge map derived from the probabilistic membership of the two clusters is enhanced by applying Eq. 13 with x0 = 0.995 and ɛ = 0.001.
OTHER STRUCTURES
Bony skeleton and skin surface are also essential structures for VH characterization; however, our approaches for the segmentation of these structures are not directly relevant to the texture-features in the level set segmentation. Therefore, only brief descriptions of our approaches are provided as follows.
We consider parts of the bony skeleton as natural structures to derive landmarks for VH localization.8 Precise surface extraction of bones is beyond our major concern. Instead, we separate the whole volume into five partitions-–(1) background; (2) pelvis; (3) spinal vertebrae; (4) femurs; (5) ribs, and any other bones surrounding the spine (e.g., sternum, scapula, etc.). We use an atlas-based segmentation method to partition the bony skeleton. Briefly, we first align patients’ poses in CT scans with a preconstructed atlas in terms of the high intensity (>200 HUs) anatomical structures by affine registration using FLIRT (FMRIB's Linear Image Registration Tool,41 University of Oxford, Oxford, UK). Then we combine the empirical intensity distribution of each structure (as the generic likelihood) with the position probability obtained from the smoothed atlas (as the prior) into a Bayesian framework so that the bony structures not perfectly aligned but close to the atlas may still be captured by its inherent intensity, while nonbone structures hit by the registration can be cleared out.
Skin surface can be considered as a starting point for further imaging segmentation (i.e., the abdominal wall) inside human body, while skin segmentation, or body extraction in CT scans, can be reduced to the problem of removing the table and sheet after intensity thresholding since the majority of the human body (except for the air) in CT scans is of intensity larger than −250 HUs. Intensity clustering is a simple and efficient approach for body extraction;11 however, there are cases that patients touch, or even lay right on the table without any sheet in between so that the table can be connected with the human body after intensity clustering, where we believe level set with curvature constraint is a more practical option. Briefly, we construct the evolution function with an intensity constraint (−250 HUs–50 HUs) to guarantee the inclusion of the adipose tissue (usually −100–−50 HUs) while excluding the background (around −1000 HUs), and a curvature constraint to smooth out the surface temporarily stuck at the table edge during the level set evolution. We run the level set evolution on every slice of the volume for 400 iterations, initializing with a box four pixels into the image boundary. After each iteration, we update the Φ values within a narrowband of 2 pixels around the zero level set, and recalculate the signed distance function based on the largest component of the regions with nonpositive Φ values as an approximation of a reinitialization process.
Based on the segmented bony skeleton and skin surface, we calculate putative patient-specific coordinates on the purpose of a robust localization metric across subjects. We consider the left and right iliac crests (the most anterior point on each side of iliac spines) extracted from pelvis, in addition to all the rib bones as three groups of landmarks, to which we calculate the shortest spatial distances to construct three coordinates.
METHODS AND RESULTS
Retrospective, clinically acquired CT data on 20 patients with suspected VHs were acquired in anonymous form under institutional review board supervision. The including criteria were to select patients having abdominal scans that covers from xiphoid process superiorly to pubic symphysis inferiorly. Large variations were seen among the volumes in voxels (512 × 512 × 90 ∼ 512 × 512 × 200) and resolution (0.6 × 0.6 × 5 mm ∼ 1.0 × 1.0 × 3 mm). Average field of view in millimeters was approximately 400 × 400 × 500 mm.
The ground truth of abdominal wall was created by a research associate, who was trained on a manual labeling protocol8 for hernia-related anatomical structures using the Medical Image Processing And Visualization (MIPAV) (Ref. 42) software (National Institutes of Health, Bethesda, MD) and a high resolution tablet input (Wacom, Tokyo, Japan) on a 64-bit Linux workstation. The entire herniated region was labeled volumetrically, while the normal abdominal wall was labeled on axial and sagittal slices approximately spaced every 5 cm for efficiency. We applied thin-plate spline interpolation to the label meshes of abdominal wall combined with the hernia label, to provide the surface of anterior abdominal wall, as well as the outer surface of herniated region and normal wall as two subsets for validation. We note that the choice of manual validation protocol was designed to yield an acceptable accuracy of anatomical labeling within 1 h of manual time per patient. We have found that thin plate spline interpolation in the normal wall provide resolution on par ( ±2mm) with manual tracing with a 5 mm gap. The curvature within the herniated regions exhibits much higher spatial resolution, so every slice was labeled.
Bony structures, skins, and anterior abdominal walls were extracted from the 20 selected scans with our proposed automated segmentation methods. Here, the bony structures are regarded as visual references, while skin segmentations serve as the loose outer boundaries of abdominal walls. For abdominal wall segmentation, we integrated the edge map and the initial start derived from the texture analysis into the baseline GAC level set model. For comparison, we tested three other methods using only intensity values using the same GAC model, with the same parameters in the level set evolution function, and for simplicity, starting from the same initial surface provided by our texture analysis. The segmentation results were validated against the ground truth, where surface distances were calculated from every point of the interpolated abdominal walls to the automatically segmented walls.
Using texture, median surface errors were ±1 mm for the abdominal wall and <5 mm for the hernia; errors were significantly greater (2–5 mm) for methods that did not use the texture (Fig. 6, 1st row). The mean surface errors across 20 subjects were 1.87 ± 0.72 mm over the anterior abdominal wall using our texture-integrated method, which was statistically significantly lower (Δ = −0.78, p < 0.05) than the best case of the three intensity-based methods in terms of paired Wilcoxon signed rank test (Fig. 6, 2nd row). Figure 6 and Table 1 provide more detailed error metrics on four tested methods.
Figure 6.
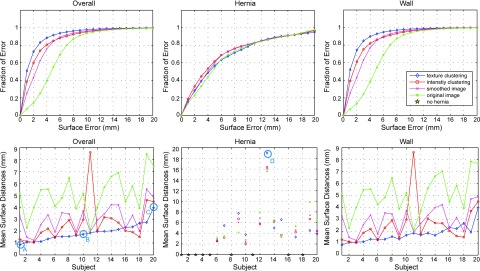
Quantitative results of anterior abdominal wall segmentation. Four level set methods based on different edge maps (1. Green star: baseline original image; 2. Magenta cross: smoothing image; 3. Red circle: intensity clustering; 4. Blue diamond: texture clustering) are evaluated in terms of surfaces distances. The first column denotes the error metrics for the whole wall, while the second and the third column focuses on the hernia region and the normal wall region, respectively. The top row illustrates the cumulative fraction of region based on increasing 3D surface distance error between interpolated wall from manually labeled ground truth and the automatic segmentation. The bottom row shows the error bar of mean surface distances. The subject indices are sorted in terms of the mean of the overall mean surface distances of the texture clustering method. Note that 9 out of 20 subjects have no hernia labeled in the truth, which is indicated as gold stars in the middle-bottom plot. Four subjects (a, b, c, d) are selected to illustrate the qualitative results in Fig. 7.
Table 1.
Error metrics of anterior abdominal wall segmentation based on mean surface distance (MSD).
| Method | Region | MSD (mm) | MSD < 1mm (%) | MSD < 2mm (%) | MSD < 5mm (%) |
|---|---|---|---|---|---|
| Original image | Overall | 5.1 ± 1.61 | 7.65 ± 9.55 | 14.09 ± 15.09 | 55.12 ± 22.12 |
| Hernia | 6.21 ± 3.82 | 13.57 ± 8.71 | 23.33 ± 14.55 | 54.2 ± 29.82 | |
| Wall | 5.09 ± 1.58 | 7.1 ± 9.79 | 13.29 ± 15.48 | 54.56 ± 22.96 | |
| Smoothed image | Overall | 3.05 ± 1.13 | 25.31 ± 15.19 | 43.25 ± 19.47 | 84.43 ± 10.8 |
| Hernia | 5.75 ± 3.79 | 16.47 ± 12.37 | 27.42 ± 17.71 | 60 ± 25.2 | |
| Wall | 2.96 ± 1.07 | 25.18 ± 15.5 | 43.39 ± 19.99 | 85.43 ± 10.03 | |
| Intensity clustering | Overall | 2.65 ± 1.71 | 38.66 ± 16.29 | 60.05 ± 19.13 | 85.07 ± 18.22 |
| Hernia | 5.62 ± 3.92 | 18.81 ± 10.36 | 33.2 ± 16.92 | 61.78 ± 26.01 | |
| Wall | 2.53 ± 1.69 | 39.27 ± 16.62 | 61.14 ± 19.39 | 86.21 ± 18.07 | |
| Texture clustering | Overall | 1.87 ± 0.72 | 50.89 ± 14.5 | 72.7 ± 13.71 | 91.61 ± 4.96 |
| Hernia | 6.14 ± 4.52 | 15.52 ± 10.5 | 28.36 ± 16.21 | 56.65 ± 25.79 | |
| Wall | 1.74 ± 0.7 | 52.04 ± 14.05 | 74.41 ± 13.29 | 92.85 ± 4.34 |
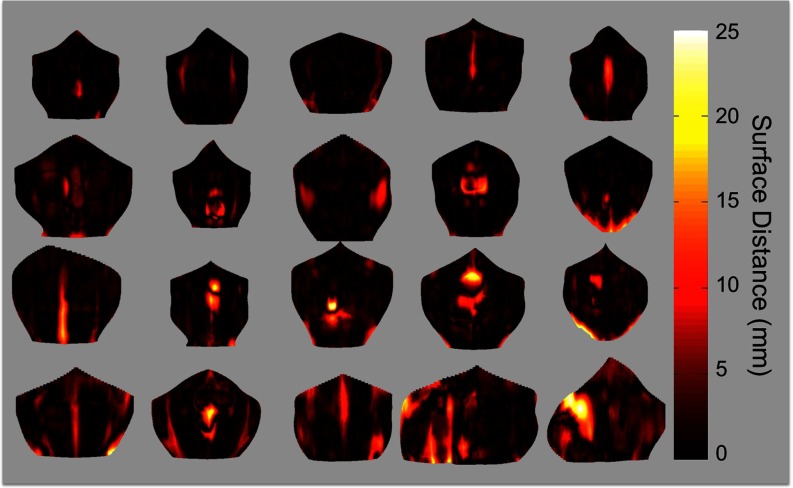
Four subjects with variable mean surface errors were selected to illustrate the performance of the proposed method. Segmentation results were demonstrated in a volumetric view, as well as in slices, both with ground truth overlaid. Generally, the entire abdominal regions of the four subjects were well segmented with reasonable errors around the herniated regions (Fig. 7). In addition, we rendered the interpolated abdominal wall with surface errors for the whole cohort. Over half of subjects had acceptable errors for the entire wall (Fig. 8).
Figure 7.
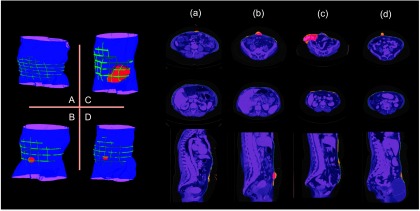
Qualitative results on selected subjects from Fig. 6. The letters (a, b, c, d) match with the subjects circled in Fig. 6. The left panel shows a volumetric view of segmentation. The right part presents the results on several slices. The manually labeled anterior abdominal wall on sparsely sampled slices, and the manually labeled herniated region are overlaid on the automatic segmentation. In addition, in the slice representation, the segmentation errors around the normal abdominal wall, and those for the herniated region are highlighted.
Figure 8.
Error maps for 20 subjects. The shape of the error map is provided by a thin-plate spline interpolation of the anterior abdominal wall on manual labeled meshes, where the lateral boundaries of the interpolated surface are also given by thin-plate spline interpolation, but on the terminations of the label meshes. The rendering color represents the 3D surface distance from the automated segmentation to the interpolated abdominal wall. Note that errors are most prominent in fascia and hernia regions.
DISCUSSION
An edge-based level set method integrated with texture analysis is proposed to extract the anterior abdominal wall, which provides the segmentation with mean surface errors less than 2 mm on 20 retrospective subjects validated by manually labeled ground truth. We do not claim that the proposed method has completely addressed the most challenging cases, but these are less impacted compared to other published methods. Specifically, based on the qualitative results shown in Figs. 578, we believe that challenges represented by Fig. 1g, 1h, 1i are well handled by the proposed method, while the challenges of 1(c)-1(f) and 1(j) are under better control than other methods. The methods using original image or smoothed image tend to suffer from the problem of 1(g)-1(i), while the method of intensity clustering is more likely to present worse performances in the cases of 1(c)-1(e). In addition, quantitative results in Fig. 6 and Table 1 show the improvement of the proposed method on a global scale. Therefore, we come to a conclusion that the inherent texture patterns are helpful to the tissue classification, and texture analysis can improve the level set segmentation around the abdominal region.
The capability of identifying muscles from fat is critical to the proposed segmentation of the abdominal wall. Through the texture analysis, the majority of muscles that constructs the abdominal wall can be distinguishable from fat tissue. The fascia regions, as well as some herniated regions appear as similar texture as the fat tissue [Figs. 3h, 3i, 3j]. This creates gaps between the muscles of abdominal wall, which challenges the level set segmentation for not intruding into the abdomen. Curvature constraints in level set cost function serve to prevent the intrusion by smoothing the surface evolution, but may fail to capture the underlying structure (Fig. 8). The identification of those regions requires further study, which can promisingly improve our current segmentation of the abdominal wall. We also note that some internal organs, e.g., kidney and small bowel, have similar texture as fat. This might be an issue for the visceral fat; however, it is not critical to the segmentation of surface of the abdominal wall. Therefore, we are more focused on the quality of texture classification between the skin surface and the outer surface of abdominal wall, i.e., the region that our level set method evolves through, than the internal abdomen.
The segmentations of bony skeleton and skin present visually reasonable results. Robust landmark derivation from these structures is under development for VH characterization, and quantitative validation will be conducted on the derived landmarks. In continuing efforts, we are interested in characterizing the abdominal wall composition, including the tissues in the narrowband (small area) around the outer fascia surface (including muscle, bone, fascia, organ, air, etc.). Using surface curvature models and tissue classifications, we will seek to identify abnormalities and disruptions (hernias) in the abdominal wall. Ultimately, improved quantification of hernia and abdominal wall structure will lead to a better idea of whom to treat (or not treat) and with what type of repair. This would lead to standardization of care and ultimately, less waste in this commonly performed procedure that is currently rife with unnecessary variation in care.
ACKNOWLEDGMENTS
This project was supported by ViSE/VICTR VR3029 and the National Institutes of Health (NIH) 1R03EB012461. The project described was supported by the National Center for Research Resources, Grant No. UL1 RR024975-01, and is now at the National Center for Advancing Translational Sciences, Grant No. 2 UL1 TR000445-06. The content is solely the responsibility of the authors and does not necessarily represent the official views of the NIH.
References
- Trimbos J. B., Smit I. B., Holm J. P., and Hermans J., “A randomized clinical trial comparing two methods of fascia closure following midline laparotomy,” Arch. Surg. 127, 1232–1234 (1992). 10.1001/archsurg.1992.01420100094016 [DOI] [PubMed] [Google Scholar]
- Pans A., Elen P., Dewe W., and Desaive C., “Long-term results of polyglactin mesh for the prevention of incisional hernias in obese patients,” World J. Surg. 22, 479–482; discussion 482–473 (1998). 10.1007/s002689900420 [DOI] [PubMed] [Google Scholar]
- Luijendijk R. W., Hop W. C. J., van den Tol M. P., de Lange D. C. D., Braaksma M. M. J., IJzermans J. N. M., Boelhouwer R. U., de Vries B. C., Salu M. K. M., and Wereldsma J. C. J., “A comparison of suture repair with mesh repair for incisional hernia,” N. Engl. J. Med. 343, 392–398 (2000). 10.1056/NEJM200008103430603 [DOI] [PubMed] [Google Scholar]
- Poulose B., Shelton J., Phillips S., Moore D., Nealon W., Penson D., Beck W., and Holzman M., “Epidemiology and cost of ventral hernia repair: Making the case for hernia research,” Hernia 16(2), 179–183 (2012). 10.1007/s10029-011-0879-9 [DOI] [PubMed] [Google Scholar]
- O’Connor J. P. B., Jackson A., Asselin M. C., Buckley D. L., Parker G. J. M., and Jayson G. C., “Quantitative imaging biomarkers in the clinical development of targeted therapeutics: Current and future perspectives,” Lancet Oncol. 9, 766–776 (2008). 10.1016/S1470-2045(08)70196-7 [DOI] [PubMed] [Google Scholar]
- Dickerson B. C. and Sperling R. A., “Neuroimaging biomarkers for clinical trials of disease-modifying therapies in Alzheimer's disease,” NeuroRx 2, 348–360 (2005). 10.1602/neurorx.2.2.348 [DOI] [PMC free article] [PubMed] [Google Scholar]
- Bielekova B. and Martin R., “Development of biomarkers in multiple sclerosis,” Brain 127, 1463–1478 (2004). 10.1093/brain/awh176 [DOI] [PubMed] [Google Scholar]
- Allen W. M., Xu Z., Asman A. J., Poulose B. K., and Landman B. A., “Quantitative anatomical labeling of the anterior abdominal wall,” Proceedings of SPIE Medical Imaging (Orlando, FL, 2013), pp. 867312–867312. [DOI] [PMC free article] [PubMed]
- Feng D., Wee Kheng L., and Venkatesh S., “Removal of abdominal wall for 3D visualization and segmentation of organs in CT volume,” Proceedings of the 16th IEEE International Conference on Image Processing (Cairo, Egypt, 2009), pp. 3377–3380.
- Zhu W., Nicolau S., Soler L., Hostettler A., Marescaux J., and Rémond Y., “Fast segmentation of abdominal wall: Application to sliding effect removal for non-rigid registration,” Proceedings of the 4th international conference on Abdominal Imaging: Computational and clinical applications (Nice, France, 2012), pp. 198–207.
- Yao J., Sussman D. L., and Summers R. M., “Fully automated adipose tissue measurement on abdominal CT,” SPIE Medical Imaging (Orlando, FL, 2011), pp. 79651Z-79651Z-79656.
- Osher S. and Fedkiw R., Level Set Methods and Dynamic Implicit Surfaces (Springer Verlag, 2003). [Google Scholar]
- Tuceryan M. and Jain A. K., “Texture analysis,” Handbook of Pattern Recognition and Computer Vision (World Scientific Publishing Co., Inc., River Edge, NJ, 1993), pp. 235–276. [Google Scholar]
- Castellano G., Bonilha L., Li L. M., and Cendes F., “Texture analysis of medical images,” Clin. Radiol. 59, 1061–1069 (2004). 10.1016/j.crad.2004.07.008 [DOI] [PubMed] [Google Scholar]
- Herlidou S., Rolland Y., Bansard J. Y., Le Rumeur E., and de Certaines J. D., “Comparison of automated and visual texture analysis in MRI: Characterization of normal and diseased skeletal muscle,” Magn. Reson. Imaging 17, 1393–1397 (1999). 10.1016/S0730-725X(99)00066-1 [DOI] [PubMed] [Google Scholar]
- Elfadel I. M. and Picard R. W., “Gibbs random fields, cooccurrences, and texture modeling,” IEEE Trans. Pattern Anal. Mach. Intell. 16, 24–37 (1994). 10.1109/34.273719 [DOI] [Google Scholar]
- Kansal A. R., Torquato S., Harsh I. G., Chiocca E. A., and Deisboeck T. S., “Cellular automaton of idealized brain tumor growth dynamics,” Biosystems 55, 119–127 (2000). 10.1016/S0303-2647(99)00089-1 [DOI] [PubMed] [Google Scholar]
- Chellappa R. and Chatterjee S., “Classification of textures using Gaussian Markov random fields,” IEEE Trans. Acoust., Speech, Signal Process. 33, 959–963 (1985). 10.1109/TASSP.1985.1164641 [DOI] [Google Scholar]
- Chen C.-C., DaPonte J. S., and Fox M. D., “Fractal feature analysis and classification in medical imaging,” IEEE Trans. Med. Imaging 8, 133–142 (1989). 10.1109/42.24861 [DOI] [PubMed] [Google Scholar]
- Daugman J. G., “Two-dimensional spectral analysis of cortical receptive field profiles,” Vision Res. 20, 847–856 (1980). 10.1016/0042-6989(80)90065-6 [DOI] [PubMed] [Google Scholar]
- Turner M. R., “Texture discrimination by Gabor functions,” Biol. Cybern. 55, 71–82 (1986). 10.1007/BF00341922 [DOI] [PubMed] [Google Scholar]
- Jain A. K. and Farrokhnia F., “Unsupervised texture segmentation using Gabor filters,” Pattern Recogn. 24, 1167–1186 (1991). 10.1016/0031-3203(91)90143-S [DOI] [Google Scholar]
- Bovik A. C., Clark M., and Geisler W. S., “Multichannel texture analysis using localized spatial filters,” IEEE Trans. Pattern Anal. Mach. Intell. 12, 55–73 (1990). 10.1109/34.41384 [DOI] [Google Scholar]
- Dunn D. and Higgins W. E., “Optimal Gabor filters for texture segmentation,” IEEE Trans. Image Process. 4, 947–964 (1995). 10.1109/83.392336 [DOI] [PubMed] [Google Scholar]
- Brox T. and Weickert J., “Level set based image segmentation with multiple regions,” Pattern Recogn. 3175, 415–423 (2004). 10.1007/b99676 [DOI] [Google Scholar]
- Rousson M., Brox T., and Deriche R., “Active unsupervised texture segmentation on a diffusion based feature space,” Proceeding of IEEE Computer Society Conference on Computer Vision and Pattern Recognition (2003), pp. II-699-704. 10.1109/CVPR.2003.1211535 [DOI]
- Karoui I., Fablet R., Boucher J.-M., and Augustin J.-M., “Region-based image segmentation using texture statistics and level-set methods,” Proceedings of IEEE International Conference on Acoustics, Speech and Signal Processing (Toulouse, France, 2006), pp. II-II.
- Paragios N. and Deriche R., “Geodesic active regions for supervised texture segmentation,” Proceedings of the 7th IEEE International Conference on Computer Vision (Corfu, Greece, 1999), pp. 926–932.
- Osher S. and Sethian J. A., “Fronts propagating with curvature-dependent speed - Algorithms based on Hamilton-Jacobi formulations,” J. Comput. Phys. 79, 12–49 (1988). 10.1016/0021-9991(88)90002-2 [DOI] [Google Scholar]
- Chan T. and Vese L., “An active contour model without edges,” Lect. Notes Comput. Sci. 1682, 141–151 (1999). 10.1007/3-540-48236-9 [DOI] [Google Scholar]
- Chan T. F. and Vese L. A., “A level set algorithm for minimizing the Mumford-Shah functional in image processing,” Proceedings of IEEE Workshop on Variational and Level Set Methods in Computer Vision (Vancouver, British Columbia, 2001), pp. 161–168.
- Li C. M., Kao C. Y., Gore J. C., and Ding Z. H., “Minimization of region-scalable fitting energy for image segmentation,” IEEE Trans Image Process. 17, 1940–1949 (2008). 10.1109/TIP.2008.2002304 [DOI] [PMC free article] [PubMed] [Google Scholar]
- Caselles V., Catte F., Coll T., and Dibos F., “A geometric model for active contours in image-processing,” Numer. Math. 66, 1–31 (1993). 10.1007/BF01385685 [DOI] [Google Scholar]
- Caselles V., Kimmel R., and Sapiro G., “Geodesic active contours,” Int. J. Comput. Vision 22, 61–79 (1997). 10.1023/A:1007979827043 [DOI] [Google Scholar]
- Kichenassamy S., Kumar A., Olver P., Tannenbaum A., and Yezzi A., “Gradient flows and geometric active contour models,” Proceedings of the 5th International Conference on Computer Vision (Cambridge, MA, 1995), pp. 810–815.
- Malladi R., Sethian J. A., and Vemuri B. C., “Shape modeling with front propagation - A level set approach,” IEEE Trans. Pattern Anal. Mach. Intell. 17, 158–175 (1995). 10.1109/34.368173 [DOI] [Google Scholar]
- Li C., Xu C., Konwar K. M., and Fox M. D., “Fast distance preserving level set evolution for medical image segmentation,” Proceedings of the 9th International Conference on Control, Automation, Robotics and Vision (Singapore, 2006), pp. 1–7.
- Qian Z., Metaxas D. N., and Axel L., “Extraction and tracking of MRI tagging sheets using a 3D Gabor filter bank,” Proceedings of the IEEE 28th Annual International Conference on Engineering in Medicine and Biology Society (New York, NY, 2006), pp. 711–714. [DOI] [PubMed]
- Zhang J., Tan T., and Ma L., “Invariant texture segmentation via circular Gabor filters,” Proceedings of the 16th International Conference on Pattern Recognition (Quebec City, Quebec, 2002), pp. 901–904.
- Smith S. M. and Brady J. M., “SUSAN—A new approach to low level image processing,” Int. J. Comput. Vision 23, 45–78 (1997). 10.1023/A:1007963824710 [DOI] [Google Scholar]
- Jenkinson M. and Smith S., “A global optimisation method for robust affine registration of brain images,” Med. Image Anal. 5, 143–156 (2001). 10.1016/S1361-8415(01)00036-6 [DOI] [PubMed] [Google Scholar]
- McAuliffe M. J., Lalonde F. M., McGarry D., Gandler W., Csaky K., and Trus B. L., “Medical image processing, analysis and visualization in clinical research,” Proceedings of the 14th IEEE Symposium on Computer-Based Medical Systems (Bethesda, MD, 2001), pp. 381–386.


