Abstract
Understanding the defects in innate immunity associated with perinatal HIV infection is prerequisite for the effective antiretroviral treatment. We therefore compared the innate immune response (Dendritic cell (DC) phenotype and function in peripheral blood by flow cytometry at baseline and 12 months in HIV infected children in order to determine the defect associated with perinatal HIV infection. As compared to controls patients had decreased numbers of total DC including plasmacytoid (p)DC and myeloid (m)DC and impaired function based on induction of maturation markers (CD83, CD80, CCR7) and cytokines TNF-α and IFN-α (exclusive to pDC) upon stimulation with TLR7/8 agonist Resiquimod. These abnormalities were evident in all three CD4 immune categories and persisted over 12 months; pDC function worsened in HIV+ children without treatment and improved slightly in those on HAART. In conclusion, a majority of perinatally HIV-infected older children without HAART remain clinically stable in the short term, but have demonstrable immunologic abnormalities indicative of defects in the innate immune system. Children initiated on HAART showed improvement in CD4 counts but didn’t show improvement in DC function over the short term.
Keywords: Dendritic cells, innate immunity, pediatric HIV
Introduction
Human immunodeficiency virus infection is associated with activation of immune responses, as well as a gradual loss of immune function and increased susceptibility to opportunistic infections. Patients with HIV infection at both early and late stages show immunoregulatory defects that precede CD4 T cell depletion (Fauci, 1993, Levy, 1993). While the loss of adaptive HIV-specific immune responses is an area of active investigation in HIV research, the potential role of the innate immune response in children is largely unknown. A recent review by Borrow et al., has emphasized the importance of innate immunity and the role of dendritic cells in the control of HIV/AIDS (Borrow et al., 2010). The course of perinatal HIV infection is rapid, with 50% of infected infants dying befor than 2nd birthday(Devi et al., 2009). Hence it is of interest to investigate phenotypic and functional changes in dendritic cell subsets associated with disease progression and immune reconstitution in children receiving suppressive highly active antiretroviral therapy (HAART).
Dendritic cells (DC) constitute a heterogenous population of antigen presenting cells that are critical for bridging the innate and the adaptive immune responses. DCs are found virtually in every tissue and organ. In the peripheral blood, two major DC populations can be identified: CD11C+ myeloid DCs (mDCs) and CD123+ plasmacytoid DCs (pDCs) (Siegal et al., 1999, Banchereau et al., 2000, Liu, 2005, Zhang & Wang, 2005, Cao & Liu, 2007). The chief mechanism of pathogen recognition by DC is via an evolutionarily conserved system of Toll-like receptors (TLRs), all of which share an interleukin-1 receptor like structural motif. mDCs and pDCs have different patterns of TLR expression. mDCs express Toll-like receptor 1(TLR1) through TLR6, TLR8, TLR10, and possibly TLR7, while pDCs express TLR1, TLR6, TLR10, and very high levels of TLR7 and TLR9 (Jarrossay et al., 2001, Kadowaki et al., 2001, Krug et al., 2001, Ito et al., 2002). In response to viral infections, both DC populations are involved in the generation of innate and acquired immune responses through secretion of type I interferons (IFN), TNF-α and IL-12. Mimicking viral infections, resiquimod induces the production of IL6, TNF-α, and IFN-α from dendritic cells. In addition, resiquimod directly activates innate immune responses through a MyD88/TLR7 dependent pathway (Hemmi et al., 2002).
Several studies have shown that, during HIV infection, both DC subsets are substantially reduced in patients’ blood (Macatonia et al., 1990, Grassi et al., 1999, Feldman et al., 2001, Soumelis et al., 2001, Chehimi et al., 2002, Barron et al., 2003, Donaghy et al., 2003). In some, this decrease correlated with the plasma viral load and was partially restored following highly active antiretroviral therapy (HAART) (Feldman et al., 2001, Soumelis et al., 2001, Barron et al., 2003). However it remains unclear whether DC functions recover following suppressive HAART in HIV infected children.
The main goal of the present study was to evaluate phenotypic and functional properties of the two major subsets of DC in relation to immunological status of children with perinatally acquired HIV infection, and to evaluate immunologic changes over time in both untreated children and those initiated on HAART.
Materials and Methods
Study subjects
Sixty two HIV-1 infected treatment naïve children attending government ART clinics in Chennai were enrolled in the study. Informed consent was obtained from their parents or legal guardians. They were followed up at 3 month intervals with clinical and laboratory evaluation upto 1 year. Nine patients were started on HAART (Lamivudine + stavudine with Nevirapine or Efavirenz) after baseline blood collection and continued therapy without modifying the regimen over one year follow-up period. 20 age-matched healthy children served as controls. Venous blood was collected in heparinized vacutainers and processed for dendritic cell assays.
Viral Load
Viral load measurements were performed on plasma samples from HIV infected children at baseline, 6 months and one year using the standard Cobas Amplicor HIV-1 Monitor Test, v1.5 (Roche Diagnostic systems) following the manufacturer’s protocol.
Whole Blood – Dendritic cell assay
Staining was performed on heparinized blood as described (Ida et al., 2006). Briefly 180 µl of whole blood was added to 20 µl R5 medium (5% pooled human AB serum, 1% HEPES buffer, 100 units/mL penicillin and 100 µg/mL streptomycin in RPMI 1640) containing 10 µM resiquimod (stimulated cultures) or only R5 medium (unstimulated cultures). Cultures were set up in ventilation-capped 5 ml polystyrene round-bottomed plastic tubes. Tubes were incubated at 37°C in a humid, 5% CO2 atmosphere at a 5° slant.
Intracellular Cytokine assay
After one hour of incubation, Brefeldin A was added at a final concentration of 10 µg/ml and incubation was continued for an additional 2 hrs. Following incubation surface staining was performed by adding the following antibody cocktails: Lineage-1 FITC, CD123 / CD11c PE and HLA-DR PerCP. Tubes were vortexed and incubated at room temperature for 30 min in dark. After incubation, red cells were lysed using BD FACS lysing solution followed by washing with 2ml of Wash buffer. Cells were permeabilized in 200 µl of cytofix/cytoperm buffer for 20 min at 4°C. Subsequently, samples were washed twice with 1 ml of permeablization buffer. Anti-human TNF-α APC (1:200) and anti-human IFN-α Alexa fluor-647 (1:400) antibodies diluted in permeablization buffer was added at 30 µl per tubes and samples were incubated for 30 min in the dark at 4°C. Samples were washed twice with 1 ml permeablization buffer. Cell pellets were then resuspended in 200 µl of 1% paraformaldehyde and stored in the dark at 4°C prior to flow cytometric analysis.
Surface staining
After 5 hrs of incubation period resiquimod stimulated and unstimulated whole blood cultures were subjected to surface staining by adding the following antibody cocktails: Lineage-1 FITC, CD11c / CD123 APC, HLA-DR PerCP and maturation/activation markers (CD80/CD83/CCR7) PE. Tubes were vortexed and incubated at room temperature for 30 min. After incubation, red cells were lysed using a BD lysing solution followed by washing with 2ml of Wash buffer. Cell pellets were resuspended in 200 µl 1% paraformaldehye and stored in the dark at 4°C prior to flow cytometric analysis.
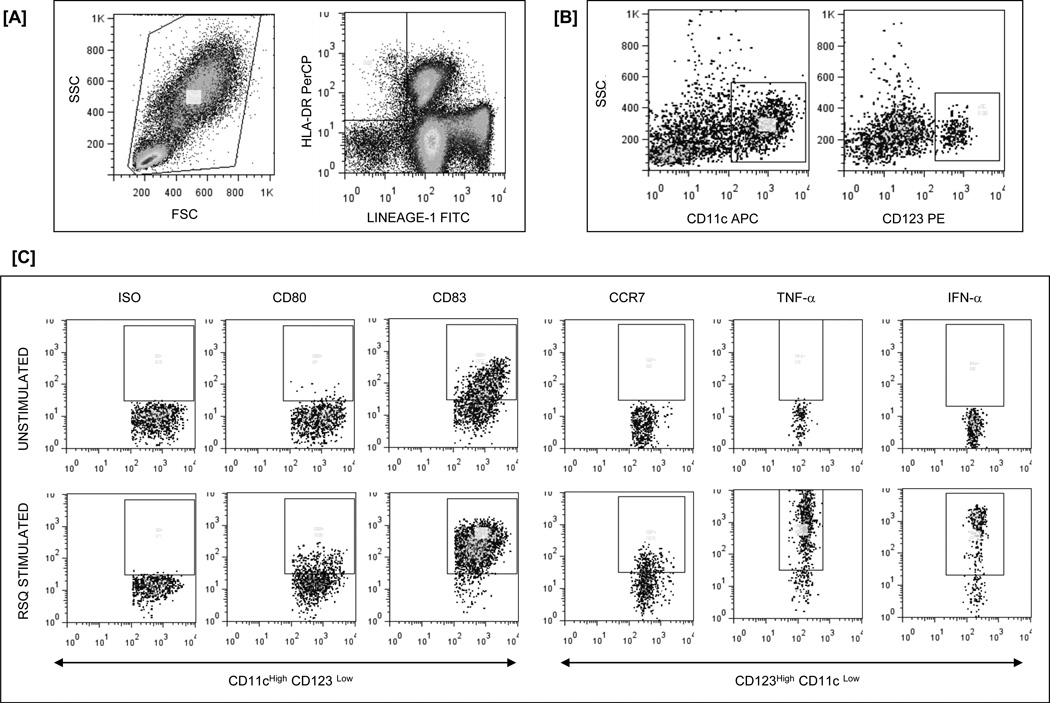
Acquistion was performed on FACS-Calibur using CellQuestPro software and analysed using FlowJo software version 7.1.3. Fig 1 shows representative gating strategy to detect cytokine production and expression of maturation factors by DC subsets in whole blood.
Fig 1.
Flow cytometry gating strategy to detect cytokine production and expression of maturation factors by DC in WB. [A] Among viable cells, DC are identified as negative for the lineage markers (Lin-1) and positive for HLA-DR [B] HLA-DRpos and Lineage−1neg DC are then phenotyped as myeloid (CD123low, CD11chigh) or plasmacytoid (CD11clow, CD123high) DC. [C] Expression of maturation factors (CD83, CD80 and CCR7) and cytokines (TNF-α and IFN-α) on DC subsets after TLR7/8 stimulation including isotype and unstimulated controls.
Statistical Analysis
Statistical analysis was performed using ANOVA and a general linear model with planned contrasts was used to compare CD4 and Viral load changes over time. P values < 0.05 were considered significant. SAS version 9.1 was used for analyses; Sigma plot (version 11.0) was used to plot graphs.
Results
Characteristics of the patient population
Sixty two HAART naïve children (28 males/ 34 females) with ages ranging from 9 months – 13 years, and median BMI of 14.4 (6.4 – 24.1) were included in the study. At entry, CD4 counts in the study subjects ranged between 5 – 44 % (median 23) and plasma HIV-RNA between 4490 – >7,50,000 (median 89,200) copies/ml. Patients were classified into age specific immune categories based on their CD4 count at the time of entry into the study : Immune category (IC-1)[CD4% >25, n=20, (32.25%)], IC-2 [CD4% 15 – 25, n=33 (53.23%)] and IC-3 [CD4% < 15, n=9 (14.52%)] (CDC 1994). Nine patients (5 with CD4<15%, 4 with CD4 ≥ 15%) were started on HAART (Lamivudine + stavudine with Nevirapine or Efavirenz) during the study period and treatment was given as per National AIDS Control Organisation guidelines (NACO Report 2006). Children who did not initiate HAART were also monitored every 3 months up to one year. The immunological and virological characteristics of different groups at baseline are described in Table 1 and during follow up are described in Table 2. We also studied 20 (9 males / 11 females) healthy age-matched HIV uninfected children as controls at one time point only.
Table 1.
Baseline immunological and virological characteristics of the study population
| Category | Total HIV Subjects | IC1 | IC2 | IC3 | Control | |
|---|---|---|---|---|---|---|
| N a | 62 | 20 | 33 (4) b | 9 (5) b | 20 | |
| Age c | 7 (0.9 – 13) | 7(0.9 – 13) | 6(1.5 – 12) | 6 (3 – 13) | 7 (1 – 12) | |
| VL (Log 10)c copies / ml | 4.96 (3.65 – 5.87) | 4.7 (3.65 – 5.88) | 4.97 (3.75 – 5.88) | 5.32 (4.73 – 5.69) | -- | |
| Hemoglobin (gm/dl) d | 10.96 ± 1.4 | 10.73 ± 1.45 | 10.96 ± 1.51 | 11.19 ± 1.23 | 10.51 ± 1.30 | |
| CD3 d | % | 79 ± 10 | 79 ± 8 | 78 ± 7 | 81 ± 14 | 66 ± 10 |
| Cells/mm3 | 2878 ± 1439 | 2954 ± 1079 | 2899 ± 1374 | 2780 ± 1864 | 4131 ± 2791 | |
| CD4 d | % | 21 ± 4 | 32 ± 5 | 21 ± 3 | 9 ± 3 | 33 ± 8 |
| Cells/mm3 | 766 ± 374 | 1213 ± 530 | 809 ± 459 | 275 ± 132 | 2147 ± 1452 | |
| CD8 d | % | 53 ± 10 | 42 ± 8 | 51 ± 8 | 66 ± 14 | 29 ± 10 |
| Cells/mm3 | 1909 ± 1041 | 1557 ± 578 | 1885 ± 883 | 2286 ± 1661 | 1764 ±1 446 | |
| CD19 d | % | 10 ± 6 | 12 ± 7 | 11 ± 5 | 8 ± 5 | 23 ± 8 |
| Cells/mm3 | 388 ± 335 | 459 ± 375 | 465 ± 450 | 240 ± 179 | 1338 ± 939 | |
| CD16+56 d | % | 17 ± 4 | 5 ± 3 | 7 ± 6 | 5 ± 4 | 9 ± 5 |
| Cells/mm3 | 220 ± 197 | 193 ± 130 | 306 ± 313 | 161 ± 149 | 485 ± 389 | |
| DC d | % | 0.36 ± 0.03 | 0.31 ± 0.13 | 0.38 ± 0.28 | 0.40 ± 0.14 | 0.67 ± 0.32 |
| Cells/mm3 | 31 ± 2 | 27 ± 14 | 31 ± 17 | 33 ± 18 | 86 ± 66 | |
| mDC d | % | 0.26 ± 0.02 | 0.24 ± 0.09 | 0.26 ± 0.20 | 0.28 ± 0.09 | 0.44 ± 0.20 |
| Cells/mm3 | 22 ± 2 | 21 ± 11 | 22 ± 13 | 23 ± 12 | 57 ± 43 | |
| pDC d | % | 0.1 ± 0.01 | 0.07 ± 0.05 | 0.12 ± 0.10 | 0.12 ± 0.07 | 0.23 ± 0.14 |
| Cells/mm3 | 9 ± 1 | 6 ± 4 | 10 ± 6 | 10 ± 7 | 29 ± 24 | |
N - Number of samples
Values in the brackets – Number of children initiated HAART
Data are median (range)
Data are mean ± SD
Table 2.
Immunological and Virological changes in different IC groups during followup
| Category | Baseline | 3rd Month | 6th Month | 9th Month | 12th Month | ||
|---|---|---|---|---|---|---|---|
| Total | N a (Nd) | 52(62) | 52(58) | 52(58) | 52(53) | 52(52) | |
| DC | % | 0.36 ± 0.03 | 0.29 ± 0.02 | 0.39 ± 0.03 | 0.41 ± 0.02 | 0.49 ± 0.03 | |
| Cells/mm3 | 31 ± 2 | 25 ± 2 | 34 ± 3 | 34 ± 2 | 40 ± 3 | ||
| mDC | % | 0.26 ± 0.02 | 0.22 ± 0.02 | 0.29 ± 0.02 | 0.3 ± 0.02 | 0.38 ± 0.03 | |
| Cells/mm3 | 22 ± 2 | 18 ± 1 | 25 ± 2 | 25 ± 1.41 | 31 ± 2 | ||
| pDC | % | 0.1 ± 0.01 | 0.07 ± 0.01 | 0.10 ± 0.01 | 0.11 ± 0.01 | 0.11 ± 0.01 | |
| Cells/mm3 | 9 ± 1 | 6 ± 1 | 9 ± 1 | 9 ± 1 | 9 ± 1 | ||
| CD3 | % | 79 ± 10 | 81 ± 2 | 81 ± 1 | 82 ± 1 | 79 ± 2 | |
| Cells/mm3 | 2878 ± 1439 | 3100 ± 198 | 2963 ± 195 | 3093 ±154 | 2901 ± 172 | ||
| CD4 | % | 21 ± 4 | 25 ± 2 | 26 ± 1 | 28 ± 2 | 26 ± 1 | |
| Cells/mm3 | 766 ± 374 | 947 ± 63 | 958 ± 80 | 1048 ± 77 | 867 ± 66 | ||
| CD8 | % | 53 ± 10 | 51 ± 2 | 50 ± 1.6 | 50 ± 1.92 | 49 ± 2 | |
| Cells/mm3 | 1909 ± 1041 | 1953 ± 143 | 1820 ± 133 | 1880 ± 111 | 1694 ± 125 | ||
| VL (Log10) copies/ml | 4.94 | -- | 4.42 | -- | 4.31 | ||
| IC1 | N a (Nd) | 18(20) | 18(20) | 18(20) | 18(18) | 18(18) | |
| DC | % | 0.31 ± 0.13 | 0.30 ± 0.15 | 0.36 ± 0.14 | 0.43 ±0.23 | 0.53 ± 0.26 | |
| Cells/mm3 | 27 ± 14 | 25 ± 15 | 32 ± 19 | 35 ± 15 | 42 ± 22 | ||
| mDC | % | 0.24 ± 0.09 | 0.23 ± 0.14 | 0.28 ± 0.12 | 0.34 ± 0.2 | 0.43 ± 0.23 | |
| Cells/mm3 | 21 ± 11 | 19 ± 13 | 24 ± 12 | 27 ± 12 | 34 ± 18 | ||
| pDC | % | 0.07 ± 0.05 | 0.07 ± 0.03 | 0.08 ± 0.05 | 0.09 ± 0.04 | 0.10 ± 0.06 | |
| Cells/mm3 | 6 ± 4 | 6 ± 3 | 8 ± 7 | 7 ± 4 | 8 ± 5 | ||
| CD3 | % | 79 ± 8 | 83 ± 7 | 82 ± 6 | 81 ± 6 | 78 ± 9 | |
| Cells/mm3 | 2954 ± 1079 | 2736 ± 870 | 2789 ± 1410 | 2743 ± 1073 | 2365 ± 774 | ||
| CD4 | % | 32 ± 5 | 33 ± 7 | 31 ± 5 | 34 ± 7 | 34 ± 8 | |
| Cells/mm3 | 1213 ± 530 | 1086 ± 395 | 1068 ± 619 | 1150 ± 549 | 1033 ± 448 | ||
| CD8 | % | 42 ± 8 | 46 ± 9 | 46 ± 9 | 43 ± 11 | 40 ± 11 | |
| Cells/mm3 | 1557 ± 578 | 1517 ± 548 | 1560 ± 802 | 1461 ± 703 | 1197 ± 437 | ||
| VL (Log10) copies/ml | 4.7 | -- | 4.73 | -- | 4.53 | ||
| IC2 | N a (Nd) | 22(33) | 22(25) | 22(25) | 22(22) | 22(22) | |
| DC | % | 0.38 ± 0.28 | 0.27 ± 0.15 | 0.43 ± 0.24 | 0.38 ± 0.10 | 0.49 ± 0.25 | |
| Cells/mm3 | 31 ± 17 | 22 ± 12 | 30 ± 12 | 35 ± 11 | 40 ± 22 | ||
| mDC | % | 0.26 ± 0.20 | 0.2 ± 0.13 | 0.32 ± 0.21 | 0.26 ± 0.07 | 0.39 ± 0.21 | |
| Cells/mm3 | 22 ± 13 | 17 ± 9 | 22 ± 8 | 24 ± 9 | 31 ± 13 | ||
| pDC | % | 0.12 ± 0.10 | 0.07 ± 0.05 | 0.10 ± 0.05 | 0.12 ± 0.06 | 0.10 ± 0.07 | |
| Cells/mm3 | 10 ± 6 | 6 ± 4 | 8 ± 5 | 11 ± 4 | 9 ± 6 | ||
| CD3 | % | 78 ± 7 | 80 ± 9 | 79 ± 9 | 82 ± 9 | 79 ± 12 | |
| Cells/mm3 | 2899 ± 1374 | 3546 ± 2039 | 2639 ± 1243 | 3608 ± 1237 | 2830 ± 1316 | ||
| CD4 | % | 21 ± 3 | 21 ± 2 | 21 ± 3 | 20 ± 3 | 19 ± 3 | |
| Cells/mm3 | 809 ± 459 | 933 ± 510 | 692 ± 326 | 909 ± 451 | 684 ± 286 | ||
| CD8 | % | 51 ± 8 | 53 ± 10 | 53 ± 9 | 58 ± 11 | 55 ± 11 | |
| Cells/mm3 | 1885 ± 883 | 2341 ± 1411 | 1757 ± 853 | 2488 ± 738 | 2008 ± 1048 | ||
| VL (Log10) copies/ml | 5.0 | -- | 4.63 | -- | 4.6 | ||
| IC3 | N a (Nd) | 4(9) | 4(4) | 4(4) | 4(4) | 4(4) | |
| DC | % | 0.40 ± 0.14 | 0.37 ± 0.06 | 0.42 ± 0.39 | 0.47 ± 0.12 | 0.57 ± 0.10 | |
| Cells/mm3 | 33 ± 18 | 26 ± 12 | 51 ± 35 | 36 ± 10 | 51 ± 22 | ||
| mDC | % | 0.28 ± 0.09 | 0.26 ± 0.06 | 0.28 ± 0.26 | 0.33 ± 0.13 | 0.40 ± 0.08 | |
| Cells/mm3 | 23 ± 12 | 18 ± 9 | 31 ± 27 | 26 ± 10 | 36 ± 15 | ||
| pDC | % | 0.12 ± 0.07 | 0.11 ± 0.04 | 0.14 ± 0.10 | 0.14 ± 0.03 | 0.16 ± 0.03 | |
| Cells/mm3 | 10 ± 7 | 8 ± 5 | 19.89 ± 8.13 | 11 ± 3 | 15 ± 7 | ||
| CD3 | % | 81 ± 14 | 77 ± 20 | 87 ± 6 | 84 ± 6 | 79 ± 10 | |
| Cells/mm3 | 2780 ± 1864 | 2424 ± 1413 | 4691 ± 1652 | 2492 ± 435 | 2329 ± 1022 | ||
| CD4 | % | 9 ± 3 | 12 ± 2 | 13 ± 2 | 12 ± 2 | 11 ± 3 | |
| Cells/mm3 | 275 ± 132 | 357 ± 177 | 670 ± 158 | 376 ± 118 | 348 ± 185 | ||
| CD8 | % | 66 ± 14 | 60 ± 18 | 68 ± 8 | 67 ± 8 | 63 ± 12 | |
| Cells/mm3 | 2286 ± 1661 | 1923 ± 1190 | 3766 ± 1663 | 1988 ± 341 | 1846 ± 805 | ||
| VL (Log10) copies/ml | 5.24 | -- | 5.48 | -- | 5.23 | ||
| HAART | N a (Nd) | 8b(9) | 8(9) | 8(9) | 8(9) | 8(8) | |
| DC | % | 0.42 ± 0.25 | 0.28 ± 0.15 | 0.44 ± 0.17 | 0.40 ± 0.08 | 0.34 ± 0.04 | |
| Cells/mm3 | 33 ± 28 | 27 ± 18 | 36 ± 22 | 32 ± 3 | 27 ± 6 | ||
| mDC | % | 0.31 ± 0.17 | 0.21 ± 0.08 | 0.31 ± 0.13 | 0.31 ± 0.02 | 0.24 ± 0.03 | |
| Cells/mm3 | 25 ± 19 | 20 ± 11 | 27 ± 19 | 26 ± 7 | 19 ± 4 | ||
| pDC | % | 0.11 ± 0.08 | 0.07 ± 0.08 | 0.13 ± 0.05 | 0.09 ± 0.07 | 0.1 ± 0.05 | |
| Cells/mm3 | 9 ± 9 | 7 ± 7 | 9 ± 4 | 6 ± 4 | 8 ± 3 | ||
| CD3 | % | 75 ± 14 | 83 ± 4 | 81 ± 8 | 83 ± 4 | 80 ± 3 | |
| Cells/mm3 | 2969 ± 1808 | 3103 ± 994 | 3190 ± 1185 | 3122 ± 1160 | 2686 ± 545 | ||
| CD4 | % | 13 ± 2 | 25 ± 2 | 24 ± 6 | 34 ± 7 | 30 ± 3 | |
| Cells/mm3 | 477 ± 156 | 906 ± 185 | 1059 ± 351 | 1303 ± 489 | 942 ± 99 | ||
| CD8 | % | 55 ± 16 | 53 ± 7 | 53 ± 8 | 45 ± 10 | 44 ± 3 | |
| Cells/mm3 | 2243 ± 1596 | 1991 ± 740 | 1963 ± 888 | 1681 ± 978 | 1564 ± 408 | ||
| cVL (Log10) copies/ml | 5.5 | -- | 3.25 | -- | 3.01 | ||
N - Number of samples taken for analysis;
N - Total number of samples collected
-Before Initiation of HAART ; Data are Mean ± SD
– VL - Viral Load; Data are Median
Resiquimod induced cytokine expression on DC subsets
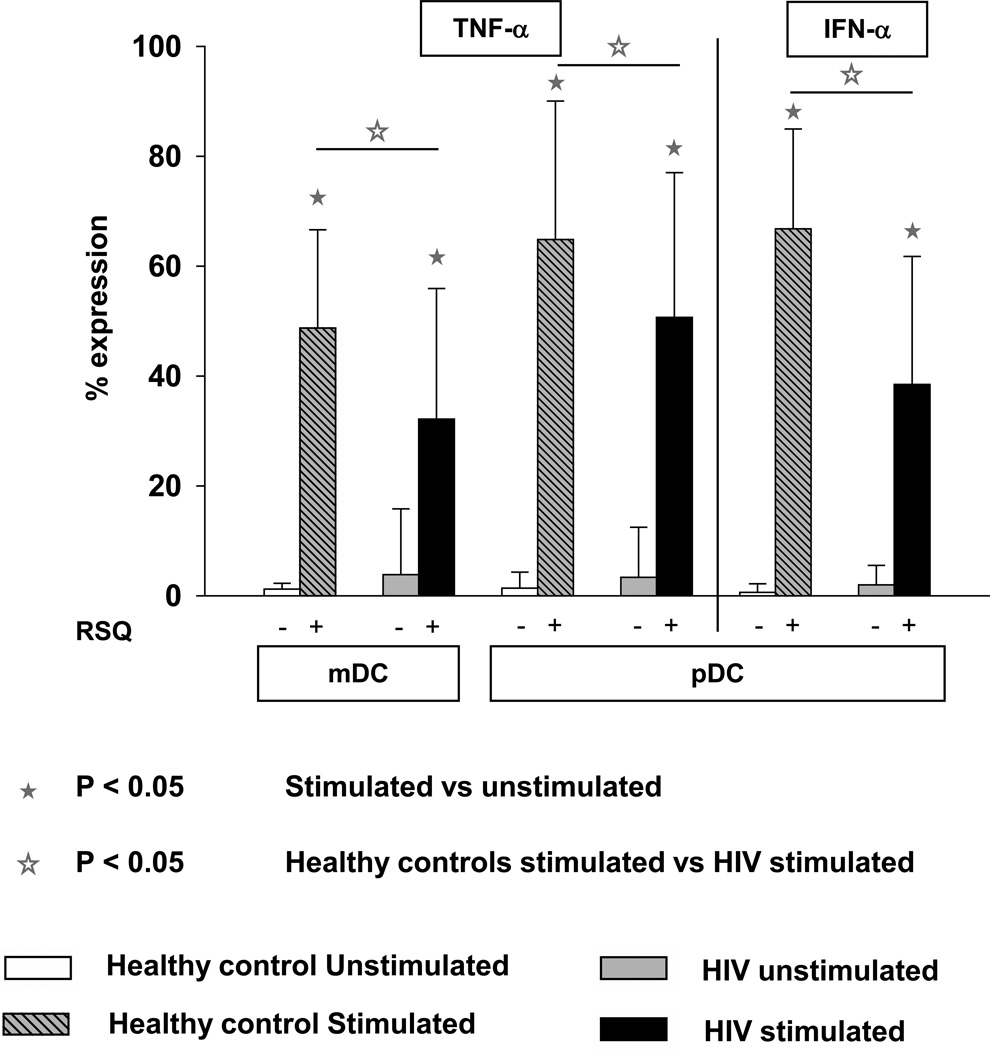
We evaluated the effect of resiquimod (RSQ), chemical agonist of TLR7 and TLR8 on the DC subsets of HIV+ children. As shown in Table 2 the absolute number of mDC were greater than pDC in both HIV+ and age matched healthy control subjects. At baseline, RSQ induced cytokine expression in both DC subsets (mDC and pDC) showed a lot of inter-individual variation in both HIV+ children and age matched healthy controls. Compared to controls, HIV+ children had significantly lower percentages of RSQ induced TNF-α producing cells in both DC subsets. In contrast, IFN-α was expressed exclusively by pDC and children with HIV had significantly lower proportion of RSQ induced IFN-α secreting pDCs than healthy children (Fig 2).
Fig 2.
Percentage of DC subsets (mDC & pDC) expressing cytokines TNF-α and IFN-α after TLR7/8 stimulation in WB taken from HIV + children (n=62) and age matched controls (n=20). WB was incubated without any stimulus or with resiquimod 10 µM for 3 hrs. Cells were then processed and acquired by flow cytometry as described in Methods. The data are shown as the mean and SD.
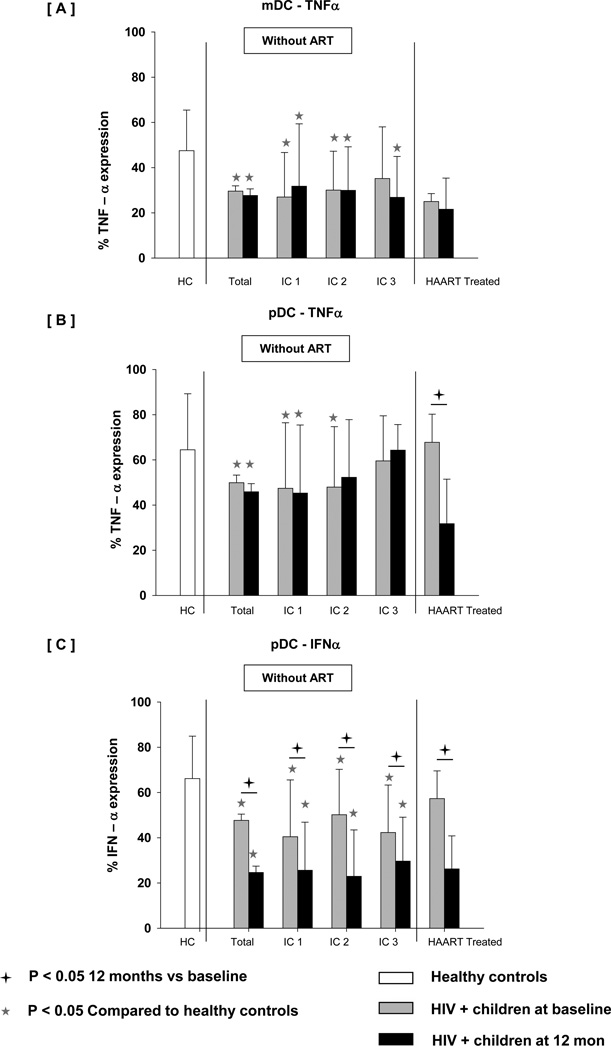
Reduced RSQ induced cytokine expression persisted over follow-up with further decline in IFN-α induction in pDC at 12 months (Fig 3). In contrast, TNF-α expression on both DC subsets was stable between 0 and 12 months in total HIV+ children though significantly lower when compared to controls. When cytokine expression was compared in patients across different immune stages (IC1, IC2 or IC3), RSQ induced cytokine expression did not correlate significantly with disease stage. In comparison with untreated subjects, children initiating HAART exhibited stable expression of TNF-α in mDC. In contrast, a profound reduction of TNF-α and IFN-α expression in pDC was seen in HIV+ children even after treatment.
Fig 3.
Percentage of DC subsets (mDC & pDC) expressing cytokines ([A] mDC-TNF-α, [B] pDC-TNF-a and [C] pDC-IFN-α) after TLR7/8 stimulation in WB taken from age matched controls, HIV+ children at baseline, HIV+ children at 12 month followup without treatment (categorized as IC1, IC2 and IC3) and HIV+ children at 12 month after HAART. WB was incubated without any stimulus or with resiquimod 10 µM for 3 hrs. Cells were then processed and acquired by flow cytometry as described in Methods. The data are shown as the mean and SD.
Resiquimod induced DC maturation
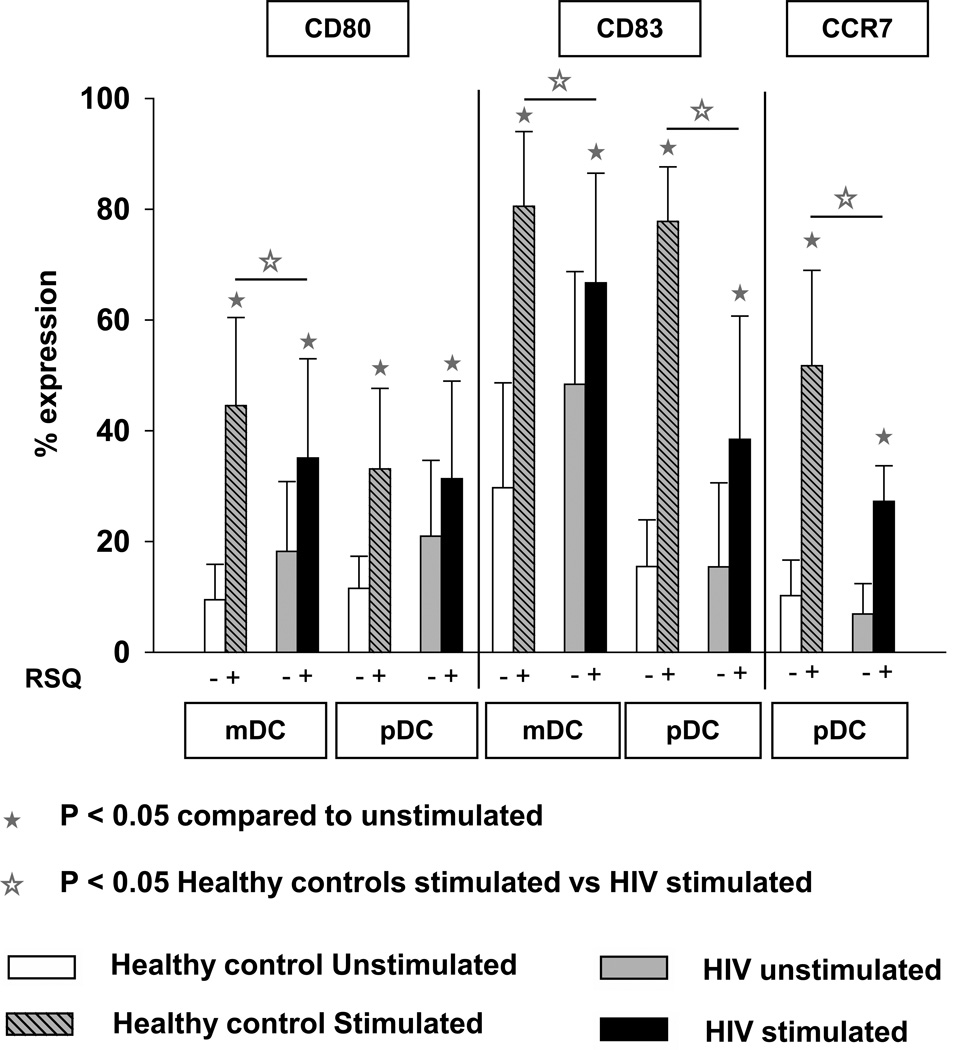
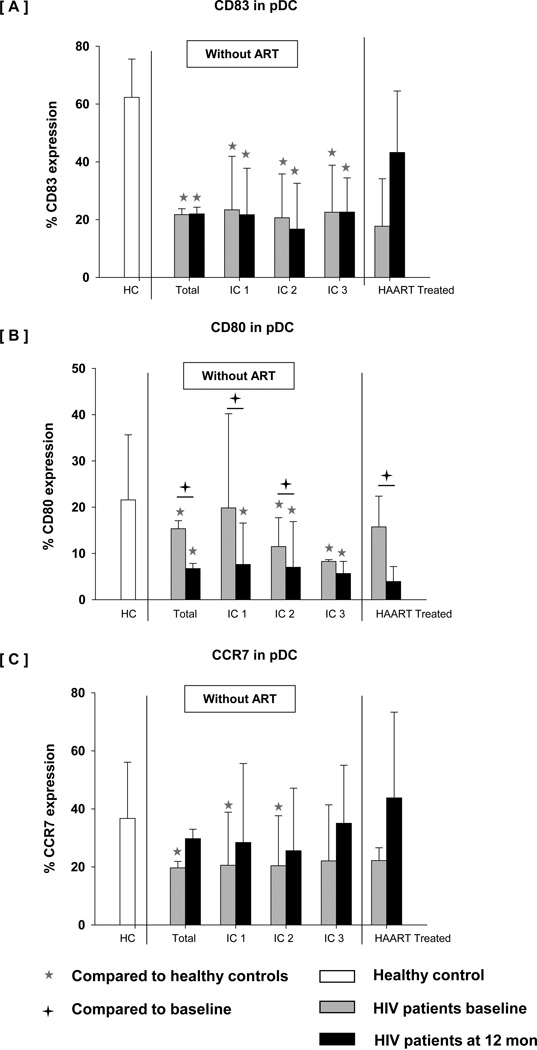
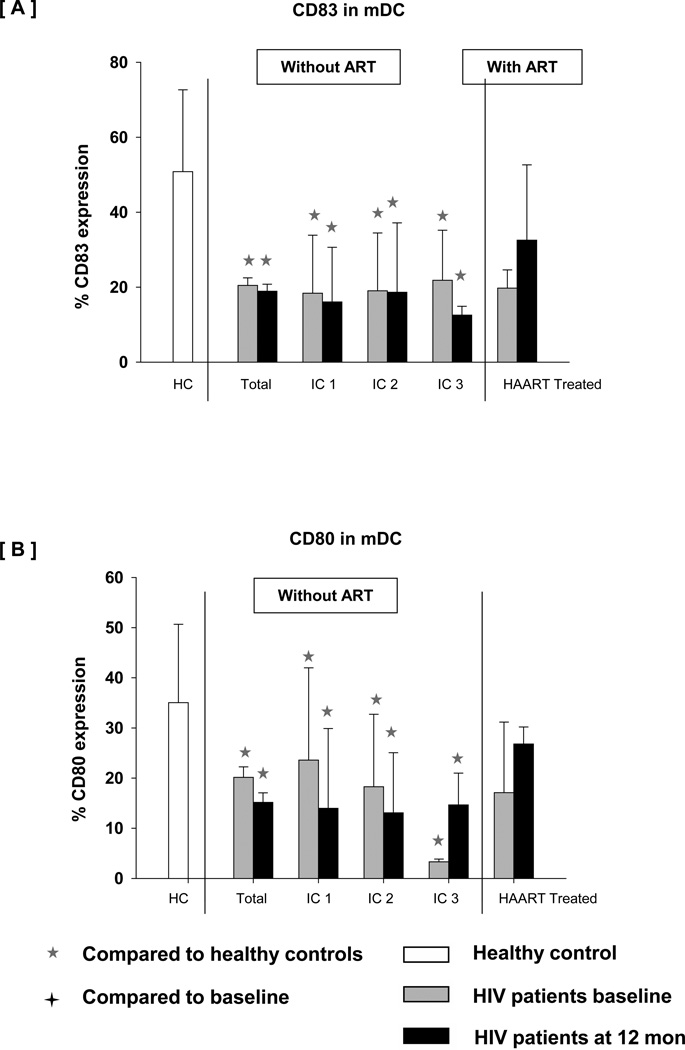
To examine the effect of reduced cytokine expression on DC maturation in HIV+ children, we analyzed the expression of CD83, CD80 and CCR7, of which all are associated with the maturation status of DCs. As shown in Fig 4, RSQ induced CD80 and CD83 expression was significantly lower in mDC of HIV+ children at baseline than controls. In contrast, RSQ induced CD80 expression was non-significant in pDC. Also, in comparison with the age matched healthy controls, RSQ induced CD83 and CCR7 expression was significantly lower in pDC of HIV+ children.
Fig 4.
Expression of CD80 and CD83 on DC subsets (mDC & pDC) and expression of CCR7 on pDC only after TLR7/8 stimulation in WB taken from HIV + children (n=62) and age matched controls (n=20). WB was incubated without any stimulus or with resiquimod 10 µM for 5 hrs. Cells were then processed and acquired by flow cytometry as described in Methods. The data are shown as the mean and SD.
The defect in DC maturation persisted over follow up with further decline in the expression of maturation markers especially CD80 on pDC at 12 months. CD83, CD80 and CCR7 expression on pDC varied greatly among different IC groups and total HIV+ children during follow-up. As shown in Fig 5, RSQ induced pDC maturation did not correlate significantly with changes in CD4 T cell counts. In comparison with the untreated children, the HIV+ children initiating HAART showed increased expression of CD83 and CCR7 on pDC. In contrast, further decline in CD80 expression was seen on pDC in HIV+ children even after treatment.
Fig 5.
Expression of [A] CD83, [B] CD80 and [C] CCR7 on pDC subset after TLR7/8 stimulation in WB taken from age matched controls, HIV + children at baseline, HIV+ children at 12 month followup without treatment (categorized as IC1, IC2 and IC3) and HIV+ children at 12 month after HAART. WB was incubated without any stimulus or with resiquimod 10 µM for 5 hrs. Cells were then processed and acquired by flow cytometry as described in Methods. The data are shown as the mean and SD.
We observed significantly lower expression of CD83 and CD80 on mDC in total HIV+ children as well as different IC groups and during follow-up. As shown in Fig 6 expression of CD83 and CD80 on mDC varied greatly in HIV+ children but was significantly lower than in controls. In comparison with the untreated children, HIV+ children initiating HAART showed a non-significantly higher expression of CD83 and CD80 on mDC.
Fig 6.
Expression of [A] CD83 and [B] CD80 on mDC subset after TLR7/8 stimulation in WB taken from age matched controls, HIV + children at baseline, HIV+ children at 12 month followup without treatment (categorized as IC1, IC2 and IC3) and HIV+ children at 12 month after HAART. WB was incubated without any stimulus or with resiquimod 10 µM for 5 hrs. Cells were then processed and acquired by flow cytometry as described in Methods. The data are shown as the mean and SD.
Discussion
We studied DC specific markers of phenotype and function in children with perinatal HIV infection and evaluated their change over a period of 1 year. We also compared these markers across different CD4 strata and studied the impact of HAART on DC functions and phenotype.
Although previous research has shown that HIV-1 infected individuals have reduced mDC and pDC levels, information on the functional capability of blood dendritic cell subsets and their role during immune reconstitution in HAART treated pediatric HIV patients is not well described (Zhang et al., 2006, Usuga et al., 2008). We found that circulating mDCs and pDCs were deficient qualitatively and quantitatively at study entry in HIV infected children when compared to age-matched controls. Persistence of these defects over one year, with further decline in some of their characteristics suggests that these functional properties may play an important role in mounting or maintaining a successful immune response against perinatal HIV infection. We also found that HAART treatment partially restored mDCs, but that recovery of pDCs was incomplete. Our data showing a further decline in CD80 and IFN-α induction in pDC over follow-up, despite HAART, supports the notion that pDC function is profoundly impaired in pediatric patients with HIV-1 infection and that delayed HAART initiation does not restore this immunological defect. Collectively, these defects were evident in analysis of all patients, and were variably expressed in patients in immune categories IC1, IC2 and IC3.
In concordance with studies conducted in adult populations (Macatonia et al., 1990, Grassi et al., 1999, Feldman et al., 2001, Chehimi et al., 2002, Hemmi et al., 2002, Barron et al., 2003, Donaghy et al., 2003), both mDC percentages and their capability for cytokine (TNF-α) production were reduced in therapy naïve HIV infected children, indicating that this DC subset is also depleted in pediatric HIV-1 infection. The functional impairment of mDCs partially recovered in children on HAART. The differential restoration of mDCs and pDCs in HIV-1 infected children after HAART might be explained in part by differences in HIV susceptibility, variable sensitivities to HAART treatment, and selective interaction of HIV-1 with mDCs and pDCs.
Based on our examination of circulating DC subsets throughout the period of our study, we draw the following conclusions: Firstly HIV-1 infection leads to a decrease in numbers of circulating DC subsets along with a functional impairment in these cells. Impaired functions include the decreased expression of maturation markers (CD80, CD83 and CCR7) and decreased cytokine releasing capacities of mDC (TNF-α) and pDCs(TNF α and IFN-α). Secondly, while HAART can successfully control HIV-1 replication, there is only a partial recovery in DC; pDC frequency and function recovery is less than mDC recovery. Time of initiation of HAART may influence the degree of recovery of functionally impaired pDCs, as most children in this cohort started treatment quite late. Thus, cellular immune responses that involve CD4 T cells may be induced, coordinated and regulated by DCs.
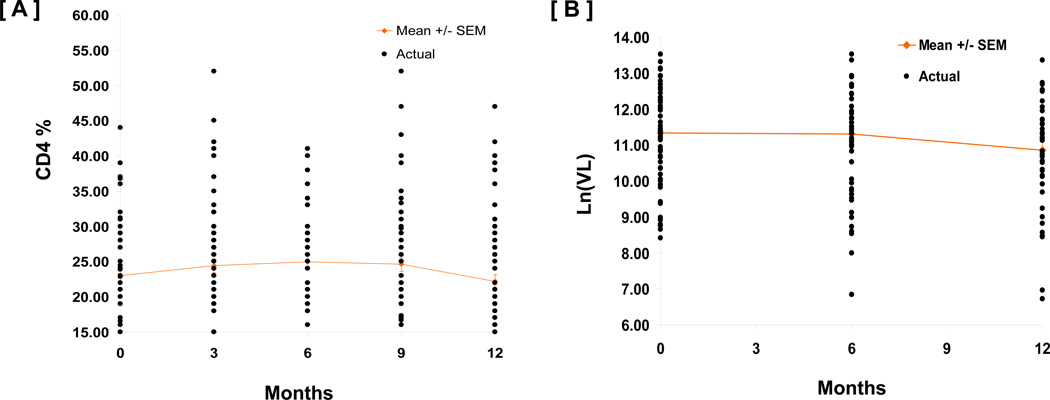
The cohort studied by us were children who had survived infancy and thus had a less aggressive course of the disease (Fig 7). Further only a small number were initiated on HAART during the 12-month period of follow-up, limiting our observation on the impact of HAART on recovery of innate immune functions. However, future studies are planned to examine this phenomenon in infants initiated on HAART early in life, and examine the long term effect of HAART on the immune system.
Fig 7.
CD4 [A] and Viral load [B] over 12 month follow-up period were relatively stable in untreated HIV+ children.
Acknowledgement
This study was supported from the Indo-US program on Maternal & Child Health, and Human Development Research sponsored by Eunice Kennedy Shriver National Institute of Child Health & Human Development, USA through a grant HD052154 to S Pahwa (USA) and Indian Council of Medical Research to S Swaminathan (India) and from the Miami CFAR (P30AI073961). We thank Mr Jim Robin for his technical support with the viral load assay, Dr Seema Desai for help in development of the DC assay and Dr Kris Arheart for statistical support.
Footnotes
Authors declare no potential conflict of interest.
References
- Banchereau J, Briere F, Caux C, Davoust J, Lebecque S, Liu YJ, Pulendran B, Palucka K. Immunobiology of dendritic cells. Annu Rev Immunol. 2000;18:767–811. doi: 10.1146/annurev.immunol.18.1.767. [DOI] [PubMed] [Google Scholar]
- Barron MA, Blyveis N, Palmer BE, MaWhinney S, Wilson CC. Influence of plasma viremia on defects in number and immunophenotype of blood dendritic cell subsets in human immunodeficiency virus 1-infected individuals. J Infect Dis. 2003;187:26–37. doi: 10.1086/345957. [DOI] [PubMed] [Google Scholar]
- Borrow P, Shattock RJ, Vyakarnam A. Innate immunity against HIV: a priority target for HIV prevention research. Retrovirology. 2010;7:84. doi: 10.1186/1742-4690-7-84. [DOI] [PMC free article] [PubMed] [Google Scholar]
- Cao W, Liu YJ. Innate immune functions of plasmacytoid dendritic cells. Curr Opin Immunol. 2007;19:24–30. doi: 10.1016/j.coi.2006.11.004. [DOI] [PubMed] [Google Scholar]
- CDC (U.S.) 1994 Revised classification system for Human Immunodeficiency Virus Infection in children less than 13 years of age, Morbidity and Mortality weekly Report : a compilation of 1994 MMWR articles on HIV Infection and AIDS. Atlanta, Georgia: Centers for Disease Control and Prevention; 1994. [Google Scholar]
- Chehimi J, Campbell DE, Azzoni L, Bacheller D, Papasavvas E, Jerandi G, Mounzer K, Kostman J, Trinchieri G, Montaner LJ. Persistent decreases in blood plasmacytoid dendritic cell number and function despite effective highly active antiretroviral therapy and increased blood myeloid dendritic cells in HIV-infected individuals. J Immunol. 2002;168:4796–4801. doi: 10.4049/jimmunol.168.9.4796. [DOI] [PubMed] [Google Scholar]
- Devi NP, Shenbagavalli R, Ramesh K, Rathinam SN, Swaminathan S. Rapid progression of HIV infection in infancy. Indian Pediatr. 2009;46:53–56. [PubMed] [Google Scholar]
- Donaghy H, Gazzard B, Gotch F, Patterson S. Dysfunction and infection of freshly isolated blood myeloid and plasmacytoid dendritic cells in patients infected with HIV-1. Blood. 2003;101:4505–4511. doi: 10.1182/blood-2002-10-3189. [DOI] [PubMed] [Google Scholar]
- Fauci AS. Immunopathogenesis of HIV infection. J Acquir Immune Defic Syndr. 1993;6:655–662. [PubMed] [Google Scholar]
- Feldman S, Stein D, Amrute S, Denny T, Garcia Z, Kloser P, Sun Y, Megjugorac N, Fitzgerald-Bocarsly P. Decreased interferon-alpha production in HIV-infected patients correlates with numerical and functional deficiencies in circulating type 2 dendritic cell precursors. Clin Immunol. 2001;101:201–210. doi: 10.1006/clim.2001.5111. [DOI] [PubMed] [Google Scholar]
- Grassi F, Hosmalin A, McIlroy D, Calvez V, Debre P, Autran B. Depletion in blood CD11c-positive dendritic cells from HIV-infected patients. AIDS. 1999;13:759–766. doi: 10.1097/00002030-199905070-00004. [DOI] [PubMed] [Google Scholar]
- Hemmi H, Kaisho T, Takeuchi O, Sato S, Sanjo H, Hoshino K, Horiuchi T, Tomizawa H, Takeda K, Akira S. Small anti-viral compounds activate immune cells via the TLR7 MyD88-dependent signaling pathway. Nat Immunol. 2002;3:196–200. doi: 10.1038/ni758. [DOI] [PubMed] [Google Scholar]
- Ida JA, Shrestha N, Desai S, Pahwa S, Hanekom WA, Haslett PA. A whole blood assay to assess peripheral blood dendritic cell function in response to Toll-like receptor stimulation. J Immunol Methods. 2006;310:86–99. doi: 10.1016/j.jim.2005.12.008. [DOI] [PubMed] [Google Scholar]
- Ito T, Amakawa R, Kaisho T, Hemmi H, Tajima K, Uehira K, Ozaki Y, Tomizawa H, Akira S, Fukuhara S. Interferon-alpha and interleukin-12 are induced differentially by Toll-like receptor 7 ligands in human blood dendritic cell subsets. J Exp Med. 2002;195:1507–1512. doi: 10.1084/jem.20020207. [DOI] [PMC free article] [PubMed] [Google Scholar]
- Jarrossay D, Napolitani G, Colonna M, Sallusto F, Lanzavecchia A. Specialization and complementarity in microbial molecule recognition by human myeloid and plasmacytoid dendritic cells. Eur J Immunol. 2001;31:3388–3393. doi: 10.1002/1521-4141(200111)31:11<3388::aid-immu3388>3.0.co;2-q. [DOI] [PubMed] [Google Scholar]
- Kadowaki N, Ho S, Antonenko S, Malefyt RW, Kastelein RA, Bazan F, Liu YJ. Subsets of human dendritic cell precursors express different toll-like receptors and respond to different microbial antigens. J Exp Med. 2001;194:863–869. doi: 10.1084/jem.194.6.863. [DOI] [PMC free article] [PubMed] [Google Scholar]
- Krug A, Towarowski A, Britsch S, et al. Toll-like receptor expression reveals CpG DNA as a unique microbial stimulus for plasmacytoid dendritic cells which synergizes with CD40 ligand to induce high amounts of IL-12. Eur J Immunol. 2001;31:3026–3037. doi: 10.1002/1521-4141(2001010)31:10<3026::aid-immu3026>3.0.co;2-h. [DOI] [PubMed] [Google Scholar]
- Levy JA. Pathogenesis of human immunodeficiency virus infection. Microbiol Rev. 1993;57:183–289. doi: 10.1128/mr.57.1.183-289.1993. [DOI] [PMC free article] [PubMed] [Google Scholar]
- Liu YJ. IPC: professional type 1 interferon-producing cells and plasmacytoid dendritic cell precursors. Annu Rev Immunol. 2005;23:275–306. doi: 10.1146/annurev.immunol.23.021704.115633. [DOI] [PubMed] [Google Scholar]
- Macatonia SE, Lau R, Patterson S, Pinching AJ, Knight SC. Dendritic cell infection, depletion and dysfunction in HIV-infected individuals. Immunology. 1990;71:38–45. [PMC free article] [PubMed] [Google Scholar]
- NACO Report. Guidelines for HIV care & treatment in infants & children. Indian Academy of Pediatrics & NACO Report. 2006 [Google Scholar]
- Siegal FP, Kadowaki N, Shodell M, Fitzgerald-Bocarsly PA, Shah K, Ho S, Antonenko S, Liu YJ. The nature of the principal type 1 interferon-producing cells in human blood. Science. 1999;284:1835–1837. doi: 10.1126/science.284.5421.1835. [DOI] [PubMed] [Google Scholar]
- Soumelis V, Scott I, Gheyas F, Bouhour D, Cozon G, Cotte L, Huang L, Levy JA, Liu YJ. Depletion of circulating natural type 1 interferon-producing cells in HIV-infected AIDS patients. Blood. 2001;98:906–912. doi: 10.1182/blood.v98.4.906. [DOI] [PubMed] [Google Scholar]
- Usuga X, Montoya CJ, Landay AL, Rugeles MT. Characterization of quantitative and functional innate immune parameters in HIV-1-infected Colombian children receiving stable highly active antiretroviral therapy. J Acquir Immune Defic Syndr. 2008;49:348–357. doi: 10.1097/qai.0b013e31818c16ff. [DOI] [PubMed] [Google Scholar]
- Zhang Z, Wang FS. Plasmacytoid dendritic cells act as the most competent cell type in linking antiviral innate and adaptive immune responses. Cell Mol Immunol. 2005;2:411–417. [PubMed] [Google Scholar]
- Zhang Z, Fu J, Zhao Q, He Y, Jin L, Zhang H, Yao J, Zhang L, Wang FS. Differential restoration of myeloid and plasmacytoid dendritic cells in HIV-1-infected children after treatment with highly active antiretroviral therapy. J Immunol. 2006;176:5644–5651. doi: 10.4049/jimmunol.176.9.5644. [DOI] [PubMed] [Google Scholar]


